TRXUSDT.3S trade ideas

TRXUSD: Daily VCPVCP: 4W 11/6 3T
The posted chart contains a VCP (volatility contraction pattern). The first label "W" stands for weekly and shows the duration of the entire consolidation. In the middle label, the percentage of contractions is indicated (for example, "15/4"), with 15 representing the -15% depth of the base and 4 representing -4% of the last contraction. The last part "T" represents the number of contractions. The light blue lines in the chart correspond to the contractions. A more detailed description can be found in Mark Minervini's books.
RS stands for relative strength and measures the strength of the stock compared to the overall market. The value range is 1-99 with 99 being the highest value. The rank was generated by fyntrade.

TRONUSDT (Daily) - Bullish breakoutHi Traders
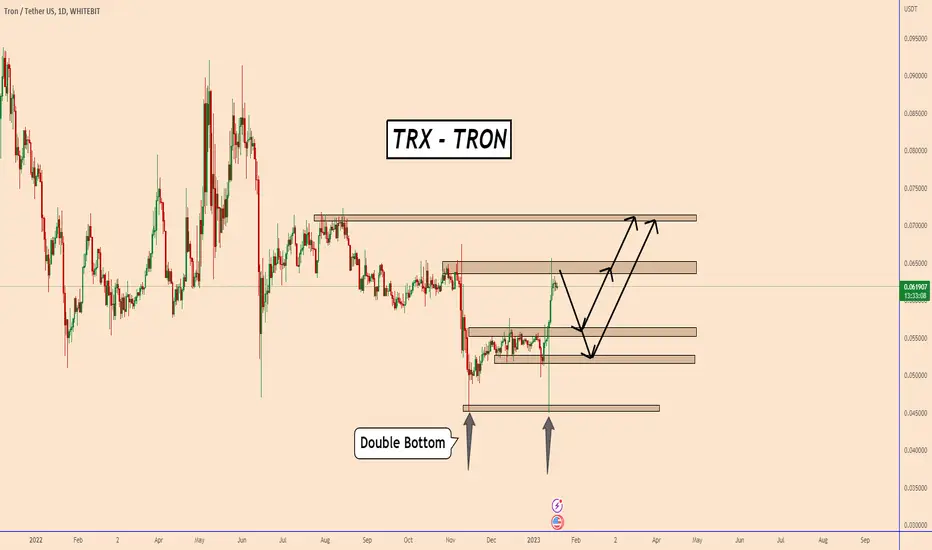
TRONUSDT (Daily Timeframe)
The market is in an uptrend and we are waiting for an entry signal to go LONG above the 0.0659 resistance level. Only the downward break of 0.0587 would cancel the bullish scenario.
Trade details
Entry: 0.0659
Stop loss: 0.0587
Take profit 1: 0.0700
Take profit 2: 0.0770
Score: 8
Strategy: Bullish breakout

TRXUSDT will TRX USDT reach the key level at the price of 0.072 or even 0.12 ?
comparatively large sums have appeared in the footprint, after the liquidity stage for the sellers, that was my motivation to open this transaction

TRX Breaking Out the Triangle which is the 4th WaveTRX Breaking Out the Triangle which is the 4th Wave. Projection based on 0.618% fib extension.


trx usdtThe higher time frame is showing a good support zone now just wait for a retest hopefully it will happen

🔥TRON IS GOING TO BREAK THE 2-YEAR TRIANGLE: PUMP SOON?🚀🔥Hi friends! First of all, take a look at the chart. See how the whales accumulate their positions: sl hunting and volume confirmation? This is a perfect example of how they work.
📊 MY TRADING PLAN FOR TRX:
1. squeeze to the trendline
2. sl hunting below the POC area ($0.06-0.064)
3. bullish BTC
🚩 I think that this squeeze to the global trendline will be successful and TRX will break it with PUMP. This will be the best scenario,
✅ MY TARGETS FOR TRX:
🔥 $0.072 - the key level
🔥 $0.092 - the key level
🔥 $0.12 - the local high and key level
Traders, will TRX become the top gainer of the bull market? According to this triangle pattern, the target is at least +290%. Write your thoughts in the comments!
💻Friends, press the "boost"🚀 button, write comments and share with your friends - it will be the best THANK YOU.
P.S. Personally, I open an entry if the price shows it according to my strategy.
Always do your analysis before making a trade.

#TRX/USDT [TRON]: Descending_ChannelWe've detected a Falling Wedge pattern on the $TRX/USDT chart. This pattern is a bullish indication and could indicate a potential trend reversal. We may consider buying at the current price zone and targetting higher level.

TRON Weekly View - JANUARY 2023Hello Guys, Weekly Analysis is on the TRON Symbol in a 4H Time frame, I Hope it Will be Useful for You, Don't Forget to Like, Follow, Comment


✅TS ❕ TRXUSD: broke the ascending structure✅✅ TRX is held under at the bottom of the consolidation zone.
Price is trying to break the structure.
I expect further decline. ✅
🚀 SELL scenario: short to the lower boundary of upward channel . 🚀
----------------------------------------------------------------------------
Remember, there is no place for luck in trading - only strategy!
Thanks for the likes and comments

trxusdtPay attention that the condition of this movement is that the trend line is broken with good strength and the price stabilizes above the first pink area, that is, it closes in the daily time or a few candles in the four-hour time.

TRXUSD ❕ liquidity zoneTron is trading in the liquidity zone.
Price is testing 50EMA as support (4H TF)
I expect price to rise while holding in the liquidity zone.


TRX | DECRYPTERS | TRON | JUSTIN SUN HI people welcome to Team Decrypters
TRX is the native cryptocurrency of the TRON network and is used to facilitate transactions on the network, as well as to pay for the creation and execution of smart contracts.
we are expecting move to the upsdie Soon in tron so we are buyers in TRX

TRXUSDT Ready For Takeoff!TRXUSDT Technical analysis update
If the price breaks above the resistance line then we can expect a good up move in Tron.
Buy zone: Below $0.062
Stop loss: $0.054
Take Profit 1: $0.068
Take Profit 2: $0.077
Take Profit 3: $0.092
Take Profit 4: $0.115
Always keep stop loss
Thanks
Hexa

TRXUSD ❕ correctionTRX trades under liquidity.
Trading volumes remain low.
Price in overbought RSI zone (1H and 30m TFs)
Asset tests 200EMA as resistance (30m TF)
I expect the continuation of the correction after fixing under the liquidity zone.

TRXUSDT Analysis -20 JANUARY 2023Hello Guys, Today's Analysis is on the TRXUSDT Symbol in a 1H Time frame, I Hope it Will be Useful for You, Don't Forget to Like, Follow, Comment

TRXUSDT - Short by Supertrend, ADX & MA 1/20/20231. ADX INDICATOR: 1h & 4h timeframe have a strong strength for open trade.
- ADX smoothing: 14.
- DI length: 14.
- ADX STRONG > 25.
2. SUPERTREND INDICATOR:
- Short trend when closes candle is below the red line.
3. MOVING AVERAGE INDICATOR:50
- Short trend when closes candle is below MA line.
4. - SELL/SHORT: reject to Supertrend at current timeframe.

TRX: Overbought at ResistanceTRON (TRX) technical analysis:
Trade setup : Price rebounded from $0.05 support and rallied hard above 200-day moving average, down trendline, and reached $0.065 horizontal resistance. However, it’s overbought (RSI > 70) and likely to pull back before resuming uptrend.
Trend : Uptrend on Short- and Medium-Term basis and Downtrend on Long-Term basis.
Momentum is Bullish ( MACD Line is above MACD Signal Line and RSI is above 55).
Support and Resistance : Nearest Support Zone is $0.058 (previous resistance), then $0.050. The nearest Resistance Zone is $0.065, then $0.070.

TRON: Price Should Begin The Correction SoonTRON: Price Should Begin The Correction Soon
As we can see the price stopped the bullish move for the time being
after the crypto optimism.
Was this move too optimistic?
it could be too optimistic, however, the market wants to trade as it was
in silence for a long period of time.
However, testing these areas at a time when the crypto market is not solid
yet is a bit risky for us to anticipate the next bullish wave.
We have to wait again...what comes fast...most of the time goes away faster.
Thank you and Good Luck!