Tron Wave Analysis – 3 September 2025
- Tron reversed from the support zone
- Likely to rise to resistance level 0.3495
Tron recently reversed from the support zone between the support level 0.3310 (low of wave b from August), lower daily Bollinger Band and the 50% Fibonacci correction of the upward impulse form July.
This support zone was further strengthened by the upper trendline of the multi-month up channel from March (acting as the support after it was broken).
Given the clear uptrend and the oversold daily Stochastic, Tron can be expected to rise to the next resistance level 0.3495, former monthly high from July.
TRXUST trade ideas

Troncoin long to $0.34416Just recently opened a long position on troncoin
Sl: 0.33916
Based on my htf DTT analysis market is likely to pump to retest $0.34416 at least before likely reversal back down

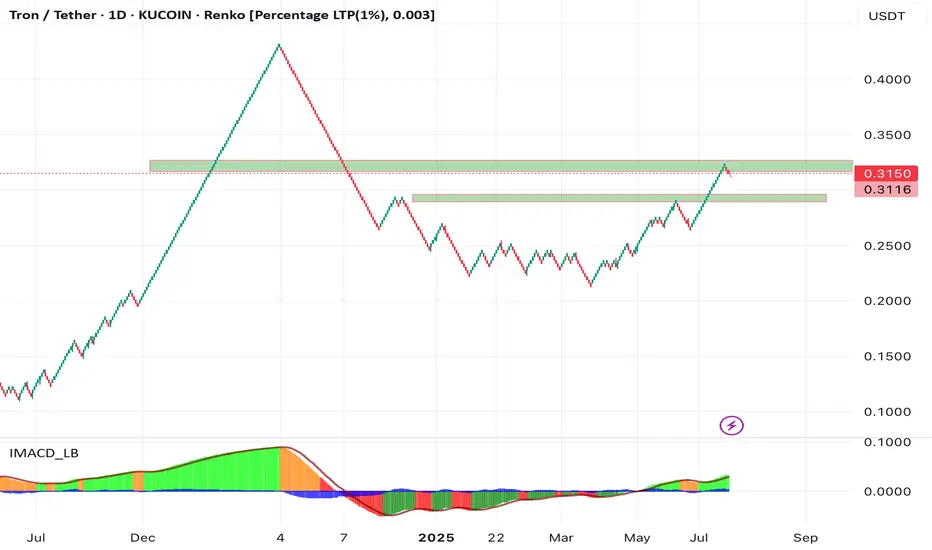
Remarkable Growth in TRON (TRX/USDT) Stability and Price – SuppoIn recent months, the TRON (TRX) network and price have witnessed remarkable stability and growth. According to a recent analysis by CryptoOnchain published on the CryptoQuant platform, one of the main indicators of this stability has been the unprecedented consistency in daily block production on the TRON network. The report highlights that the daily block count has remained nearly constant (around 28,500 blocks), mainly attributed to recent technical improvements, an increase in network energy capacity, and the implementation of a dynamic energy model.
On the provided Renko chart, TRX’s positive price momentum is also clear. Following the recovery from the 0.20–0.22 support zone and strengthening bullish momentum (as indicated by the histogram indicator), a breakout above the $0.3150 resistance could accelerate the upward trend.
Technical & Fundamental Context:
Based on the CryptoOnchain analysis on CryptoQuant: The network’s energy capacity has doubled and a dynamic energy model has been implemented, ensuring operational stability even alongside record transaction volumes.
Despite high on-chain activity, the block production rate has stayed stable, and strong fundamentals supported by security upgrades continue to strengthen both the network and price.
Technically, reclaiming key supports, holding above the Ichimoku cloud, and positive signals from the IMACD_LB indicator all confirm the strength of the trend.
Summary:
The synergy between strong fundamentals (as highlighted in the CryptoOnchain/CryptoQuant analysis) and the chart’s technical structure creates a positive outlook for TRX. If the price holds above the 0.22–0.25 support and overcomes the $0.3150 resistance, higher targets become more likely.
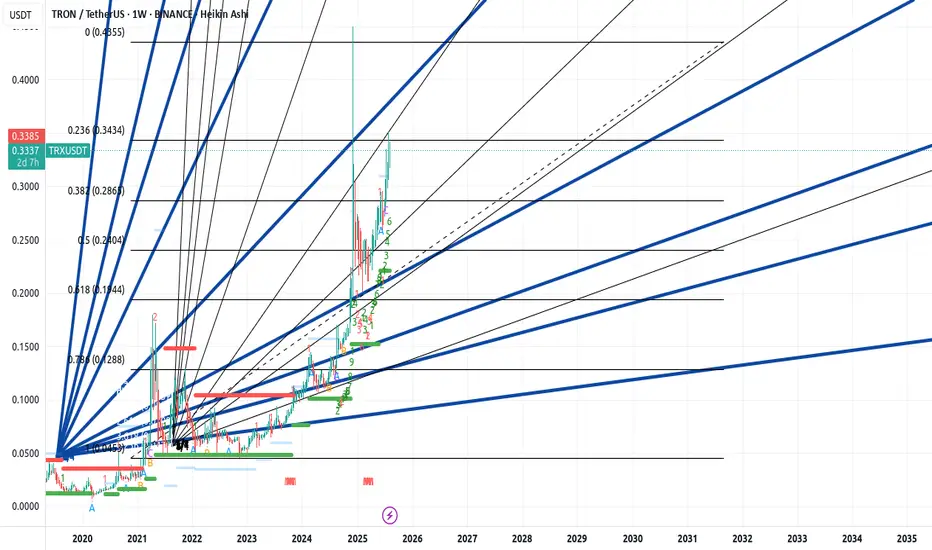
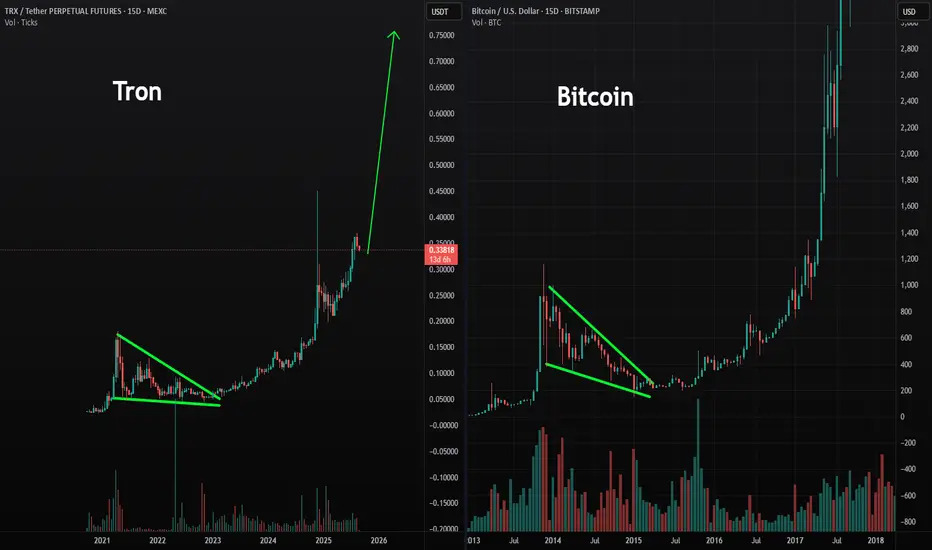
Tron is set up for a mega pump, just like Bitcoin in 2017!I believe a massive pump is coming for Tron. The chart is showing a pattern very similar to Bitcoin in 2017. Markets are fractal in nature, and these patterns tend to repeat over and over. Tron could be an excellent hold during the mass adoption phase we’re heading into.
As always, stay profitable.
- Dalin Anderson
DeGRAM | TRXUSD will retest the support level📊 Technical Analysis
● TRX remains inside a broad descending channel, with price recently rebounding from the $0.336–0.338 support zone and forming a higher low structure.
● Short-term momentum suggests a corrective bounce toward $0.3459 and potentially $0.3515, provided buyers hold above $0.3394.
💡 Fundamental Analysis
● TRON’s network continues to expand its dominance in stablecoin transfers, with USDT transaction volumes hitting new highs, reinforcing TRX’s role in DeFi and boosting underlying demand.
✨ Summary
Bullish above $0.3394; targets $0.3459 → $0.3515. Invalidation on a close below $0.336.
-------------------
Share your opinion in the comments and support the idea with a like. Thanks for your support!

Tron (TRX): Moving like SP500 | $0.40 is HappeningTRX is still a good investment in our opinion;ever since the end of May, we have been aiming for the $0.40 zone to be reached.
The 100 and 200 EMAs are both bullish and the price keeps that buyside momentum pretty well so we will keep on riding that trend as long as we are above the EMAs! ($0.40 is the target but it might not be the final stop.)
Swallow Academy

DeGRAM | TRXUSD is preparing for a rebound📊 Technical Analysis
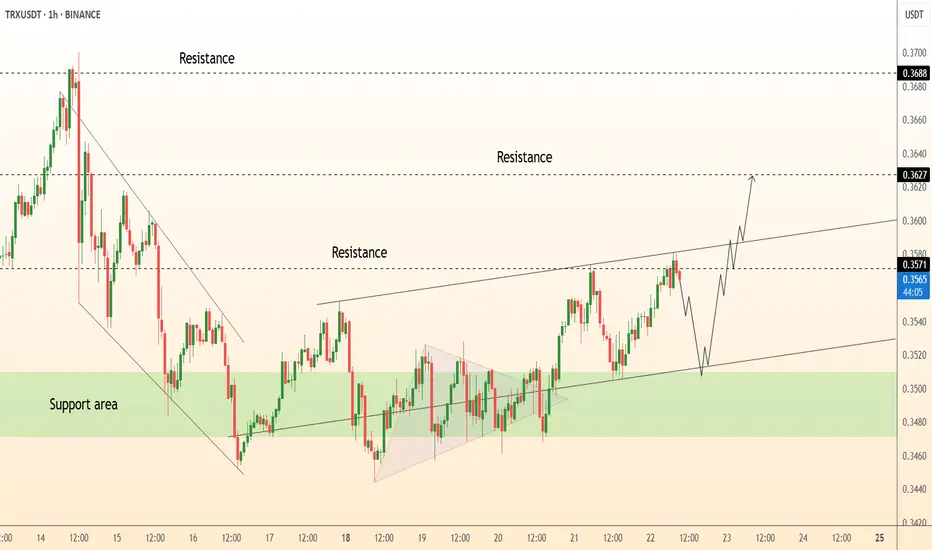
● TRX is consolidating inside a rising channel, bouncing strongly from the $0.3500 support area while eyeing resistance near $0.3627.
● Price action suggests a potential retest of lower channel support before resuming upward momentum toward $0.3688, confirming bullish continuation.
💡 Fundamental Analysis
● Recent news highlights TRON’s network leading in stablecoin transfers, with USDT activity surpassing Ethereum, boosting demand for TRX and reinforcing its utility.
✨ Summary
Long above $0.3500; breakout toward $0.3627 and $0.3688 expected. Invalidation below $0.3500.
-------------------
Share your opinion in the comments and support the idea with a like. Thanks for your support!
TRX 4H👁️👁️First key zone: 0.3540 and 0.3474, to continue the uptrend, which shows no signs of weakness.👁️👁️

Troncoin long to $0.36741Tp: 0.36741
sl: 0.36283 or lower
Time sensitive
Anticipate bulls will push to make new highs today

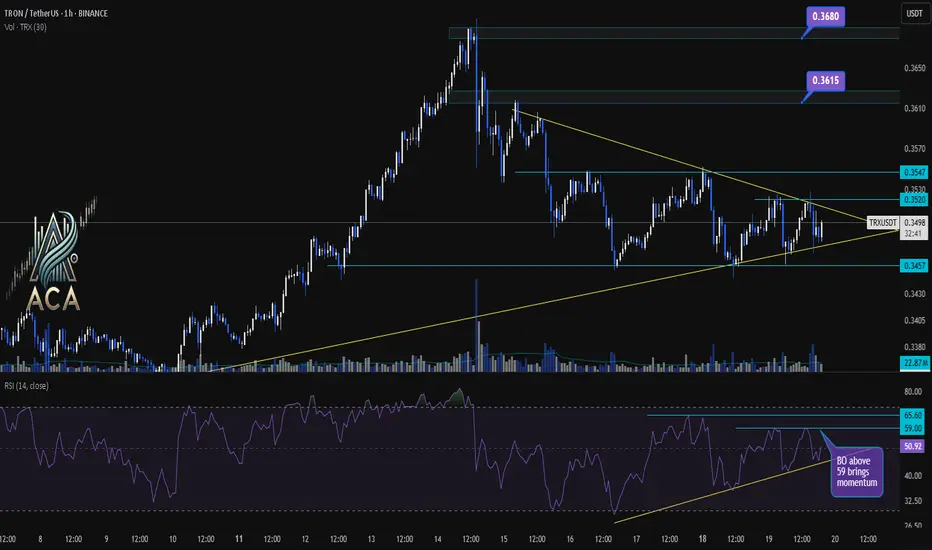
TRXUSDT 1H Chart Analysis | Eyeing the Breakout for MomentumTRXUSDT 1H Chart Analysis | Eyeing the Breakout for Momentum
🔍 Let’s break down TRX/USDT price action and identify setups that could unlock the next move, with a spotlight on RSI dynamics and key breakout levels.
⏳ 1-Hour Overview
The chart is currently forming a tightening symmetrical triangle, signaling a squeeze ahead of an expected breakout. Price action is consolidating between the local support at $0.3457 and resistance near $0.3520–$0.3547.
📈 RSI Insights
- The RSI sits around 48, reflecting short-term indecision and neutral momentum.
- There’s a clear RSI trendline forming higher lows, indicating underlying strength building up.
- Watch closely: An RSI breakout above 59 is flagged as a momentum trigger, historically driving stronger moves.
📊 Key Highlights:
- Chart pattern: Tightening triangle points to an imminent volatility expansion.
- Price structure: Breakout (BO) above $0.3520 or, more convincingly, $0.3547 opens up higher targets.
- Bullish targets: $0.3615 and $0.3680—these mark the next resistance zones if upside momentum takes over.
- RSI dynamics: Trendline support on RSI signals hidden demand; BO above 59 on RSI can fuel upside moves.
🚨 Conclusion:
TRX is at a make-or-break juncture. A decisive breakout above $0.3520 or, even better, $0.3547 could unlock a rally to $0.3615 and $0.3680. Keep a close eye on the RSI—trendline holds and a thrust above 59 can serve as early confirmation of buyer strength.
TRX Bearish📊 TRXUSDT (8H) – Technical Analysis
TRX has been moving within an ascending channel (blue lines) over the past weeks, repeatedly testing both the upper and lower boundaries. After the recent peak, a stronger correction started and is still in progress.
🔻 Based on the chart, there is a potential -13.7% pullback, pointing to the following key support levels:
• 0.3347 USDT – first support (previous local low, yellow line).
• 0.3185 USDT – stronger support zone that has been tested multiple times.
• 0.3006 USDT – major support level, aligned with the projected target area.
📌 Scenarios:
• As long as TRX stays within the ascending channel, the trend remains bullish.
• Losing the 0.3347 and 0.3185 supports could open the way down to 0.3006.
• On the upside, resistance is seen near 0.36.

Tron long to $0.35520 then 0.37sl: 0.34811
tp: 0.35520
Roughly 5RR
By end of weekly tron is likely to return to $0.37 target area and possibly higher. 4hr is bearish right now but will need to shift back bullish to facilitate this move. Target is 4hr lower high. Afterwards another correction is likely which can provide another entry for long up to $0.37

Tron weekend short to 0.3416sl: 0.34929
Tp area: 0.34160
2.3-3.2 risk to reward
Manage risk to what you can afford to lose. Set alerts near tp. Set limit order take profits and enjoy the weekend.

TRX/USDT Breakout Robbery – High Voltage Bullish Target Ahead🔥 TRX/USDT “TRON vs Tether” — Bullish Heist Operation 🔥
💎 Attention Money Makers & Market Robbers 💎
The vault is open and the TRX/USDT crypto bank is loaded! We’re rolling in with the Thief Trader Layering Strategy — stacking multiple buy limit orders like C4 charges on key price floors. This isn’t just trading… this is a high-voltage robbery plan ⚡🏴☠️
📈 Entry Plan (Infiltration):
No fancy timing here — any price level is a potential entry zone. We’ll be scaling in with precision to bait the market makers and ride the bullish tide.
🛑 Stop Loss (Escape Route):
0.3300 — the ultimate safe exit door. Breach that, and we vanish into the shadows before the cops (market reversal) arrive 🚔💨
🎯 Target (The Loot):
0.3610 — High Voltage Electric Resistance ⚡ + Overbought Fence Level 🚧. This is where the market will be too hot for the bears to touch.
💡 Tactical Notes:
We’re hunting in the bullish zone — only go long.
Stack positions smartly to trap weak hands and squeeze shorts.
The closer we get to target, the more the tension rises — exit like a ghost if volatility explodes.
📢 Trader Alert:
The market is charged with momentum ⚡. Keep your alerts active, and be ready to hit the green button before the crowd catches on.
❤️ Support the Crew:
Smash that Boost so the robbery squad gets stronger. Every click fuels more heists, more wins, and more profits 🤑💼💣
TRX/USDT Bullish Robbery Plan — We enter quiet, exit loud, and leave the market in smoke 💨🚀

Important Area: 0.30771-0.33084
Hello, fellow traders!
Follow us to get the latest information quickly.
Have a great day!
-------------------------------------
(TRXUSDT 1D Chart)
TRX is one of those coins (tokens) that has a lot of users, yet feels neglected.
For TRX to maintain its uptrend, the price must remain above the 0.30771-0.33084 range.
The circled areas represent important support and resistance zones.
When the M-Signal indicator on the 1W chart rises near the 0.30771-0.33084 range, a price decline below that level is highly likely to trigger a downtrend.
-
Thank you for reading to the end.
I wish you successful trading.
--------------------------------------------------
- This is an explanation of the big picture.
(3-year bull market, 1-year bear market pattern)
I will explain in more detail when the bear market begins.
------------------------------------------------------

Tron Wave Analysis – 15 August 2025- Tron reversed from a daily up channel
- Likely to fall to support level 0.3400
Tron cryptocurrency recently reversed from the resistance trendline of the narrow daily up channel from the end of June – standing well above the upper daily Bollinger Band.
The downward reversal from the resistance trendline created the daily Japanese candlesticks reversal pattern long-legged Doji.
Given the strongly bearish sentiment seen across the crypto markets today and the overbought daily Stochastic, Tron cryptocurrency can be expected to fall to the next support level 0.3400.

Tron (TRX): Bullish Since $0.24 | Aiming For $0.40TRX has performed very well, and we have had multiple trades opened since $0.24. Seeing still bullish signs so see you all at $0.40.
More in-depth info is in the video—enjoy!
Swallow Academy

TRX | TRON Goes BananasTRON Goes Full Banana Mode : Breaking Records and Throwing Peels at XRP!
TRX is up 500% since our first signal , so it’s officially time to party! order some lambos buy some bananas and let’s celebrate like crypto maniacs🎉🚀🍌
Currently priced at $0.38, it’s up a whopping +70% in just 24 hours. That’s the kind of growth that makes even Bitcoin blush. Speaking of records, TRON hit an all time high of $0.43 today, December 4, 2024, but it’s cooled off a bit, sitting just 10% shy of that milestone.
With a circulating supply of 86.29 billion TRX tokens (maxed out at the same number, like an all-you-can-eat buffet that’s finally closed), TRON isn’t playing around. Its 24 hour trading volume? A casual $5.50 billion, mostly on Binance, which is practically TRX’s second home. TRON now claims 0.90% of the entire crypto market, flexing a $33.60 billion market cap!
After altcoins like DOGE, XRP, HBAR, and XLM strutted their stuff, TRX stormed onto the scene and stole the show. Yesterday, it rocketed from $0.23, smashed through its 2018 ATH like a Kool-Aid man, and set its sights on $0.43.
This price explosion wasn’t just luck or hype. TRON’s ecosystem has been buzzing with activity. It’s dominating Tether transactions, launching flashy projects like Sun.Pump (sounds like a cryptocurrency gym), and riding on the relentless promotional energy of founder Justin Sun. He’s been spending cash like a kid in a candy store, including a hefty investment in Donald Trump’s crypto project and yeah the 6.2 million dollar BANANA was the main factor!
Speaking of Sun, he stirred the pot on Twitter by cryptically declaring, “TRX = XRP.” Bold move, Justin. For context, XRP skyrocketed after Trump’s election win and SEC Chair Gary Gensler’s dramatic exit. At one point, it gained over 420% in a month. XRP also hit a multi-year high this week near $3 and climbed to become the third-largest cryptocurrency by market cap.
TRX’s comparatively “modest” monthly surge of 135% isn’t as flashy, but hey, breaking an all-time high is still a flex. TRON’s market cap is about 5x smaller than XRP’s for now, but in crypto, anything can happen. With this much drama, who needs Netflix?
Always take profits, enjoy your trades, and celebrate your wins


Trx pump to $0.352 todayTrx long
Good chance it might correct lower before tp but am okay with entry here
SL: 0.34112
2RR

tron (TRX)trx usdt daily analyses
time frame 4 hours
risk riwards ratio > 3.5 (woooow)
****** ( My condolences to those who lost their lives in the California fires.) *******
there is no volume in the market yet.
RSI is in the bottom of chart
price is in the down side of triangle and sellers couldn't break the support line ( 0.225$)
I set LS on the down of another support line on 0.195$
if we hear a good news about cryptocurrency market or tron , maybe a pump happens and good benefit for traders.
be careful for stop hunters. in this situations

TronTrx usdt Daily analysis
Time frame hourly
Short time Target 0.278 $
Risk rewards ratio >3.5 👈👌
This short time analysis is in the big Daily analysis that you can see in my forecasts before

6 is not far from 9 and already good enough hereClose to another decision point level. Watching reaction is a must. This is a chart i forgot about but it seems it works surprisingly well.