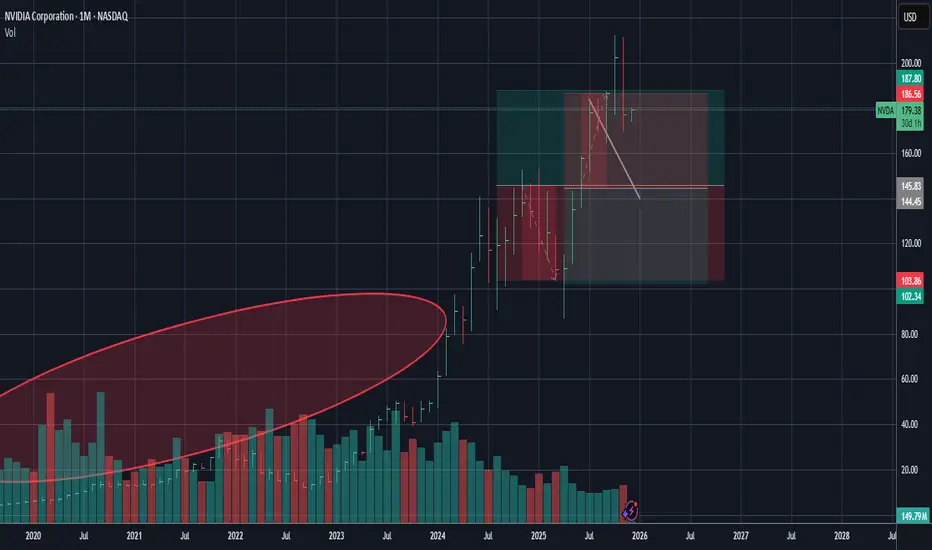
Nvidia - The correction just started!💉Nvidia ( NASDAQ:NVDA ) is now heading lower:
🔎Analysis summary:
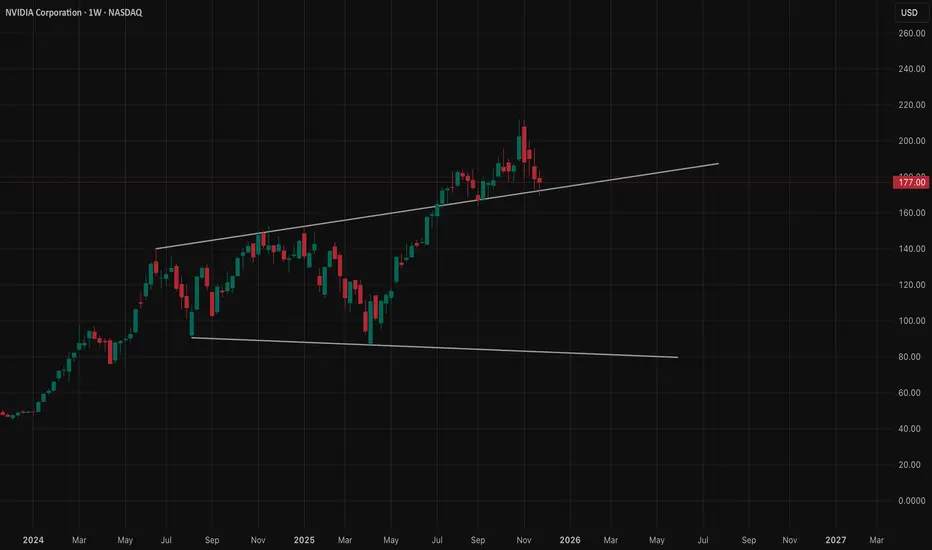
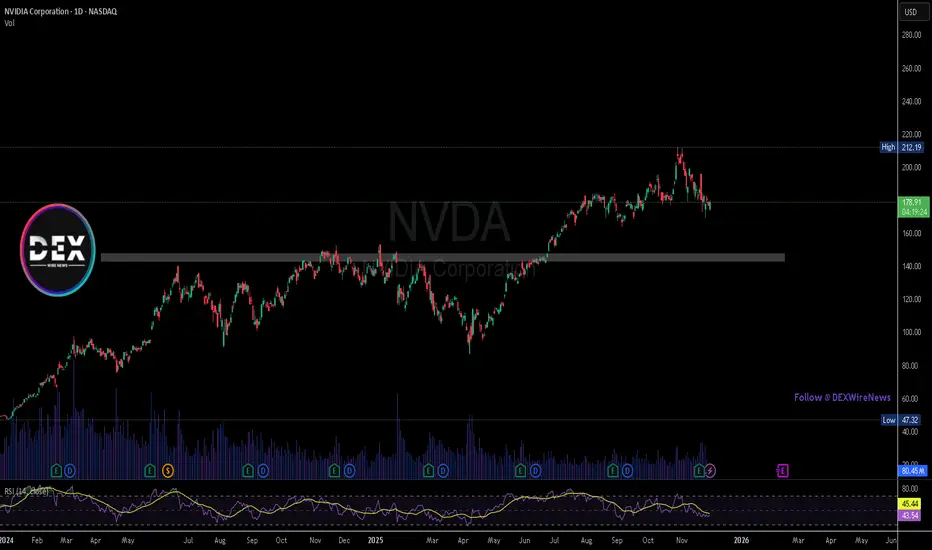
Just recently, Nvidia once again retested the major rising channel resistance trendline. Together with November's bearish engulfing candle, Nvidia is slowly shifting bearish. And before Nvidia will retest the next major support area, we can see a drop of another -15%.
📝Levels to watch:
$150
SwingTraderPhil
SwingTrading.Simplified. | Investing.Simplified. | #LONGTERMVISION
Trade ideas

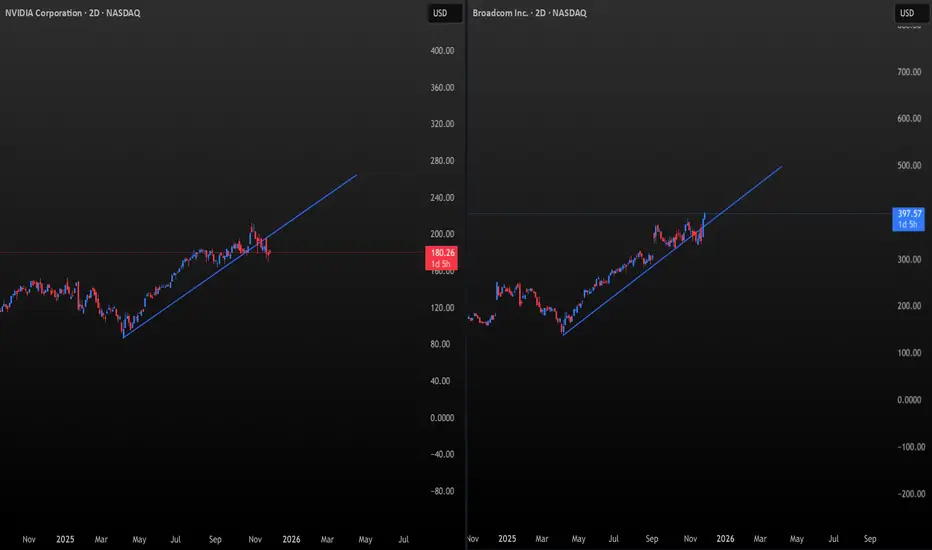
NVDA vs AVGO: The Battle for the AI Throne Has Begun⚡A New Leader Emerges in the Semiconductors
For years, NVDA was the undisputed titan — the gravitational center of the semiconductor universe.
But now, the geometry tells a different story.
THE CHARTS 📐
Both charts use the same natural scaling:
1° of time = $1 of price per unit.
And here’s the critical observation:
NVDA has broken beneath its 1° angle.
AVGO has recaptured and accelerated above its 1° angle.
AVGO has already made new all-time highs.
During a semiconductor correction.
While SMH was down.
While the S&P 500 retraced.
The real question still remains however, are we still in the early innings of the AI Boom?
SMH — The Semiconductor Supercycle Update
The Structure That Defines the AI Era🏛️
The 2023–2027 channel is the master structure for this entire semiconductor cycle.
SMH bounced precisely where the primary and secondary angles intersect.
🚀 Market Knots — Speed & Acceleration Confirm the Turn
Speed found support precisely at the median line around 126 Market Knots — the natural mid-energy band where major long-term advances restart.
Acceleration appears to have:
🔻spiked,
📉bottomed, and
is now curling upward.
Poised to turn positive
The measurements point to a weekly bottom and another wave higher in this semiconductor cycle fueled by AI growth.
The Leadership Rotation🏅 (The Baton Moment)
AVGO is emerging as the structural leader of the AI supercycle.
It has already demonstrated exceptional strength:
holding its 1° angle, breaking into new all-time highs, and accelerating while the rest of the semiconductor sector underperformed.
This behavior is not random.
It reflects Broadcom’s unique position at the infrastructure core of AI — the networking, switching, optical, and custom ASIC layer that becomes the bottleneck after GPUs.
As the semiconductor supercycle builds, AVGO steps forward as the defining leader of the AI boom
NVDA🌎NVIDIA: At the Peak or the Brink?
Nvidia's record highs are accompanied by warning signs. A market cap of $4.37 trillion and a P/E ratio of 51 indicate inflated expectations.
Risks:
Speculative demand: The $23.7 billion investment looks like an artificial market pump.
Macro threats: The AI boom will face energy shortages.
Historical parallel: The scenario mirrors Cisco's pre-dot-com bubble.
Fierce competition: AMD, Intel, and cloud giants are creating their own chips.
Growth drivers:
Leadership in AI, a closed CUDA ecosystem, and 66% data center revenue growth.
Nvidia is a leader, but its shares have become a high-risk asset. Any slowdown in business performance will lead to a collapse in the stock price.
The baseline scenario is a broad sideways trend.

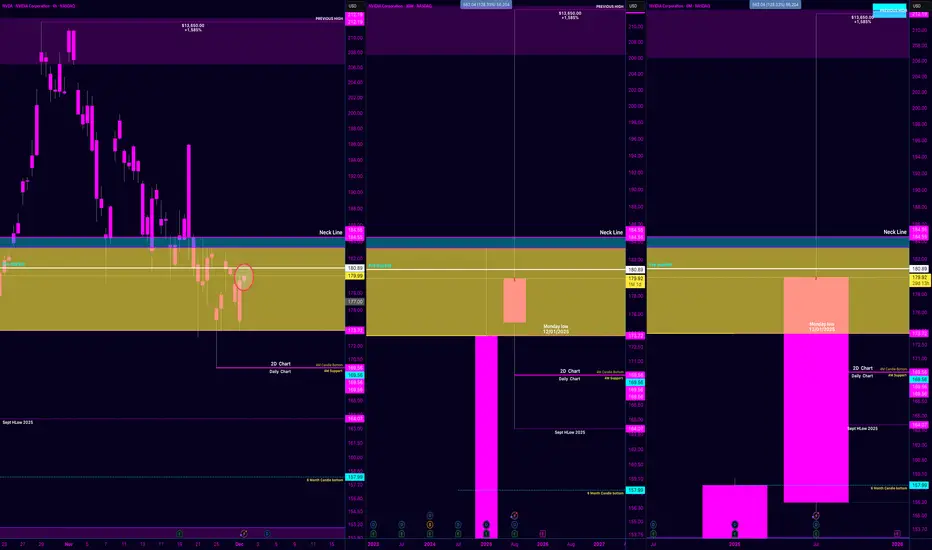
Are we going to the Moon with NVDA?Analysis breakdown based on your 15M, 4H, 30W, 6M, and 4H Pyth chart stack:
15M + 4H (Top Left & Bottom Left)
Price is coiling in a tight consolidation range between ~$177.08 and $179.99 ( yellow zone).
This oval region circled on the 15M is a classic compression pattern—looks like it's building energy for a breakout.
It's sitting just under the Neckline at $184.55, which aligns with historical resistance.
Implication: If this flag or range resolves bullish, it could trigger a rapid move to test that neckline (short-term target zone).
Weekly (30W) & Biannual (6M) – Top Middle/Right
These candles are inside the key yellow structure block as well.
The current price is reacting off the bottom of my yellow box, now pressing into the midpoint of the structure.
And why this stands out is the biannual candle (6M) shows a potential reversal candle forming off support—rare signal at this TF if confirmed.
Price targets
1st $184.55 (Neckline) High (structure alignment)
2nd $195–200 (gap fill above neckline) Medium
3rd $212.19 (Magnet Zone / Prev High)
I need to see some momentum happing THIS MONTH and for the looks of it price is looking like its gearing up and ready .
Market Conditions are the Cycle of a Bull or Bear MarketEverything you are learning is beneficial to your trading so long as the information is factual and accurate and NOT hype, scams, fraud, misinformation or manipulative information.
One way to determine if what you are learning is accurate or not is to understand the CYCLEs of the Bull Market and Bear market which are entirely different.
A Great Bull Market is all about new technologies that will and are displacing old technology and are disruptive forces for the older companies whose once new technology is aging and out of date.
Bull Markets have 6 primary market conditions. Each market condition is unique in how you trade that with your trading style, how you find stocks to trade, risk inherent in that market condition and profit opportunities.
We are in the early years of a Great Bull Market. Bull Markets do not just go upward. Retracements, Short Term Corrections, and Intermediate Trend corrections and Flash Crashes, occur periodically when the price of a stock is too far above the fundamental level for that stock. This impacts the indexes.
If a correction causes a sudden collapse of the stock price to be below the fundamental level which is a horizontal price level, then Dark Pools will start bargain hunting and buy the stock to move it back into their Buy Zone.

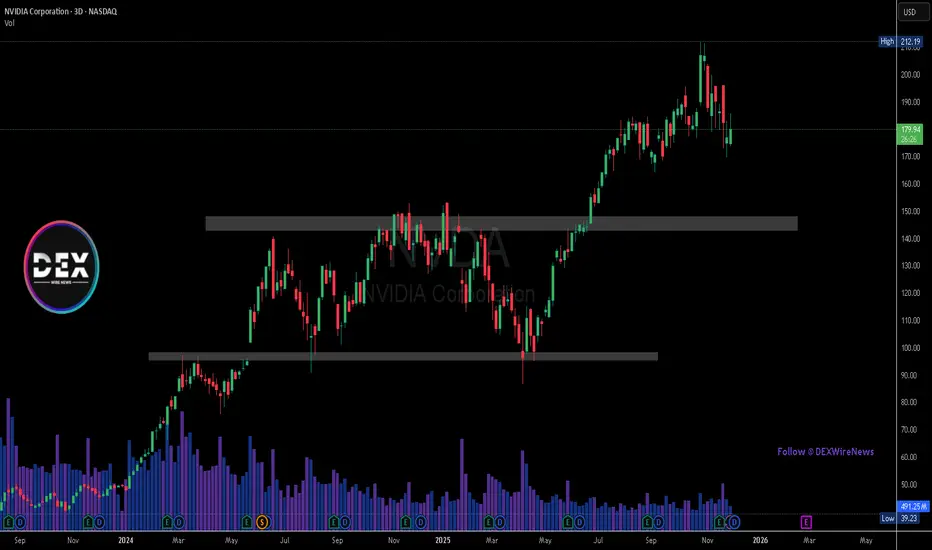
Let's buy nvidiaMine is a purely technical analysis that is supported by multiple factors: we can first notice in the daily timeframe that Nvidia is squeezing through this descending triangle creating a slight downtrend, retracing by about 15% from the historical high and arriving in an area of particular importance that in recent months has acted as a very important support, as we can see from the arrow. The price also tried to break the resistance looking for a further decline but failing to do so, it ended up closing the day's candle with enormous lower weakness as can be seen in the yellow area, finally arriving at the point of interest where we can notice the structural change in h4 and the break, now for 5 days, of the descending triangle.

Nvidia - Now is the time to go short!💣Nvidia ( NASDAQ:NVDA ) is now creating a top:
🔎Analysis summary:
Just a couple of days ago, Nvidia perfectly retested a major resistance trendline. Always in the past, such a retest was followed by a major move towards the downside. Therefore, Nvidia is preparing for a major drop, which could lead to another -25% drop in the future.
📝Levels to watch:
$180 and $140 and $100
SwingTraderPhil
SwingTrading.Simplified. | Investing.Simplified. | #LONGTERMVISION

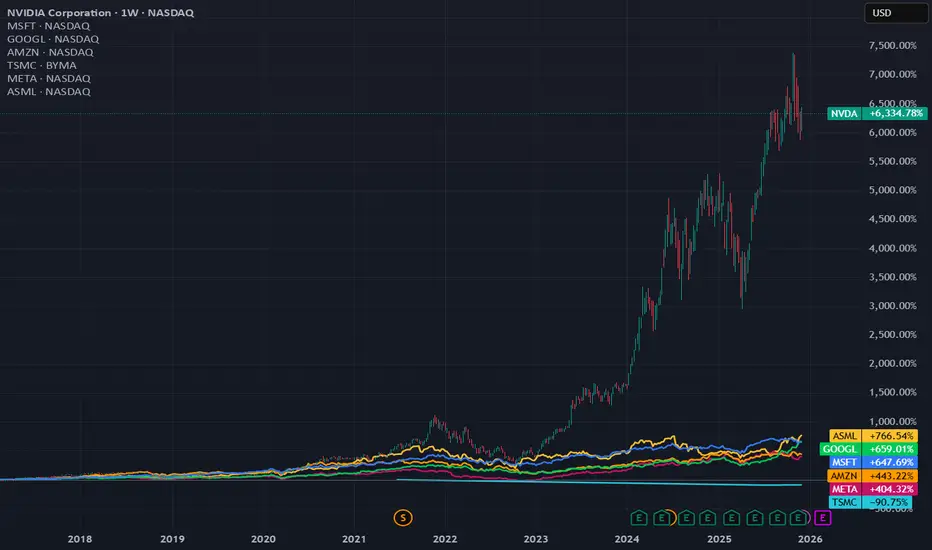
Comparative Performance of Key Stocks in Technology and AIThis chart presents a long-term analysis of the cumulative return of the most influential stocks in the technology ecosystem, focusing on companies central to Artificial Intelligence (AI) infrastructure and application.
NVDA at a Decision Level – Dec 1–5 OutlookWeekly – Trend Still Up, But Losing Strength
NVDA has been riding a strong multi-month uptrend, but the last few weekly candles show the first real slowdown. A clear CHoCH formed near the recent highs, and sellers stepped in aggressively. The weekly candle closed with a long upper wick and a heavier body — signaling momentum cooling.
Important weekly zones:
* $198–200: previous weekly supply
* $176–178: weekly support where buyers stepped in
* $153–160: deeper weekly demand
* $120s: major demand if the market rolls over hard
Weekly tone → still bullish on the big structure, but fading momentum with the first signs of deeper pullback potential.
Daily – Inside a Pullback After Supply Rejection
Daily shows a sharp rejection from the supply zone near $210–215. Price broke structure downward (CHoCH), then bounced from a lower demand zone but hasn’t reclaimed the supply above.
Daily key levels:
* Resistance: $198 → $212
* Support: $177 → $172
Until price fully reclaims and holds above $198–200, NVDA stays at risk for lower continuation.
Daily tone → trapped underneath supply, struggling to regain upside momentum.
1-Hour – Sideways Grind After Breakdown
The 1H shows clean weakness:
* BOS downward
* Multiple failed retests of $182–183
* Price repeatedly rejecting the underside of the broken trendline
* Buyers only defending short-term at $176–178
The more NVDA keeps getting rejected at the same 1H resistance, the more pressure builds for a deeper dip.
Short-term 1H levels:
* Breakout: above $183 → retest $188–190
* Breakdown: below $176 → flush toward $172–170
1H tone → consolidation after rejection, leaning bearish unless buyers reclaim $183.
15-Minute – Compression Before the Next Move
The 15m chart is compressing inside a tight range after the clean BOS move earlier. This type of structure usually leads to an impulsive move.
The repeated rejection at $182–183 shows sellers defending aggressively. Buyers are only holding the short-term demand around $176–178.
15m tone → leaning bearish unless it breaks above $183 with real strength.
GEX – Options Positioning Shows the Real Pressure Points
On the NVDA GEX chart:
* Highest positive GEX: $185–187 → magnet + resistance
* 3rd CALL wall: near $190 → extension if momentum flips
* PUT walls:
* $172–175: heavy PUT support
* $160: large negative gamma zone
* $145–150: deep support if the market panics
What GEX is saying:
* Below $183, market makers lean bearish and push toward $176–172.
* A clean break above $185 can snap the chart upward into $188–190 fast due to positive gamma.
* A breakdown below $176 opens a straight path to $170–172 with momentum.
GEX aligns perfectly with the TA:
* All timeframes showing pressure from above
* GEX walls lining up with the exact levels on the 1H and 15m
* A bigger move waiting as soon as NVDA loses or reclaims the key areas
Trading Thoughts – Dec 1–5
Bullish Setup
NVDA needs a clean break + hold above $183–185.
Targets:
* Target 1: $188
* Target 2: $190 (CALL wall)
Stop zone → below $176
Call idea (only if breakout happens):
NVDA 185C / 190C, short-dated — ONLY after confirmation.
Bearish Setup
If NVDA loses $176, downside opens quickly.
Targets:
* Target 1: $172
* Target 2: $170
* Target 3: $160 (deep support on GEX)
Put idea (safer):
NVDA 172P or 170P — only valid if breakdown happens.
Overall Outlook for Dec 1–5
NVDA is sitting right at a squeeze point.
Key alignments:
* Weekly: losing momentum
* Daily: stuck under major supply
* 1H: rejecting underside of broken trendline
* 15m: compression before a direction
* GEX: clear resistance above $185 and clear support at $176 → perfect pressure map
The next move will be clean once direction confirms.
This is the type of setup where option traders shouldn’t guess — just wait for the breakout or breakdown and ride the move.
Disclaimer
This analysis is for educational purposes only, not financial advice. Always trade with proper risk management and confirmation.
Sub $100 Incoming?Textbook UTAD • LPSY Formation • Bearish Divergence on 3D QQQ Trend
📌 Overview
NVDA is showing a complete Wyckoff Distribution across all major timeframes. The Monthlys last major push has been extremely weak volume, The Weekly chart printed a clean UTAD, the Daily/3D shows a fractal UTAD, and the 3-Day QQQ trend reveals a bearish divergence by closing above its last swing, while NVDA closed below — confirming supply dominance.
This combination strongly suggests NVDA is transitioning from Phase C → Phase D, with markdown likely into the AR and below.
🟦 1. WEEKLY — Completed UTAD, Now Phase D
The Weekly structure is extremely clean and follows classic Wyckoff logic:
Phase A
PSY
Buying Climax (BC)
Automatic Reaction (AR)
Secondary Test (ST)
Phase B
Wide, choppy rotation while the Composite Operator distributes.
Phase C — UTAD
NVDA broke above Phase B highs, failed immediately, and reversed with increasing sell pressure.
This is the exact spot where smart money typically finalizes distribution.
Phase D — Current
The last two rallies have formed LPSYs, each weaker than the last:
Lower highs
Shortened thrust
Volume fading on upswings
Downside volume expanding
Interpretation:
Weekly is firmly in Phase D, preparing to test the AR (≈ $120). Followed by SOW-B ≈ $93
Failure of this zone opens Phase E (markdown).
🟪 2. 3-DAY NVDA — Fractal UTAD of the Weekly Distribution
On the 3-Day chart, NVDA produced a smaller UT and UTAD inside the larger weekly UTAD.
This is a fractal distribution, confirming:
A smaller distribution nested inside a larger one
CO selling on both timeframes
Supply overwhelming diminishing demand
This also aligns perfectly with the behavior of Phase C → D.
This is one of the strongest bearish Wyckoff signals you can get.
🟦 3. 3-Day QQQ Trend — Clear Bearish Divergence
Above the NVDA 3D chart is the QQQ 3-Day
• When NVDA closes below its last swing, while the market held above, that shows weakness.
This is momentum divergence:
Demand decelerating
When the leaders start to lag, thats something to cause concern.
Its a classic condition during UTADs in distribution tops
When a UTAD forms with divergence, Wyckoff views it as Demand is drying up.
🟧 4. MONTHLY — Macro Distribution Entering Phase D
The Monthly chart confirms the big picture:
Massive vertical run → PSY + BC
First shift in behavior → AR
Controlled retest → ST
Drift sideways → Phase B
Final push → Monthly UTAD
Rejection with increased supply → Phase C complete
Now price is failing the retest and rolling over into Phase D.
The Monthly and Weekly now align, which greatly increases the probability of sustained markdown.
🟥 5. Wyckoff Markdown Projection Path
Based on the current structure:
1️⃣ Current Zone
Weak LPSY → low-volume rally failures. I expect some chop, followed by one last UT of the chop highs, with a rejection between $185-$195. IF we reclaim and hold $195 = Invalidation, otherwise:
2️⃣ SOW (Sign of Weakness)
A decisive breakdown below the most recent structure lows.
3️⃣ First Major Target: AR Zone
$120
Every completed distribution returns to test the AR.
4️⃣ Sow Break (Phase E Begins)
Targets:
$102 (Phase A low)
$90-102 (Redistribution zone)
$76 (Final stopping area; Monthly value reset)
5️⃣ Bear Market Behavior
If the SoW breaks, NVDA enters a true Phase E markdown —
smooth, directional, and supply-driven.
🟩 6. Invalidation
To negate this bearish Wyckoff view:
➡️ NVDA must reclaim and HOLD above the UTAD high.
Given the 3D divergence and repeated LPSYs, this has low structural probability.
🟦 7. Final Thoughts
NVDA is aligning across all major timeframes in one of the clearest Wyckoff distribution sequences of the year:
Monthly UTAD
Weekly UTAD → LPSYs → SOW
Daily/3D fractal UTAD
3-Day QQQ divergence
Volume shift confirming supply
Everything here points toward Phase D → Phase E, with markdown into the AR and below. I think its important to not repeatedly try and call tops so if this idea is invalidated I will remain neutral, until I see redistribution below phase b, but I also think that the weakness in volume, and the MTF alignment is too much to ignore
If this continues to play out that would make all of 2025 a distribution. If that is the case, the markdown phase could play out throughout all of 2026 and into 2027. I know people say this every year/month/day but this is the first time, I personally, have seen this kind of alignment and supporting evidence across timeframes. Time will tell.
Good luck in 2026 everybody

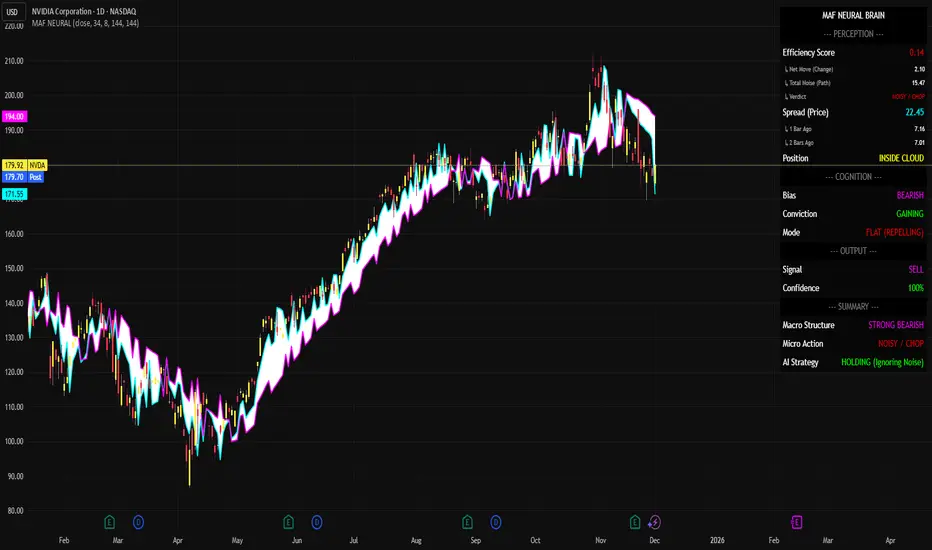
Trade Summary: Bearish Continuation with High ConfidenceYou are looking at the Daily chart for NVDA (NVIDIA Corporation). The broader trend is clearly bearish, and the MAF Neural Brain indicator has identified a high-probability continuation setup.
1. Perception (The Eyes): What the Indicator Sees
Efficiency Score: 0.14. This is very low, indicating "Noisy/Chop" price action. The daily candles are overlapping significantly, showing a struggle between buyers and sellers rather than a smooth trend.
Spread (Price): 22.45. Volatility is present but contained within the bearish structure.
Position: INSIDE CLOUD. Price is trading within the indicator's bands, confirming that this is a consolidation phase within the larger downtrend.
Trade Summary: Bearish Continuation with High Confidence
2. Cognition (The Mind): How the Indicator Interprets It
Bias: BEARISH. Despite the choppy daily action, the system maintains a negative bias.
Conviction: GAINING. This is the key insight. While the market looks messy to the naked eye, the algorithm's internal confidence in the downtrend is actually increasing. It sees the current chop as a pause before another drop, not a reversal.
Mode: FLAT (REPELLING). The market is stuck in a range that is resisting upward breakouts.
3. Narrative (The Story): The Strategic Output
Signal: SELL. A hard sell signal is active.
Confidence: 100%. The system is fully aligned. Every metric (Bias, Conviction, Structure) points to lower prices.
4. Summary (The Execution)
Macro Structure: STRONG BEARISH. The dominant force is selling.
Micro Action: NOISY / CHOP. The daily candles are messy.
AI Strategy: HOLDING (Ignoring Noise).
Trade Analysis: This setup represents a "Bear Flag" or Consolidation in a Downtrend.
The Opportunity: Traders often get shaken out during "Noisy" consolidations like this because they mistake the sideways movement for a bottom. The Neural Brain is explicitly telling you to ignore that noise.
The Action: If you are short, HOLD. If you are flat, this is a valid entry for a Short position, anticipating a breakdown from the current "Inside Cloud" consolidation.
The Verdict: The 100% confidence level combined with "Gaining Conviction" suggests the path of least resistance remains strictly downward.
In plain English: "NVDA is taking a breather after dropping, and the price action is messy. However, the internal data says sellers are still in total control and getting stronger. Don't buy the dip; expect the drop to continue."
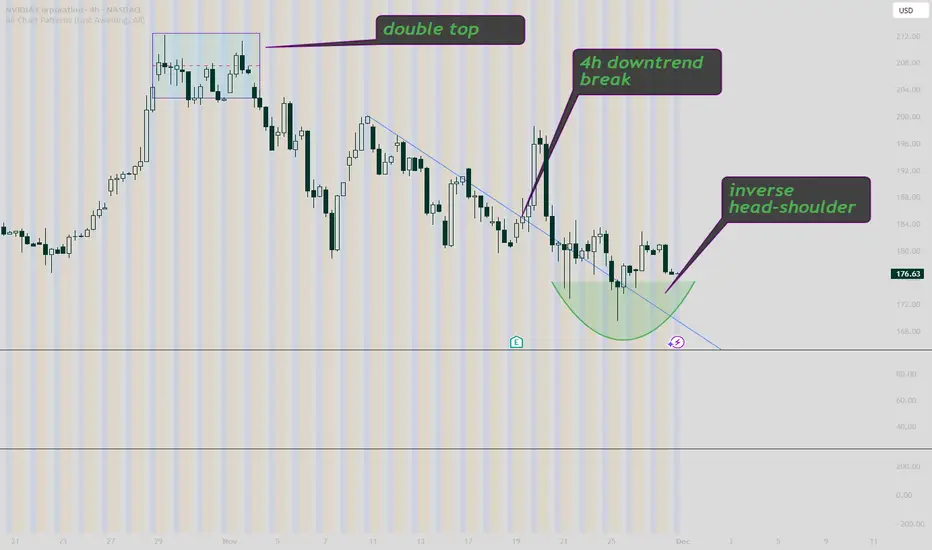
NVDA 4H TECHNICAL ANALYSIS NVDA has broken a downtrend triggered by a double top, and has now formed a inverse head and shoulders
$NVDA — WEEK 49 TREND REPORT (COILING?)NASDAQ:NVDA — WEEK 49 TREND REPORT
Ticker: NASDAQ:NVDA — 12/02/2025 @ 185$
Timeframe: WEEKLY
This is a reactive structural classification of NVDA based on the weekly chart as of this timestamp. Price conditions are evaluated as they stand — nothing here is predictive or forward-assumptive.
⸻
1) Current Trend Condition
• Trend Duration: +5 weeks (bearish)
• Trend Reversal Level (Bullish): 190.87$
• Trend Reversal Level (Bearish): 176.52$
• Pullback/Correction/Structure Support: 167.75$
⸻
2) Structure Health
• Retracement Phase:
• Pullback (approaching 78.6%)
• Position Status:
• Caution (interacting with structural layers)
⸻
3) Temperature: Cooling Phase
⸻
4) Momentum: Coiling
⸻
5) Market Sentiment: Neutral
⸻
Author’s Note
This analysis is fully reactive, not predictive. Market conditions, trend structure, and behavior are classified as they appear in real time. The objective is to identify where directional shifts first occurred, where structural integrity remains intact, and where it would begin to weaken if key levels were breached.
Predictive analysis projects outcomes that do not exist yet. Without price confirmation, prediction is built on baseless assumptions. This framework avoids that entirely by responding only to verified structural changes and live conditions.
The levels shown simply identify where the current trend structure first shifted and where it would begin to lose integrity if breached. Recognizing these boundaries allows for clearer interpretation of market behavior without relying on forward guarantees, speculative projections, or unsupported assumptions.
⸻
Methodology Overview
This classification framework evaluates directional conditions using internal trend-interpretation logic that references price behavior relative to its structural layers. These relationships are used to identify when price movement aligns with the framework’s criteria for directional phases, transition points, or regime shifts. Visual elements or structural labels reflect these internal interpretations, rather than explicit trading signals or preset indicator crossovers. This framework is observational only and does not imply future outcomes.

NVIDIA Trading plan from $100 to $1000. Is it plausible?Exactly a month ago, we called the end of the rally on NVIDIA Corporation (NVDA), essentially the end of its multi-year Bull Cycle and the beginning of an aggressive Bear Cycle correction.
** The 10 year Channel Up **
So far this is paying dividends as the stock just completed a 4-week red streak. The essence of NVIDIA's trend has been a decade long Channel Up, as you can see on this chart and that's the basis of all the buy entries and sell exits we've made over the years.
** Bull and Bear Cycles **
Since early 2025, the stock started that Channel Up, whose first Bull Cycle (as well as the next ones with the exception of one breaking) was supported by the 1W MA50 (blue trend-line). Once that Bear Cycle (in the form of the Channel's Bullish Leg) ended, the subsequent Bear Cycle (Bearish Leg) broke below both the 1W MA50 and 1W MA100 (green trend-line) and bottomed exactly on its 1W MA200 (orange trend-line), marginally above the 0.382 Fibonacci retracement level.
The following Bull Cycle as well as the Bear Cycle followed the same structure only, the bottom was this time marginally below the 0.382 Fib. Then the Bull Cycle that just ended started, with only basic difference that its early 2025 correction broke below the 1W MA50 but found Support on the 1W MA100. Every Bull Cycle had such pre-Top correction (blue ellipse). Note also that this last Bull Cycle as been the strongest Leg on +1881% rise and the one before it, the 'weakest' at +1004%.
** The RSI **
Notice also that the 1W RSI has made the same Double Top rejection pattern on the Lower Highs Zone that both previous Bull Cycle Tops did. Strong confirmation therefore of the emerging Bear Cycle.
** The next bottom **
Technically, we expect the market to bottom yet again on the 1W MA200, which by a fair projection of its current trajectory, we expect that to be around $100. That would still be considerably above the 0.382 Fib, which can only get hit if the Bear Cycle falls very aggressively. Note here that historically within this Channel Up, the most optimal buy signal was given when the 1W RSI hit 42.00. Use that in combination with the 1W MA200.
** Future Targets **
So after the Bear Cycle bottoms, what Target can we pursue? Well the 'minimum' projection based on the 2.618 Fibonacci extension of the Bull Cycle that just ended is $700. At the same time, if it rises by again the 'minimum' % of the weakest +1004% Bullish Leg of the Channel, we are looking potentially at a 4-year Target of $1100. It is also worth noting the valuable use of the Sine Waves that have so far accurately grasped the peak formations of the Bull Cycles. We can use this to time our market exits in 2029.
Realistic or not subjectively, the $100 to $1000 path is what the pure technicals and historical data support and clearly show is a very likely probability for a long-term investment.
---
** Please LIKE 👍, FOLLOW ✅, SHARE 🙌 and COMMENT ✍ if you enjoy this idea! Also share your ideas and charts in the comments section below! This is best way to keep it relevant, support us, keep the content here free and allow the idea to reach as many people as possible. **
---
💸💸💸💸💸💸
👇 👇 👇 👇 👇 👇

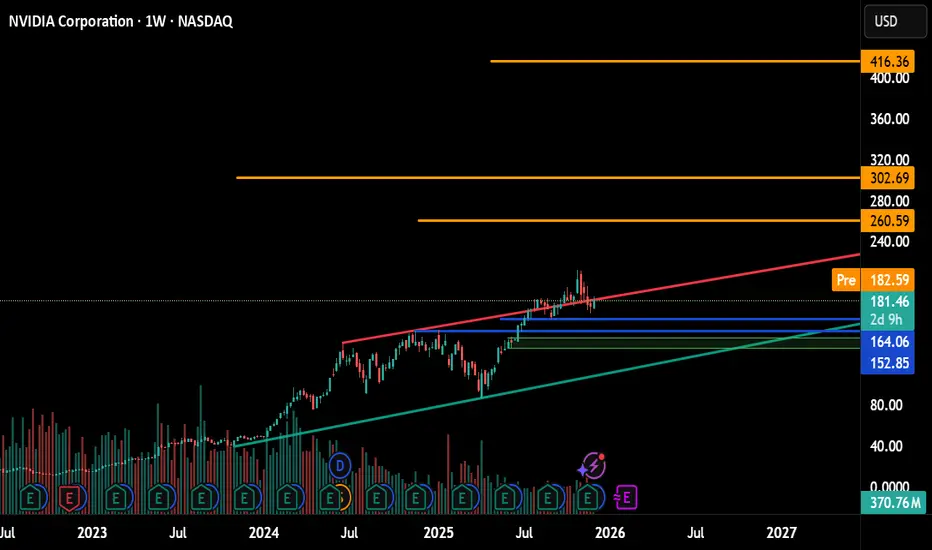
NVDA : Blue-chip and Strong potential for alpha returnsCMP : 181.46
Investment pick.. Long term.
Adding : if decline : 164-152 levels...
and 130 Stop Loss of course because we can not hold if it will give us negative long term price structure..
Manage your Risk..
Target : 260, 302, 416 + then review.
Logic : Rising channel and correction .. we are eyeing in it.
Not sure how this is UBER bullish...That support line is now VERY important for Nvidia.
possible 20% drop

Nvidia ($NVDA) Stock: $2B Synopsys Deal Expands AI Design PowerNvidia has taken another major step to secure its dominance in AI infrastructure by investing $2 billion in Synopsys, one of the world’s leading chip design software companies. The investment instantly makes Nvidia one of the top shareholders and deepens the long-term collaboration between the two firms. The deal strengthens Nvidia’s control over key parts of the AI value chain, from hardware to software tools used in designing new chips across multiple industries.
This partnership gives Synopsys access to Nvidia’s advanced developer tools and GPU-accelerated libraries to boost its electronic design automation (EDA) processes. These improvements aim to speed up chip development cycles at a time when demand for advanced AI hardware continues to surge. For Nvidia, the move ensures it stays positioned at the center of AI innovation and benefits financially from the growth of the entire ecosystem—not just from selling GPUs.
The timing also matters. Synopsys recently reported weakness in its intellectual property segment due to export restrictions tied to China and slower activity from a major foundry customer. Nvidia’s investment restores confidence in Synopsys' long-term outlook while offering Nvidia a strategic foothold in the tools that design the chips running global AI infrastructure.
Technical Analysis
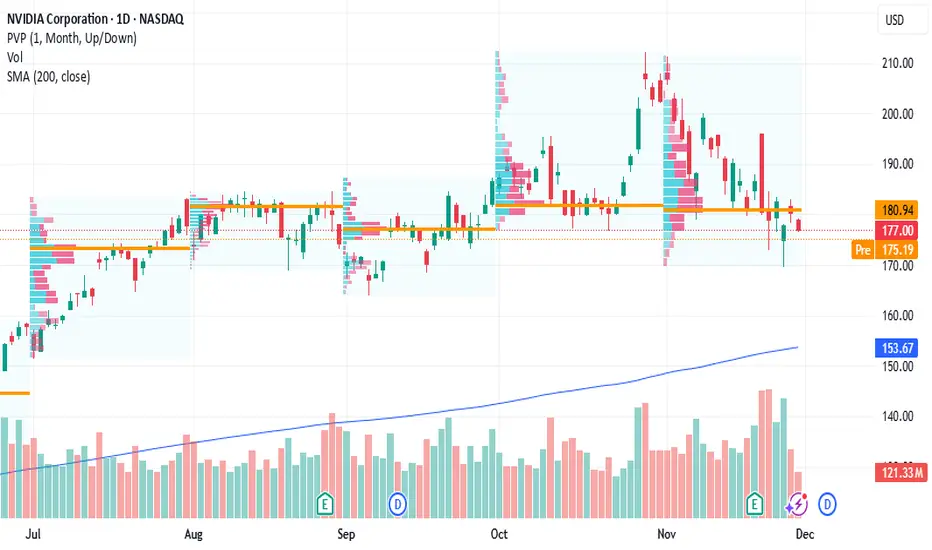
Nvidia’s overall trend remains bullish despite a slight pullback. Price currently trades around $178, holding above a key support zone at $145, which becomes the level to watch if broader tech stocks weaken. Upside momentum resumes if price pushes toward the $212 resistance area—its previous major high. A confirmed breakout above $212 would signal continuation of the broader bullish structure.
With a strong fundamental catalyst and firm long-term trend, Nvidia remains one of the leading names powering AI’s next wave.
Nvidia (NASDAQ: $NVDA) $2B Synopsys Bet Reshapes AI’s FutureNvidia’s recent $2 billion investment in Synopsys signals one of the company’s most strategic and transformative moves in the AI and semiconductor race. The purchase—completed at $414.79 per share for a 2.6% stake—pushes Nvidia deeper into the core infrastructure that powers advanced computing, chip design, and the next generation of AI hardware.
While mainstream attention often focuses on AI chatbots, consumer apps, and model breakthroughs, Nvidia’s Synopsys stake shows a different priority: controlling the foundational technologies that make AI possible. Synopsys is one of the world’s most critical companies in electronic design automation (EDA), providing the tools used to design semiconductors, aerospace systems, and highly complex digital architectures. By aligning with Synopsys, Nvidia effectively plugs into the heart of global chip innovation.
Experts suggest this isn’t merely a passive financial investment—it’s a strategic partnership aimed at accelerating breakthroughs in AI-optimized chips, automation tools, and silicon-level performance. With Nvidia already dominating GPU computing, securing influence within Synopsys strengthens its command over the entire AI hardware pipeline, from design to deployment.
This move also positions Nvidia ahead of rivals as the semiconductor landscape becomes increasingly defined by custom silicon, automated chip design, and hardware-accelerated AI systems. A deeper integration between both companies could unlock new workflows where AI models help design better chips—and those chips, in turn, train better AI models.
While media narratives often revolve around front-end AI products, Nvidia’s quiet focus on infrastructure reveals its long-term strategy: build, own, and optimize the invisible technological backbone of the AI revolution. With Synopsys now in its orbit, Nvidia is not just participating in the future of AI—it’s helping engineer it.
Technical analysis
Nvidia (NASDAQ: NVDA) is bouncing from a key demand zone after pulling back from the $212 resistance area. Price is reclaiming short-term momentum as it holds above the major support region around $145, which previously acted as a strong accumulation zone. As long as NVDA maintains support above this level, the structure favors a continuation toward the $200+ range, with $212 remaining the next major hurdle. A breakdown below $145 would open room for a deeper correction, but current price action signals buyers are defending the trend.
Nvidia breakdown signals further downside this weekCurrent Price: $183.11
Direction: SHORT
Confidence Level: 68% (The majority of professional traders highlight ongoing weakness, technical downtrend channels, and critical support at $174.15 as being at risk. Sentiment leans bearish despite some long-term bullish bets.)
Targets:
- T1 = $175.00
- T2 = $164.00
Stop Levels:
- S1 = $187.00
- S2 = $190.00
**Wisdom of Professional Traders:**
I'm seeing consistent caution among the professional traders tracking Nvidia this week. Several traders point out that the price action remains stuck in a downtrend, with multiple mentions of resistance around $185–$187 and support sitting near $174.15. The consensus from the trading community is that Nvidia's inability to regain the 50-day moving average is keeping the momentum tilted toward the downside, especially with competitive threats from Google's TPU chips pressuring sentiment.
**Key Insights:**
The key point here is the near-term weakness that follows Nvidia's last earnings release. Despite strong results, traders observed a “gap and crap” setup, where the initial post-earnings rally quickly reversed. Many traders are watching the $174.15 level closely; a decisive break here could trigger a sharper sell-off toward the May lows around $164. In this short-term context, long-term call leaps into 2028 don't outweigh the immediate technical vulnerability. The repeated failure to hold above $185 shows sellers are defending that zone aggressively.
Another factor to consider is sector rotation. Several traders noted that other semiconductor names like AMD, Broadcom, and Qualcomm are showing relative strength while Nvidia lags. This divergence suggests capital is moving away from Nvidia into peers, which could exacerbate near-term pressure.
**Recent Performance:**
This all played out in recent sessions as Nvidia declined over 12% last month, breaking key technical levels and underperforming both the Philly Semiconductor Index and Nasdaq. Last week’s price closed down 1.8% even as many tech names bounced, underscoring persistent weakness.
**Expert Analysis:**
Multiple professional traders' analysis points to clear downside setups. Several mentioned Nvidia being “bearish unless it breaks 185” with lower-high patterns forming. Support zones at $174.15 and $164 are in play if the trend continues. Many traders highlighted heavy institutional selling, potentially linked to AI bubble concerns. Even those with long-term bullish views admit the near-term chart is unattractive, and that the downtrend channel remains intact.
**News Impact:**
What's interesting is the competitive pressure narrative gaining traction — especially reports about Meta considering Google TPUs in future data centers. This kind of news has already triggered multiple single-day drops exceeding 6%, adding fuel to the bearish case. While the Fed’s policy pivot could help broader markets, traders are pointing out that Nvidia’s specific headwinds—valuation, technical breakdowns, and competitive threats—are more pressing in the short-term.
**Trading Recommendation:**
Putting it all together, I’d look for short setups below $183, targeting $175 first and then $164 if bearish momentum accelerates. Stops should be placed above $187 to limit losses, with a wider emergency stop at $190 in case of a sharp reversal. Position sizing should reflect moderate confidence, with risk kept tight until Nvidia reclaims and holds above the 50-day moving average. This looks like a tactical short for the week, taking advantage of persistent weakness and well-defined technical levels.
Long trade
🟩 Buy-Side trade
Pair: NVDA
Date: Mon 1st Dec 2025
Time: 12:30 pm
Session: NY Session PM
Entry: 180.25
TP: 195.71 (8.57%)
SL: 178.54 (0.949%)
RR: 9.04
🟦 STRUCTURE
NVDA formed a bullish MSS → BOS on the 1H
Price retraced into discount (0.618 fib region)
Strong displacement candle confirmed the long bias
FVG inside retracement zone provided algorithmic entry logic
Target aligns with HTF premium zone around 195–200
🟨 LIQUIDITY
Sweep of sell-side liquidity beneath 178.50–179.00
Inducement engineered before bullish expansion
Upside liquidity magnets:
187.80 (0.382 retracement)
195.70 HTF equilibrium level
Gap above → likely draw-on-liquidity
Large volume cluster supports bullish continuation
🟧 SENTIMENT
NVDA remains fundamentally bid due to AI/semiconductor strength
Broader tech sector showing rotation back into high-beta names
NY PM session typically generates continuation moves
Market repricing risk-on after morning volatility clearance

NVDA Market Preview – December 5NVDA heads into tomorrow’s session sitting at a major decision zone. Price has been tightening inside a rising channel, and the structure suggests a directional break is getting close. Supply and demand zones are well-defined, and current positioning gives a clear sense of where the next move may develop.
Higher-Timeframe Structure (1H)
NVDA is still holding a mid-term bullish structure that began at the 176–178 demand zone. Buyers have consistently defended this region, confirming its significance.
However, the 183.50–185 area continues to act as the main supply zone, rejecting price multiple times.
Key Zones
* Supply: 183.50–185.00
* Demand: 178–180
Price is now pressing toward the apex of a rising channel. This type of compression often leads to a decisive breakout or breakdown once the market chooses a direction.
Intraday Structure (15M)
A recent CHoCH did not lead to strong continuation, and NVDA is currently retesting its internal trendline with diminishing momentum.
Bearish signs
* Consistent rejection inside the supply zone
* Multiple upper wicks showing absorption
* Declining volume into resistance
* GEX resistance overhead
Bullish signs
* Rising trendline still holding
* No confirmed bearish BOS
* Liquidity resting above 185 that could attract a sweep
The structure remains balanced, but vulnerable. The next clean break will likely dictate direction for the session.
GEX Outlook for December 5
* Call wall: 187.5–190
* Put support: 179 / 177
* Neutral magnet: 182–183
A breakout above 183.50 creates room for 185 → 187.50.
A rejection here increases the probability of a rotation back toward 180 and possibly 178, aligning with demand and put support.
Dealer positioning is fairly neutral, suggesting the session may be two-sided unless a clear breakout occurs.
What to Watch for Tomorrow
Bullish Scenario
Requires a strong break and hold above 185, followed by a clean retest.
Targets: 187.50, then 190 (likely rejection area).
Bearish Scenario (favored unless macro shifts)
Needs another failed test at 183.5–185 and a loss of the 15M trendline.
Targets: 181.5 → 180 → 178.5–179.
Bias Going Into the Session
The lean is bearish-to-neutral unless NVDA reclaims and holds above 185.
Key reasons:
* Momentum softening at resistance
* Lower highs forming intraday
* SMC sell zones consistently respected
* GEX resistance overhead
* CHoCH has not converted into bullish structure
Expect chop early, followed by clearer direction once the trendline breaks.
Trading Thoughts
For possible longs:
* Wait for confirmation above 185
* Look for retest entry, not breakout chasing
* First upside target: 187.50
For possible shorts:
* Preferred zone: 184–185
* Downside targets: 181.5 → 180 → 178.8
For scalpers:
* 183.10 is the first micro pivot
* Trendline break on 15M will define direction
* Avoid trading the center of the range — poor R/R
Disclaimer
This outlook reflects personal market analysis and is for educational purposes only. It is not financial advice. Always trade your own plan and manage risk accordingly.

NVIDIA (NVDA) – My PUT Options Position ExplainedI opened a medium-term bearish position on NVDA by purchasing PUT options.
Here’s the full breakdown of the idea, entry logic, and projected targets.
🧠 Why I Entered the Trade
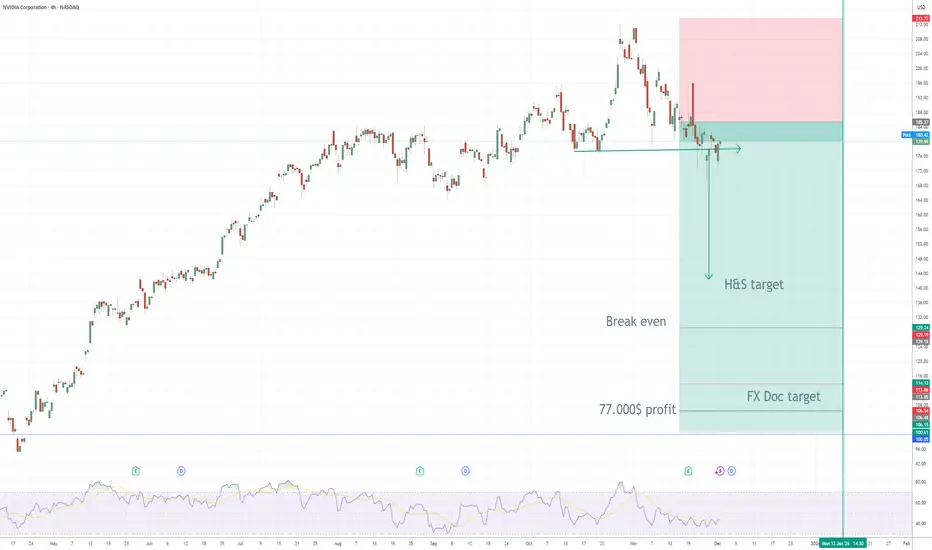
NVDA formed a clear Head & Shoulders (H&S) reversal pattern on the 4H chart — one of the strongest technical reversal signals after an extended bullish trend.
The neckline has now been broken, validating the structure and confirming bearish momentum.
The rejection from the right shoulder, combined with weakening RSI and loss of key market structure, provides additional confirmation.
🎯 My PUT Options Position
I purchased PUT contracts with a defined risk and leveraged downside exposure.
Break-Even Price: ~129 USD
This is the key level where:
the option premium is fully recovered
the position shifts from “loss” to “profit”
As long as NVDA trades below 129 USD before expiration, the position begins generating profit.
💰 Profit Projection
My profit target zone is around 102 USD.
At that level, the trade yields approximately:
➡️ +77,000 USD profit
This aligns with:
the measured target of the Head & Shoulders pattern
previous demand zone turning into resistance
Fibonacci extensions
a full correction of the last impulsive leg
📌 Technical Breakdown
H&S target: ~160 → ~130 → projected extension toward 102
Break-even: 129 USD
FXDoctor target: 102 USD
Trend structure: Major lower lows forming
Momentum: RSI breakdown and bearish continuation signals
The chart clearly shows a potential shift from a hyper-parabolic bullish phase into a deeper correction — a move that benefits PUT buyers with asymmetric risk/reward.
🧨 Summary
I’m holding PUT options on NVDA
Break-even: 129 USD
Projected profit: ~77,000 USD at 102 USD
The trade is based on a clean and validated Head & Shoulders reversal
NVDA is showing early signs of a much larger bearish correction
$NVDA - $140 Target - Short Position - AI Bubble About to BurstIn my opinion, Nvidia does not have much to continue the next needed support for a pro-longed bull run, at least in terms of sentiment. The AI bubble has gone on for too long and the actual multiples of valuations in comparison to revenue and profit generations do not seem to have strong support when considering traditional investing strategies. Also, the next wave seems getting closer and closer to a red trend. Retracement potential is possible after hitting $140, but Nvidia needs to do far more benefit for the public good and have a differentiation that doesn't rely on trends such as crypto mining and the boost of LLMs. As always, none of this is investment or financial advice. Please do your own due diligence and research.