NVDA HAGIA SOPHIA!The Hagia Sophia pattern has now fully formed; it just needs the crack! and the Hook!
No matter what your vague hunches and feelings are about AI, the charts will always win.
You can't "buy the dip" unless you know when to "Sell the Rip"!
If you can't see this resistance area, I don't know what to tell you.
Everyone is bullish at the top of a bubbliotious market without exception!
Click boost, Like, Subscribe! Let's get to 5,000 followers. ))
Trade ideas
Nvidia nov-dec 2025 end yearPrice in the middle of weekly range ($178.91–$200.05) at phase 1 to 2
EMA alignment confirms bearish weekly trend
i believe NVIDIA might dip to $160 - $170 (near the gap it has created/ 1 x A Fib extension levels), with downward pressure due to overvaluations

Nvidia: Downside Pressure Nvidia has recently faced notable downward pressure, but so far has managed to hold above the support level at $176.21. As a result, we continue to anticipate an imminent rally as part of the beige wave V, which should lift the stock into the now-red Target Zone between $227.38 and $260.60. However, if the stock immediately drops below the $176.21 mark, we would expect a new low for the beige wave alt.IV, with the lower $145.50 level still likely to hold.

$NVDA | Fib Expansion Points to $212.81 → Is the AI Supercycle JWaverVanir International LLC | Weekly Fibonacci Roadmap
📅 June 25, 2025 | +7.27% Day | Post-Stock Split Momentum
NVIDIA ( NASDAQ:NVDA ) continues to dominate the AI-driven tech rally. After reclaiming the 1.618 Fibonacci level ($128.35), price has broken above the 0.886 retracement ($146.72) and is now pressing higher with bullish volume.
🧠 Fibonacci Insights:
🔺 1.786 Fib Extension: $207.76
🎯 Primary Target: $212.81 (Golden Projection)
🚀 Long-term Fib targets extend into $250–290+ zone (2.618–3.0 extensions)
🔻 Red trendline below signals well-respected diagonal support since early 2023
📊 Price Outlook:
Current Price: $154.31
Short-term Path: Bullish breakout → $168.21 → $178.43
Next Major Resistance: $212.81
Support to Hold: $139.93 / $128.35 (previous Fib clusters)
🧩 Catalysts Ahead:
Q2 Earnings (Late August 2025) – Focus on AI/data center revenue acceleration.
NVIDIA Blackwell GPU shipments – Institutional uptake will confirm pipeline robustness.
AI Sovereign Demand – U.S., UAE, Singapore and Saudi Arabia investing in GPU infrastructure.
AI Arms Race – Competitive moat widening vs. AMD, Intel.
AI App Ecosystem Expansion – Surge in demand for inferencing chips (L4, L40, GB200).
Post-Stock Split Rotation – Retail inflow and fresh institutional allocations.
📌 Summary:
NVIDIA is not just a chipmaker — it’s the core of the modern AI stack. With clear Fibonacci structure and geopolitical tailwinds, the next target is $212.81. Watch dips into $140s for potential reload zones.
🔖 Hashtags:
#NVDA #NVIDIA #AIstocks #WaverVanir #FibExtension #FibonacciTrading #AIboom #BlackwellGPU #GPUpower #PostSplit #TechLeadership #TradingView #SMC #AIarmsrace

NVDA | Long | R/S Flip at 172 + 0.5 Fib | Nov 20, 2025NVDA | Long | R/S Flip at 172 + 0.5 Fib + VWAP Support in Rising Channel | Nov 20, 2025
🔹 Thesis Summary
NVIDIA remains the S&P 500’s largest single weight and the AI-infrastructure bellwether. After a fast shakeout to channel support, the chart sets up a defined-risk long as risk sentiment sits at Extreme Fear—a backdrop that historically favors mean reversion and leadership rebounds.
🔹 Trade Setup
Bias: Long
Entry Zone: 172–182 (R/S flip and ~0.5 retrace inside the ascending channel)
Stop Loss: 152–156 (below VWAP/structure and prior base)
Take-Profits:
TP1: 188–192 (channel mid / prior supply)
TP2: 205–208 (upper-mid channel)
TP3: 214–220 (channel top / measured move)
Max Target: 230–246 (channel extension if trend resumes)
R:R (from ~175): ~1.5–3.0 depending on exit path and scaling.
🔹 Narrative & Context
Structure: Daily up-channel intact; recent spike down tagged the lower rail and immediately reclaimed the R/S band near 172. That zone aligns with ~0.5 Fib of the prior impulse and anchored VWAP support—classic “shakeout-and-go” anatomy.
Flow: Pullbacks within strong secular trends often pivot when broader risk metrics hit extremes. Current readings show Extreme Fear across equities and crypto (dashboard needles in single-digits/low-teens), consistent with forced-de-risking rather than trend change.
Leadership: Info Tech is 34% of the S&P 500 by weight. NVDA itself sits at ~8.06% of the index’s top-25 weight table—structurally important for passive flows. Re-risking tends to bid the heaviest weights first, providing tailwinds if indices stabilize.
Correlations to watch: NQ strength, breadth stabilization in SOX, and dollar drift lower typically amplify NVDA recovery legs.
🔹 Valuation & Context (Pro Metrics, Framed Simply)
Forward P/E: ~35–45x vs Semi/Tech peers typically ~20–25x → Market pays a premium per $1 of next-12-mo earnings → Premium reflects dominant AI compute share and visibility; multiple compression risk is why we anchor to defined stop.
P/FCF: High-teens to 20s vs peers in low-teens → Investors pay up for cash conversion → Acceptable so long as AI DC demand/ASP mix persists.
Quality (ROE/ROIC): Very high (well above typical large-cap tech) → Capital turns + software stack (CUDA) lift returns → Supports buying pullbacks, not chasing verticals.
Growth: EPS growth well above sector on AI data-center ramps → Outlier growth justifies trend-following bias.
Risk (Debt/Equity): Low/Conservative → Balance sheet flexibility if cycle wobbles.
🔹 Contrarian Angle (Your Edge)
Consensus fixates on “too expensive” optics and headline sentiment. The technical reaction at 172–182 with fear gauges at extremes argues for a positioning reset, not a trend break. With channel structure intact and flows concentrated in megacap AI, we see a credible path toward 214–220 first, then 230–246 on continuation.
🔹 Risks
Positioning/Multiple Risk: Any guide-down or supply hiccup can compress the premium multiple.
Sector Rotation: A sharp unwind in AI/semis or factor shift to defensives.
Macro Shock: Dollar spike/real-yield jump or regulatory headlines impacting export mix.
🔹 Macro Considerations
Sentiment: Equity & crypto Fear & Greed dials show Extreme Fear (single-digit/low-teens) — fuel for relief rallies when flows turn.
Index Mechanics: Tech at 34% of S&P weight; NVDA among top index constituents (~8.06% of top-25 weight list). Stabilization in SPX/NQ mechanically supports NVDA.
Flow Triggers: SOX breadth thrust, NQ reclaim of prior breakdown area, and any cooling in rates/FX volatility would accelerate the upside path.
🔹 Bottom Line
NVDA’s premium is real, but so are its cash generation and AI demand drivers. The 172–182 buy-zone offers a clean, conviction long with 152–156 as invalidation. Manage in tranches toward 188 / 205 / 214–220, leaving a runner for 230–246 if momentum and macro confirm.
🔹 Forward Path
If this gains traction (10+ likes), I’ll post: (1) a weekly/time-frame add-on with updated channel math, (2) live notes on any break/retest of 205 and 214–220, and (3) Q&A on risk management.
Like & Follow for structured ideas, not signals. I post high-conviction setups here before broader narratives play out.
⚠️ Disclaimer: This is not financial advice. Do your own research. Levels derived from the attached chart; sentiment and index weights from the referenced images. Charts/visuals may include AI enhancements.
🔹 Footnote
Forward P/E: Price divided by expected earnings over the next 12 months. Lower = cheaper relative to profits.
P/FCF (Price-to-Free-Cash-Flow): Price vs. the cash left after investments. A measure of efficiency.
FCF Yield: Free cash flow per share ÷ price per share. Higher = more cash returned for each dollar invested.
ROE (Return on Equity): Net income ÷ shareholder equity. Shows management efficiency with investor capital.
ROIC (Return on Invested Capital): Net income ÷ all invested capital (equity + debt). A purer profitability gauge.
Debt/Equity: Debt divided by equity. <1 usually means balance sheet is conservative.
R:R (Risk-to-Reward): Ratio of expected upside vs. downside. 3:1 = you risk $1 to make $3.

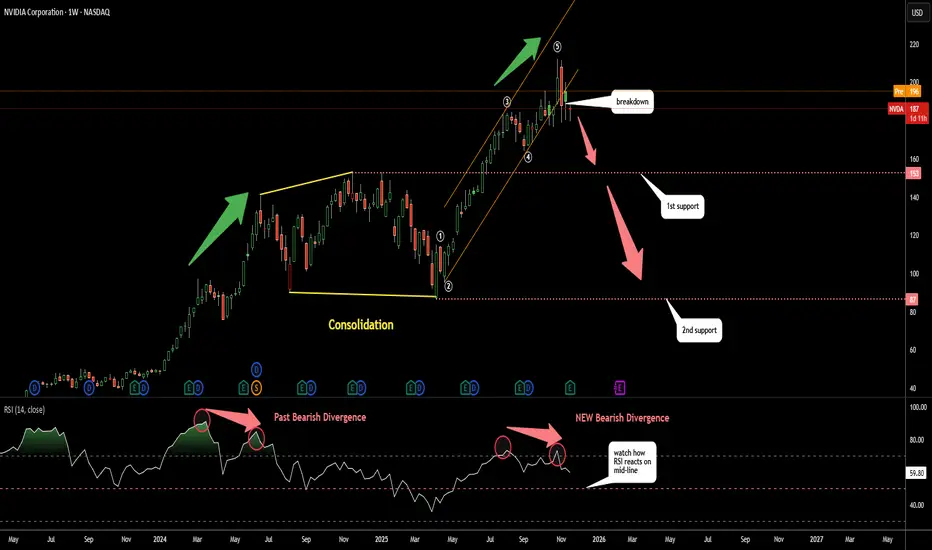
Nvdia (NVDA): How Deep It Can Dip?The RSI is not buying the hype as it shows clear Bearish Divergence
This aligns with the current impulse wave count suggesting the 5 wave structure may now be complete and the orange uptrend has been broken
Last year a similar Bearish Divergence triggered a large consolidation phase marked in yellow
It may repeat again
First support is at 153 the top of the previous consolidation
Second support is at 87 the bottom of that consolidation

NVIDIA – Best Buy of the Decade (4T Record but now resistance)🚀🔥 NVIDIA – Best Buy of the Decade Post #6
💡📉 Great but why am I taking half profits Today?
Back in July 2021, I named NVIDIA "The Best Buy of the Decade. " Today, it just hit a mind-blowing milestone — becoming the first company to reach a $4 trillion market cap. But here's the thing... that happened right at major resistance.
From our initial call in 2021 , to the target at $143.85 drawn via parabola in 2023, to the April 2025 re-entry at $95, it’s all on the chart — and it's been a textbook ride so far.
At the current level of $163.89, we’re pressing into serious overhead resistance. This doesn’t mean the story is over — not even close. But it could mean we take a breather before the next leg higher.
🧭 Targets ahead remain unchanged:
🔹 First stop: $182.85
🔹 Long-term vision: $227.41
What started as a bold macro call in 2021 has now become a multi-year thesis with precision updates along the way. This is post #6 in the NVIDIA journey — and if you scroll back through the chart, each piece has built on the last with clarity and conviction.
🎯 NVIDIA is not just a tech stock — it’s the AI backbone. But every cycle has pauses, and this one looks ready for a short rest before we see the next breakout.
Stay sharp, follow the structure, and honor the parabola.
One Love,
The FX PROFESSOR 💙
Additional info, for those who like to dive deeper into NVDA:
🔍 Technical Breakdown Version
For the chartists and structure followers, here’s the breakdown:
📌 2021: Original call — "Best Buy of the Decade"
📌 2023: First parabola plotted, projecting toward $143.85 — target hit precisely
📌 April 2025: Market offered $95 re-entry — second parabola begins
📌 Now: Price sits at $163.89, testing resistance from both structure and Fibonacci
📌 Next levels:
- $182.85 → Key extension level
- $227.41 → Long-term target based on full parabolic arc
Current structure suggests a possible pause before continuation. No need for panic — parabola remains valid unless structure is broken. Volume still supportive, and price action is following projection beautifully.
🧠 AI Macro Narrative Version
The big picture? NVIDIA isn't just another semi stock — it’s the nervous system of the AI revolution.
From gaming → crypto → AI, NVIDIA has consistently been first to adapt, and now it’s the leader in AI hardware infrastructure. The $4 trillion milestone is more than symbolic — it represents capital reallocation toward AI as the next dominant sector.
🧠 Key macro takeaways:
AI demand is insatiable
Data centers need NVIDIA
Generative AI isn't slowing down
Institutions are still buying — not selling
The resistance we see now isn’t weakness — it’s the market pausing to digest before another acceleration. Just like every past cycle... we ride, retrace, reload, and resume.
Disclosure: I am happy to be part of the Trade Nation's Influencer program and receive a monthly fee for using their TradingView charts in my analysis. Awesome broker, where the trader really comes first! 🌟🤝📈

nvidia is rangeThe inability of the price to break the 140 area and return to the 91 dollar area can be imagined in three scenarios:
1. The market will suffer in this area until the decision is reached
2. Breaking the 140 area and continuing the upward trend
3. Breaking the $75 support area and trying to reach the $53 area is out of the question at the moment.

Is SoftBank selling NVIDIA worrying you?Softbank has announced that it has pocketed all returns from their investment in NASDAQ:NVDA . I do not think this should concern anyone as it is logical to bank profits after a point where you want to redistribute cash. I do believe NVIDIA needs to take a small breath and might dip to $160 - $170 (near the gap it has created/ 1 x A Fib extension levels), as this will create some downward pressure to the already existing overvaluations. However, I think this is a setup to an amazing end of year rally.

NVDA (NVIDIA) – Buy PlanNVDA (NVIDIA) – Buy Plan
📊 Market Sentiment
On October 29, the FED lowered rates by 25bps as expected. However, Powell’s remarks introduced uncertainty around further cuts in December, emphasizing that future policy will depend on incoming data.
One FED member dissented, preferring no cut this cycle — a notable shift from September’s unanimous decision.
Additionally, ADP Non-Farm Employment Change came at 42K versus 32K expected. It’s slightly higher, but since other macro data are missing due to the U.S. government shutdown, the overall sentiment remains mixed.
For now, macro sentiment leans bearish, as rate cuts may be delayed into 2026.
However, with NVDA earnings approaching, we could see a short-term bullish sentiment building around the stock.
📈 Technical Analysis
NVDA is currently trading around the 0.5 equilibrium zone, which aligns with the HTF bullish trendline.
This area could provide temporary support and a potential bounce setup.
However, it’s crucial to watch the SPY structure as it may influence NVDA’s short-term movement.
📌 Game Plan / Expectations
I’ll be watching the $185–$180 range as a key HTF support zone.
This area also aligns with a possible trendline deviation, where price could manipulate below the trendline to trap sellers before reclaiming it.
I plan to buy call options within this range, targeting a continuation of the bullish leg post-earnings.
💬 If this breakdown aligns with your outlook, like and comment below.
For deeper sentiment and strategy insights, subscribe to my Substack — free access available.
⚠️ Disclaimer
This analysis is for educational purposes only and does not constitute financial advice. Always conduct your own research before trading or investing.

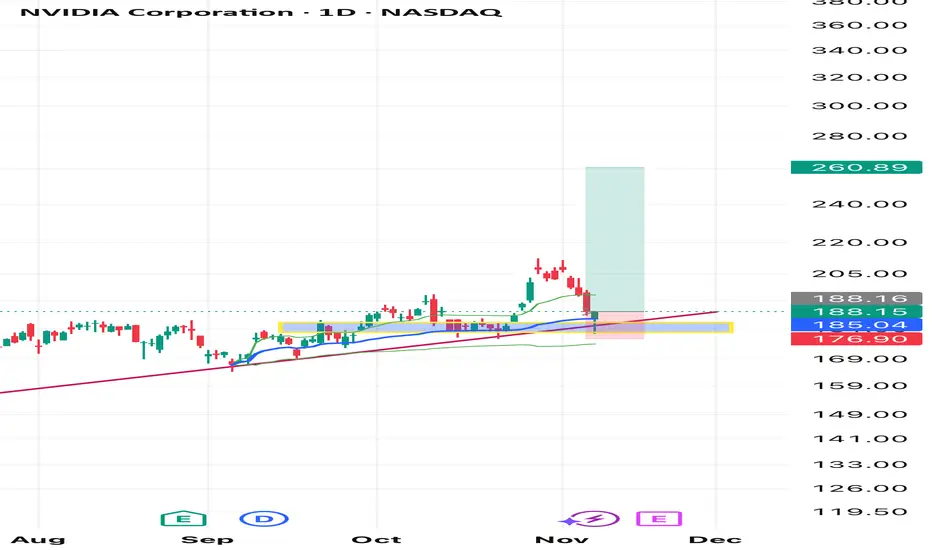
Inflection Point NVDA has a hammerhead candle on a key level and the 50 EMA and the 0.786 Fibonacci level.
Oscillators are flashing oversold. For bullish activity we need a bullish candle with a close above 188.15 and next resistance will be around 191 or 190.70. If price breaks below the 50 EMA(185.19) next key level will be 177.10

NVIDIA Technical Breakdown – November 2025Structure : Price broke out of a descending channel, retested the breakout zone, and is now hovering near a double top resistance.
Fibonacci Confluence: Price is reacting near the 50–61.8% retracement zone, a key decision area for continuation or rejection.
Liquidity Grab: A red-marked zone below shows where stop-losses were likely triggered before reversal — classic accumulation behavior.
Volume & RSI: Volume faded post-breakout, and RSI shows early signs of divergence — momentum is slowing, but not yet reversing.
Scenario Planning:
Bullish: Break and hold above double top zone with volume → target $206–$214.
Bearish: Rejection + RSI divergence → pullback to $183–$178 support.
Watching for confirmation above the double top zone. Liquidity grab + fib confluence suggest potential continuation, but momentum needs to align.
Follow @GoldenZoneFX for more content and valuable insights.

Nvda LongLong NVDA because it finished testing weekly trendline, and Vwap. The reaction to the trendline and the vwap was a hammer daily candle which shows that those will be respected.
If any other instrument you guys want me to analyse, just let me know me know!!
Good luck everyone !!
$NVDA NVIDIA CORPORATIONExecutive Summary:
NVIDIA Corporation ( NASDAQ:NVDA ) has demonstrated remarkable resilience and sustained growth over multiple market cycles, consistently defending its leadership position despite intense competition within the semiconductor and AI sectors. This analysis outlines a structured, multi-layered support framework derived from Fibonacci retracement theory, which identifies strategic price levels for potential entry. Our primary area of interest converges around the $150.00 psychological level, which aligns with a key Fibonacci midpoint and is anticipated to serve as a robust zone for buyer participation.
Detailed Technical Framework:
1. A History of Defending Its Turf:
NVDA's impressive performance is not merely a function of bullish markets but a testament to its fundamental dominance, particularly in the parallel processing and AI revolutions. The company has repeatedly validated its market strength by navigating competitive threats and leveraging its technological moat, which in turn has created a foundation of strong investor confidence. This fundamental strength is often mirrored in its technical charts, where pullbacks are frequently met with aggressive buying at key value areas.
2. The Fibonacci Support Ladder: A Tiered Defense System
By applying Fibonacci retracement levels to a significant prior upward swing, we can map a hierarchy of potential support zones. These levels do not operate in isolation but represent a cascading series of defenses where buyers have historically stepped in. Our analysis identifies the following critical tiers, from shallowest to deepest:
First Line of Defense (Shallow Pullback):
23.6% Level ($182.53): This level represents a mild, healthy pullback. A hold here would signify exceptionally strong momentum and would likely be a continuation pattern rather than a deep correction.
Secondary Support Zone (Moderate Correction):
38.2% Level ($164.02): A retracement to this level indicates a more pronounced correction but remains within the bounds of a strong uptrend. This is a common level for institutions to begin accumulating positions.
50.0% Level ($149.39): The halfway point of the prior major move is a critical psychological and technical battleground. A successful bounce from this level suggests the overall bull trend remains intact and that market sentiment has found a balance.
Tertiary & Deep Value Zones (Significant Correction):
61.8% Level ($134.58): Known as the "Golden Ratio," this is a deep retracement that often holds in volatile but fundamentally sound assets. A test of this level would indicate a major correction is underway, presenting a higher-risk but potentially high-reward entry point for long-term believers.
78.6% Level ($113.49): This is a deep, rarely-tested retracement level. A move to this zone would signal a severe market downturn or a fundamental reassessment of the stock, but it would also represent a potentially profound long-term value opportunity.
The Ultimate Major Support:
The $100.00 Psychological Level: Beyond the Fibonacci structure, the triple-digit benchmark at $100.00 stands as a monumental psychological and technical support. It represents a round number that often attracts immense buying interest and would be considered a "line in the sand" for the long-term thesis.
3. Primary Strategic Interest & Risk Management:
While the Fibonacci ladder provides multiple potential entry points, our primary area of strategic interest converges around the $150.00 level. This is not a single price point but a zone encompassing the 50% Fibonacci level at $149.39. The rationale for favoring this zone is twofold:
Technical Significance: It is a classic "value area" in a strong trend, offering a favorable balance of potential upside and managed risk.
Psychological Strength: The $150 level is a major round number that is easy for the market to identify and act upon.
A decisive reversal at or near this $150 zone, confirmed by bullish price action (e.g., hammer candlesticks, increased volume on up-days), would provide a strong signal for capital deployment. As with any investment, this thesis requires disciplined risk management; a sustained break below the deeper supports, particularly the $134.58 (61.8%) level, would necessitate a re-evaluation of the near-term bullish outlook.

NVDA Weekly Options SignalNVDA Weekly Options Analysis – 2025-11-12
Current Price: $192.38
Trend: Neutral (Weekly Momentum: Bearish -1.73%)
Confidence: 58% | Conviction: Low
Expiry: 2025-11-14 (2 days)
Recommended Strike: $192.50
Technical Overview:
Price in the middle of weekly range ($178.91–$200.05)
EMA alignment confirms bearish weekly trend
VWAP at $190.89 offers near-term support
Volume spike (26.4x previous week) indicates potential capitulation
Options Flow:
Extremely bullish, PCR 0.42 → heavy call buying
Max volume at $262 call shows institutional positioning
High gamma risk, volatility potential elevated
Trade Setup:
Direction: Buy Calls (Long)
Entry: $2.74
Target 1: $3.70 (+35%)
Target 2: $4.50 (+64%)
Stop Loss: $2.05 (-25%)
Position Size: 2% portfolio (Low conviction)
Summary Insight:
Katy AI shows neutral/bearish signals, but options flow suggests bullish institutional interest
High-risk, low-conviction setup; small position recommended
Mixed technicals and news sentiment → use tight risk management
⚠️ Risk Warning:
Conflicting signals → only small size recommended
Not financial advice; educational commentary for QS Premium members

Re-Entering NVD - Eyeing Mid-November ReversalReopened long on NVDA with Jan 16 ’26 $180 Call at 16.50. Expecting rebound from recent 13% drop and continuation higher through Q4 as momentum returns.
Nvidia Stock Fails to Return to the $200 LevelAlthough Nvidia seemed poised to start the week with an optimistic bias, partly driven by the end of the U.S. government shutdown, which has generated a short-term confidence boost, the stock has begun to show a bearish tone in the current session, posting a decline of more than 2%. This weakness is mainly due to recent comments from the SoftBank Group, which sold its entire stake in Nvidia for approximately US$ 5.8 billion, raising concerns about a possible reduction in exposure to the semiconductor industry in the short term. This event has led to growing investor caution toward the stock and currently maintains a notable selling bias in the market.
Uptrend Tries to Hold
Despite recent downward corrections that have halted the stock’s steady advance, Nvidia has yet to show a decisive bearish move that would end the long-term uptrend line. In the broader picture, buying momentum continues to hold firm. However, if selling pressure continues to strengthen, the uptrend could be at risk, especially if the price falls below the 50-period moving average.
RSI
The RSI indicator line is gradually approaching the neutral level of 50, suggesting a balance between buying and selling forces over the last 14 trading sessions. As long as this equilibrium remains, the stock is likely to continue showing indecisive movements in the coming days.
TRIX
The TRIX indicator remains above the neutral level of 0, indicating that in the long-term outlook, bullish strength continues to dominate the average of exponential moving averages. As long as the TRIX stays above this level, the bullish bias may remain intact, allowing the uptrend line to continue defending its position over the coming weeks.
Key Levels to Watch:
208 USD – Major Resistance: Corresponds to the area of recent highs. Price movements breaking above this level could trigger stronger buying pressure, reinforcing the current uptrend.
200 USD – Nearby Resistance: A key psychological level. Price action above this zone would reactivate a short-term bullish bias and reduce the risk of a trendline breakdown.
184 USD – Key Support: This is the most relevant support area, coinciding with the 50-period moving average and the Ichimoku cloud, which increases its significance. Downward movements reaching this zone could end the long-term bullish structure and lead to a period of indecision or the formation of a short-term consolidation range.
Written by Julian Pineda, CFA, CMT – Market Analyst

Global Market Participants1. Introduction to Global Market Participants
Global market participants are entities that take part in international financial transactions. These include individual investors, institutional investors, corporations, governments, central banks, and intermediaries. Their activities impact the stability, efficiency, and development of the financial markets. The diversity among these participants ensures liquidity, facilitates price discovery, and contributes to economic growth by channeling funds from savers to borrowers worldwide.
2. Individual Investors
Individual investors, often called retail investors, are private persons who invest their own money in various financial assets such as stocks, bonds, mutual funds, or cryptocurrencies. Their primary goals are to grow wealth, earn income, and achieve financial security.
Key Characteristics:
Smaller investment amounts compared to institutions.
Focus on long-term capital appreciation or short-term trading profits.
Tend to rely on brokers, financial advisors, and digital trading platforms.
Role in the Market:
Retail investors enhance market liquidity and promote diversity in trading behaviors. With the rise of online trading platforms and fintech innovation, the participation of individuals in global markets has increased significantly. Social media and global connectivity now allow retail investors to influence markets, as seen during events like the 2021 “meme stock” phenomenon.
3. Institutional Investors
Institutional investors are large entities that pool money from clients or members and invest in financial markets to achieve specific objectives. They include pension funds, insurance companies, mutual funds, hedge funds, and sovereign wealth funds.
a. Pension Funds:
Pension funds invest the savings of employees to ensure financial security after retirement. They typically favor long-term, stable investments like bonds and blue-chip stocks.
b. Insurance Companies:
Insurance firms invest premiums collected from policyholders in relatively safe and income-generating assets to meet future claims.
c. Mutual Funds:
These funds pool money from numerous investors to invest in diversified portfolios of stocks, bonds, or other assets. They enable individuals to access professional management and diversification benefits.
d. Hedge Funds:
Hedge funds target high returns through aggressive strategies, including leverage, derivatives trading, and short-selling. They often cater to high-net-worth individuals and institutions.
e. Sovereign Wealth Funds (SWFs):
These are government-owned investment funds that manage national reserves, often derived from oil revenues or trade surpluses. Examples include Norway’s Government Pension Fund Global and Singapore’s GIC.
Impact on Global Markets:
Institutional investors dominate global capital flows and can significantly influence market trends. Their large-scale investments affect prices, volatility, and even government bond yields.
4. Corporations and Multinational Companies (MNCs)
Corporations participate in global financial markets for financing, investment, and risk management purposes.
Key Activities:
Raising Capital: Through issuing stocks or bonds to finance expansion.
Foreign Exchange Management: Engaging in currency markets to hedge exchange rate risks.
Mergers and Acquisitions: Companies use global capital markets to fund cross-border deals.
Example:
A U.S.-based company operating in Europe may use derivatives to hedge against euro-dollar exchange rate fluctuations. Multinational corporations also issue global or Eurobonds to attract international investors.
5. Governments
Governments are major players in global markets, primarily as issuers of sovereign debt and regulators of financial systems.
Roles:
Issuers of Government Bonds: To finance public spending and infrastructure projects.
Market Regulators: Setting and enforcing financial regulations to maintain transparency, stability, and investor confidence.
Participants in the Currency Market: Governments manage foreign exchange reserves to stabilize national currencies and support trade balances.
Example:
The U.S. Treasury issues bonds that serve as global benchmarks for risk-free assets, while developing nations issue sovereign debt to attract foreign capital.
6. Central Banks
Central banks, such as the U.S. Federal Reserve, the European Central Bank (ECB), and the Reserve Bank of India (RBI), are among the most influential market participants.
Key Functions:
Monetary Policy: Controlling money supply and interest rates to manage inflation and stimulate growth.
Foreign Exchange Operations: Buying and selling currencies to stabilize exchange rates.
Liquidity Provider: Acting as lenders of last resort to the banking system.
Central banks also influence global markets through quantitative easing, where they purchase government bonds to inject liquidity into the economy. Their decisions can trigger global reactions, affecting stock, bond, and currency markets worldwide.
7. Financial Intermediaries
Financial intermediaries connect savers with borrowers, facilitating the flow of funds across the economy. These include commercial banks, investment banks, brokers, and exchanges.
a. Commercial Banks:
Provide loans, accept deposits, and offer payment systems. They are key in credit creation and financial stability.
b. Investment Banks:
Help corporations and governments raise capital through underwriting securities and managing mergers and acquisitions.
c. Brokers and Dealers:
Act as agents for investors, executing trades and providing liquidity in financial markets.
d. Exchanges:
Stock and commodity exchanges provide regulated platforms for buying and selling financial instruments. Examples include the New York Stock Exchange (NYSE), London Stock Exchange (LSE), and the Bombay Stock Exchange (BSE).
8. Speculators and Traders
Speculators take on financial risk in the hope of profiting from price movements. While often viewed as risk-takers, they serve an important function by adding liquidity and aiding price discovery.
Types of Traders:
Day Traders: Engage in short-term trades for quick profits.
Arbitrageurs: Exploit price differences between markets or instruments.
Algorithmic Traders: Use computer programs to execute high-frequency trades.
Their activities ensure continuous market operation, even during volatile periods.
9. Credit Rating Agencies
Agencies such as Moody’s, Standard & Poor’s (S&P), and Fitch Ratings assess the creditworthiness of companies, governments, and financial instruments. Their ratings influence investor confidence, bond yields, and borrowing costs.
Role in Global Markets:
Facilitate informed investment decisions.
Help maintain transparency and discipline among borrowers.
Influence capital allocation by institutional investors.
However, rating agencies have faced criticism for conflicts of interest and their role in past financial crises, such as the 2008 global meltdown.
10. International Financial Institutions
Organizations such as the International Monetary Fund (IMF) and the World Bank play a stabilizing role in the global market.
The IMF:
Provides financial assistance to countries facing balance-of-payments crises and promotes exchange rate stability.
The World Bank:
Funds infrastructure and development projects in emerging economies to promote long-term economic growth.
Their involvement ensures global financial stability and supports developing nations in integrating into global markets.
11. Hedge Funds and Private Equity Firms
Hedge funds and private equity firms are specialized investment entities managing large pools of capital with flexible strategies.
Hedge Funds: Focus on generating high returns through trading and leverage.
Private Equity Firms: Invest directly in private companies or buy out public firms to restructure them.
They are crucial in improving corporate efficiency, promoting innovation, and influencing global capital allocation.
12. Conclusion
Global market participants collectively form the backbone of the world’s financial system. From individual investors to powerful institutions like central banks and sovereign wealth funds, each plays a unique role in shaping market behavior and economic outcomes. Their interactions drive capital flows, influence asset prices, and impact global growth and stability.
Understanding these participants helps explain how financial markets function and respond to economic, political, and technological changes. In an increasingly interconnected world, the balance between these entities determines the resilience and sustainability of the global financial ecosystem.
In essence, the global market is a dynamic arena where diverse participants—each with distinct motives and influences—interact to create a continuously evolving landscape of opportunity, competition, and innovation.

NVDA Pullback or Trend Break? (Nov 10–14)Full Multi-Timeframe Outlook
NVDA just had one of its sharpest weekly pullbacks in months, and this week is all about figuring out whether this drop is simply a reset inside the bigger bullish trend or the start of a deeper correction. I’ll walk through each timeframe so traders can understand the structure clearly.
1. Weekly Timeframe (1W)
Macro Structure
NVDA finally tapped the top of the long-term rising wedge and rejected aggressively. Even with the deep weekly red candle, the bigger structure hasn’t broken yet — NVDA is still sitting above the main weekly trendline that carried the entire 2023–2025 bull run.
Weekly demand starts around 153–160. Price hasn’t reached that level yet, but the rejection candle shows sellers finally stepping in with size.
Weekly MACD is rolling over for the first time since mid-summer. Stoch RSI is turning down from overbought. Both suggest momentum is cooling on the larger timeframe.
Weekly Trade View
Watch how NVDA reacts around the trendline near 184–188. As long as NVDA stays above 153–160, the larger trend remains bullish, but a break below 184 adds pressure.
Weekly GEX Perspective
Below 180, negative GEX expands heavily, which tends to increase volatility on the downside.
Above 200, positive GEX slows the upside.
This places NVDA in the middle of a high-energy zone — whichever way it breaks next will likely extend for days.
2. Daily Timeframe (1D)
Daily Trend and Structure
The daily chart is where the weakness is more visible. We already printed a downside CHoCH, confirming a short-term trend shift. NVDA has also broken its rising channel from September, which means sellers took control temporarily.
Key daily support sits at 176–184. That’s a demand cluster plus the midpoint of the previous impulse. The daily candle you posted shows NVDA sitting right on this zone.
Daily MACD crossed bearish and continues to widen. Stoch RSI is oversold but hasn’t curled yet — usually a sign that a bounce needs more time to develop.
Daily Trade View
Hold 184 → NVDA can bounce back toward 195 then 202.
Break 176 → opens a deeper retracement toward 164 and even 153.
Daily GEX View
There is a major put wall around 178–180.
This level often acts like a gravitational pull, especially in pullbacks.
The next put concentration is near 164.
Unless NVDA reclaims 190–195 quickly, the daily structure still favors a retest of these lower zones.
3. 1-Hour Timeframe (1H)
Short-Term Structure
You can see NVDA has been sliding down the descending intraday channel for days. The most recent BOS is bearish, but the latest CHoCH shows buyers finally trying to step in around 178.
Price is now approaching the 190 resistance — this is the intraday pivot for the week.
1H MACD is curling upward, showing the first momentum shift since early November. Stoch RSI is rising fast, confirming short-term buyers entering.
1H Trade View
Above 190 → opens room toward 195 then 202.
Reject 190 → NVDA likely rolls back toward 184 then 178.
The 190 break is the whole game for intraday momentum.
4. 15-Minute Timeframe (15M)
Intraday View
The 15M shows the cleanest structure:
A strong BOS just formed, and NVDA broke the intraday trendline. This is the first real bullish sign since the selloff started.
However, the CHoCH that printed after the BOS is sitting right underneath the 188–190 ceiling. That means the sellers still sit overhead waiting.
MACD on 15M is trending strongly upward — momentum is on the bulls’ side right now.
15M Trade View
Break and hold above 188–190 → intraday long toward 195.
Reject 188–190 → expect a fade back toward 184.
This level aligns across all lower timeframes, which makes it extremely important for Monday and Tuesday.
5. GEX Map & Options Strategy
GEX Interpretation for NVDA (This Week)
The GEX chart shows:
Positive GEX at 195–205
Negative GEX at 178–180
A major put wall at 178.91
A major call wall at 202–205
What this means:
Under 180 → volatility expands downward as dealers hedge.
Over 195 → upside will feel slower and grindy, not explosive.
202–205 → heavy call wall likely to act as a ceiling unless NVDA has strong momentum.
Options Strategy
If NVDA rejects 188–190:
Short-dated puts targeting 180 or 178 make sense.
If NVDA reclaims 190 and holds:
Short-dated calls targeting 195 or 202 are the better play.
Avoid chasing anything above 205 — that’s deep inside positive GEX and tends to stall.
My Thought
NVDA is in a very interesting spot going into the week. Higher timeframes are still bullish, but the daily and intraday charts clearly show the momentum shift to the downside. Everything comes down to how price reacts between 188 and 190.
Rejecting that zone keeps the pullback alive toward 184–178.
Breaking above that zone starts the recovery toward 195–202.
This is a week where levels matter more than bias. The reaction at 188–190 will decide which side controls NVDA next.
Disclaimer
This analysis is for educational purposes only and not financial advice. Always trade your own plan and manage your risk. If you want a breakdown on another ticker, just drop it in the comments.

NASDAQ:NVDA — pre-earnings Swing Trade Breakdown💰 NVDA — Swing Trade Breakdown
Ticker: NASDAQ:NVDA
Duration: Short-term swing (pre-earnings setup, ~12 days before report)
🏢 Company Snapshot
NVIDIA is the global leader in GPUs and AI computing hardware. The stock remains a momentum anchor in the semiconductor space, benefiting from continued AI data-center demand and strong cash flow expansion. Current setup follows a steep pullback — RSI(2) at 6.32, signaling short-term exhaustion and potential bounce zone.
📊 Fundamentals
P/E: ~56× (vs ~35× industry average) → Premium valuation justified by hyper-growth.
P/B: ~48× → Reflects asset-light, high-margin structure.
Debt/Equity: ~0.09 → Very low leverage, excellent balance sheet.
ROE: > 100 % → Exceptional profitability.
Dividend Yield: 0.02 % → Pure growth focus.
Free Cash Flow: ~$72 B TTM → Strong liquidity and reinvestment potential.
Cash on Hand: High, current ratio ~4.2× → Excellent short-term flexibility.
Summary: Outstanding profitability and balance sheet strength, but valuation remains stretched.
📈 Trends & Catalysts
Revenue Growth: +60 % YoY (AI infrastructure and data-center demand).
EPS Trend: Rising sharply with margin expansion.
Cash Flow Trend: Explosive FCF growth — from ~$4 B (2023) to ~$60 B (2025).
Balance Sheet: Minimal debt, huge cash reserves.
Catalysts: Upcoming earnings (~12 days), AI build-out momentum, tech rotation inflows.
Risks: Elevated valuation, potential multiple compression post-earnings, high beta (~2.1).
🪙 Industry Overview
Semiconductors remain one of the strongest global sectors.
Weekly: Up ~2-4 % — rotation into large-cap AI plays.
Monthly: Up ~8-12 % — capital inflows favoring high-growth tech.
12-Month: Strong outperformer vs. S&P; macro driven by AI demand cycle.
📐 Technicals
Price: ~$188.08
50-SMA: ~175 – 180 → currently testing zone.
200-SMA: ~145 – 150 → long-term uptrend intact.
RSI(2): 6.32 → extremely oversold, near reversal zone.
Pattern: Short-term consolidation after parabolic run; possible breakout retest.
Support: $165 – 175
Resistance: $205 – 215
Volume: Watch for accumulation spikes near support for confirmation.
🎯 Trade Plan
Entry Zone: $180 (buy near support on strength confirmation).
Stop Loss: $175 (below key support / invalidation).
Target: $190 (first swing resistance).
Risk/Reward: ~2:1 if entered near $180.
Alternate Setup: Continuation breakout > $215 for momentum traders.
🧠 My Take
NVDA remains the king of AI momentum. Fundamentally bulletproof, technically oversold, and sitting on key support ahead of earnings. Ideal setup for a 2:1 swing bounce — but exit before the earnings date to avoid volatility risk. Watching for a reversal candle or volume confirmation near the 50-SMA zone.

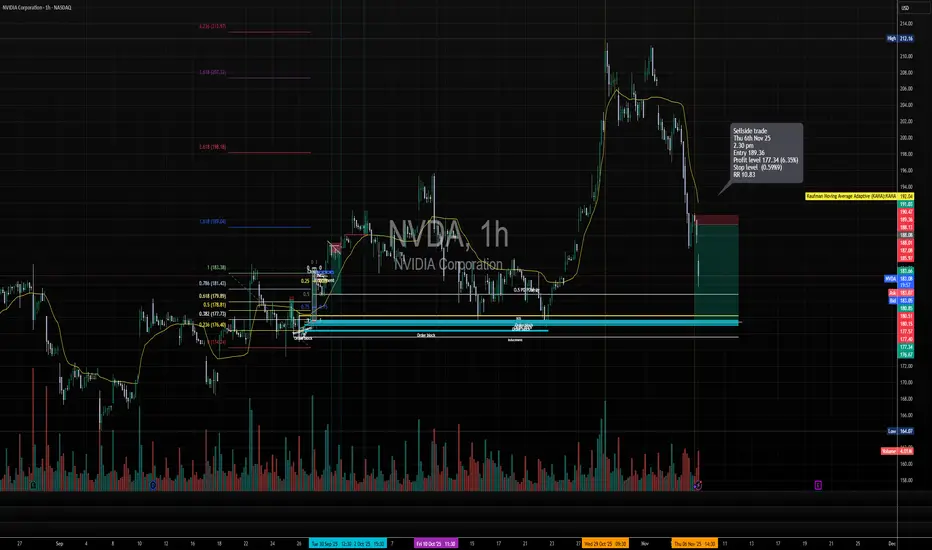
Short trade 📘 Trade Summary
Pair: NVDA (NASDAQ)
Direction: Sell-side Trade
Date: Thu 6 Nov 25
Time: 2:30 pm
Entry: 189.36
Profit Level: 177.34 (+6.35%)
Stop Level: 189.99 (–0.59%)
Risk-Reward (RR): 10.83
🧩 Technical Context
Price Structure: Market rejected near the previous swing high (~$197–$200 region) after failing to sustain above the 1.618 extension level.
Fibonacci Context: Retracement zones from 0.382 – 0.786 aligned with prior accumulation zones, showing resistance at 0.618 (≈ 179.89) and 0.786 (≈ 181.43).
Order Block Alignment: Two visible order blocks (highlighted in blue) show prior demand zones — price is expected to retrace into these for potential take-profit liquidity.
Volume Spike: Noticeable volume at the rejection candle near $190–$191 indicates institutional sell orders stepping in.
EMA Context: Price fell below the Kaufman Adaptive Moving Average (KAMA), confirming a short-term shift to bearish momentum.
🧠 Trade Narrative
This short setup capitalises on:
A failed breakout at the prior liquidity high (~$197),
Break of structure (BOS) confirming downside shift, and
Entry at the retest of a supply zone near $189.
Targeting liquidity sweep of prior accumulation zone around $177, where confluence with the lower order block exists.
Nvidia Corp.($NVDA) Drops as U.S. Blocks AI Chip Sales to China Nvidia Corp. (Nasdaq: NASDAQ:NVDA ) shares dropped 4.18% to $180.22 on Friday after reports that Washington will block the company’s sales of scaled-down AI chips to China. The decision marks another escalation in U.S. restrictions on advanced semiconductor exports.
According to The Information, the White House informed several federal agencies that Nvidia will not be allowed to sell its new B30A AI chip to Chinese firms. Nvidia had already provided samples to some customers in China before the ban was confirmed.
The B30A was designed to meet U.S. export thresholds while retaining enough computing power for AI training when used in large clusters. However, U.S. officials reportedly concluded that the chip still poses national security risks.
Compounding Nvidia’s challenges, Beijing has issued new guidelines restricting foreign chips in state-backed data centers. Reuters reported that China will require all new projects using government funding to rely solely on domestically developed processors. Data centers less than 30% complete must remove foreign chips, while advanced projects will face case-by-case reviews.
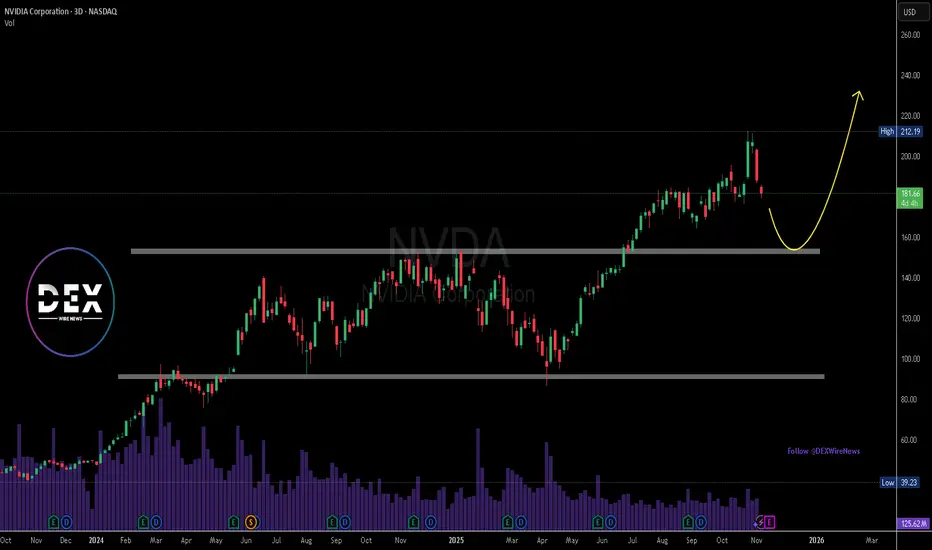
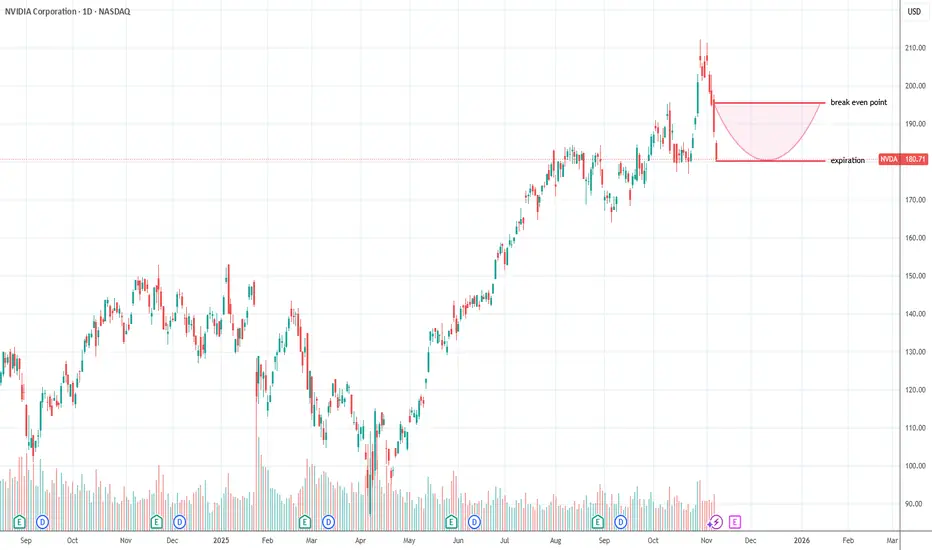
Technical View
The NVDA chart shows a recent rejection from the $212 level, with price sliding toward $180. A further decline toward $160 support is possible before a rebound, as indicated by the yellow curve. Long-term structure remains bullish, but near-term weakness persists under regulatory pressure