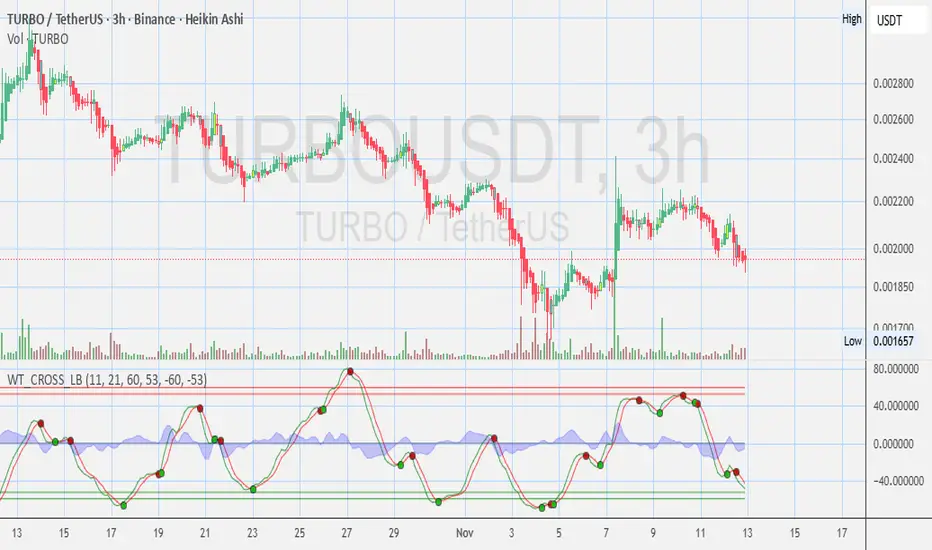
TURBO - 3 Hours Chart Opinions?🧠 Keep it on watch. Momentum shifting.
⚠️ Disclosures :
This analysis is for informational purposes only and is not financial advice. It does not constitute a recommendation to buy, sell, or trade any securities, cryptocurrencies, or stocks. Trading involves significant risk, and you should consul
TURBO with Bullish Pattern - Ready to Go !Talked about this on todays Live Stream
Broke out of side ways accumulation
and is now currently in another side ways accumulation
(bull flag - bullish pattern)
Price action at top of accumulation range
- would like to see a retracement
( about the mid-line of the zone )
before upward contin
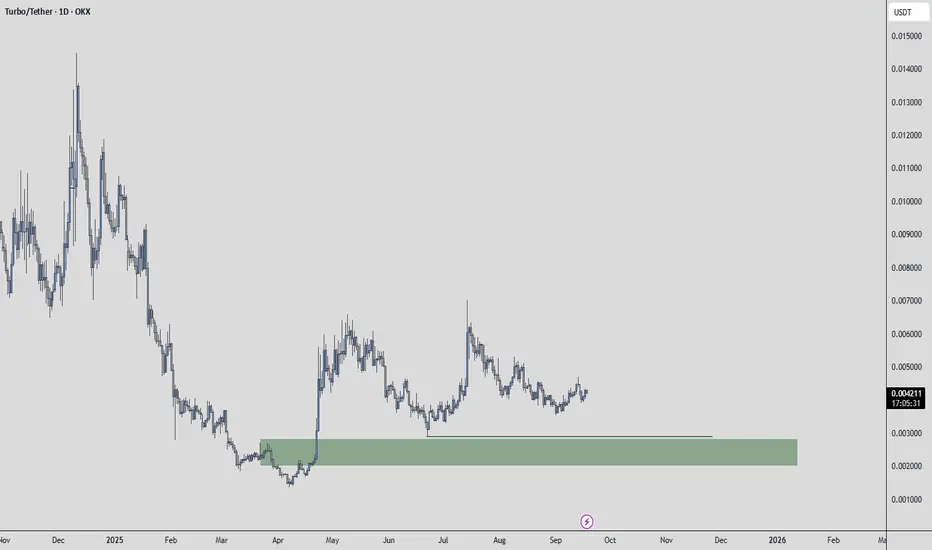
TURBOUSDT | Green Box as Entry ZoneOn TURBOUSDT, the green box marks a clean demand zone. Buyers have shown activity here before, and the structure suggests it can still offer solid entries.
For confirmation, I’ll be watching:
CDV holding steady or curling up
Footprint absorption around the zone
Low timeframe breakout to trigger
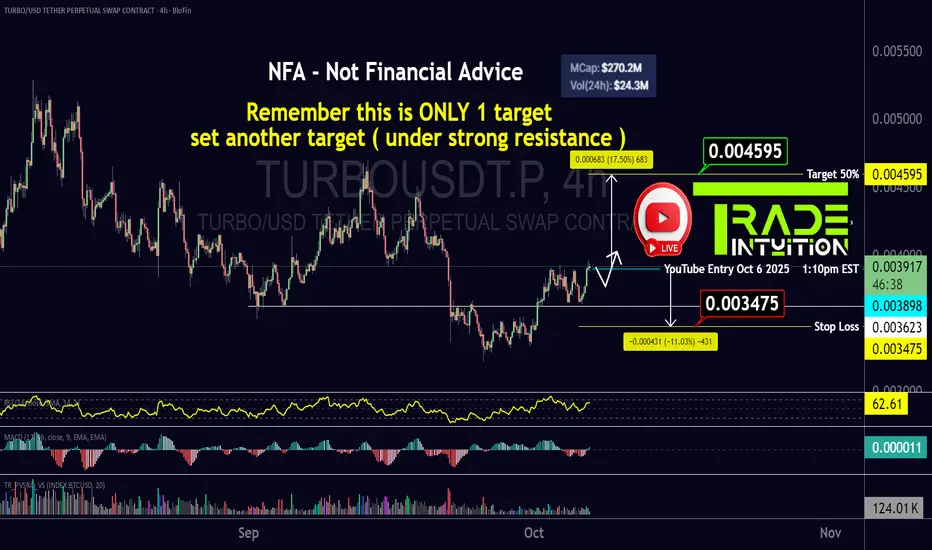
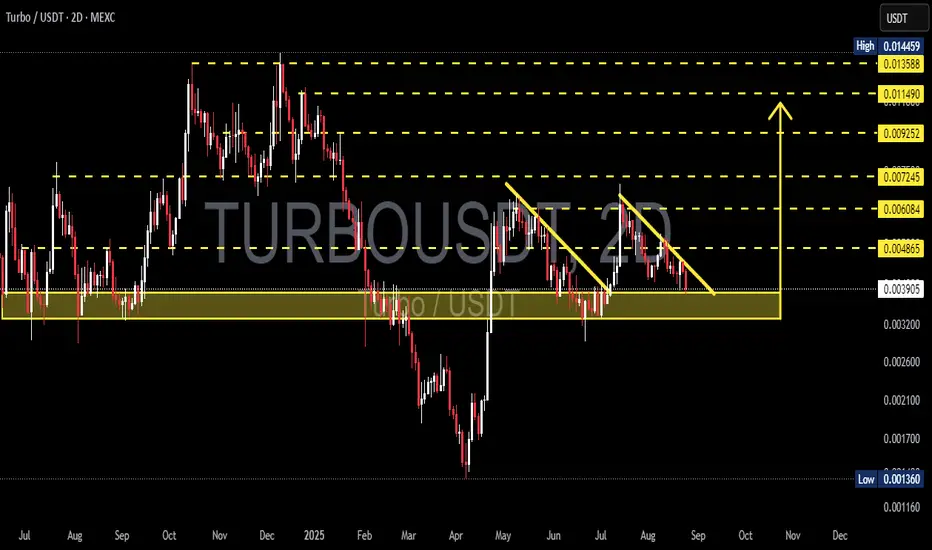
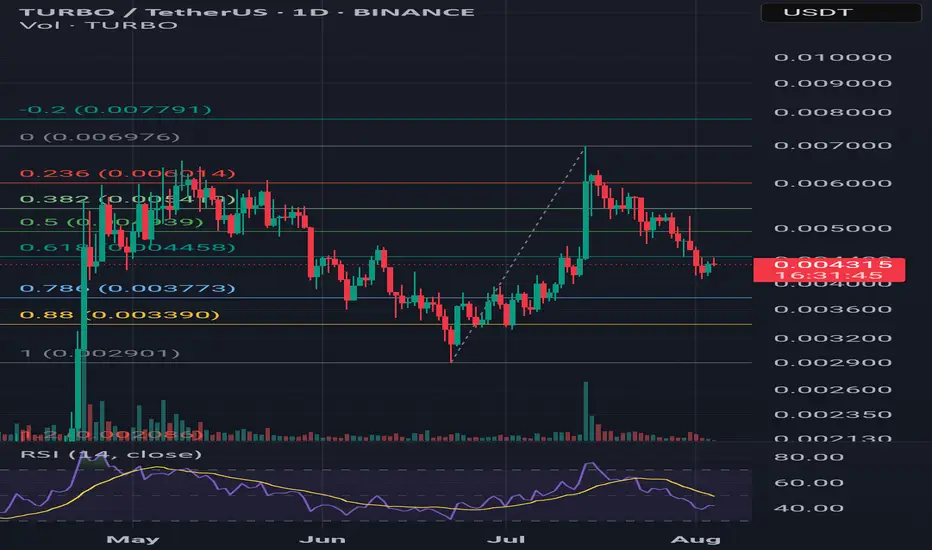
TURBO : Points I want to buyHello friends
Given the good growth we had, we have now achieved important price support with Fibonacci in the price pullback and I think the price can move from these areas to the specified targets.
*Trade safely with us*

TURBOUSDT UPDATE#TURBO
UPDATE
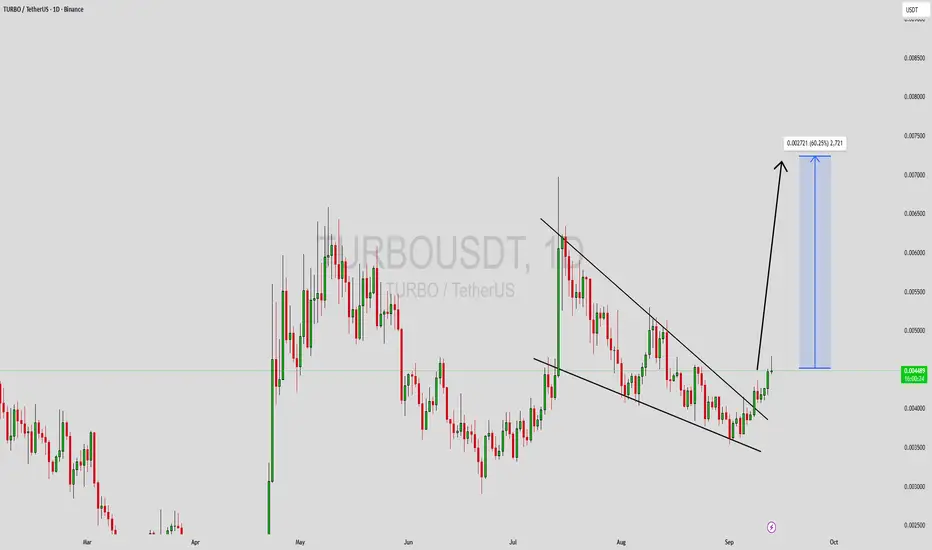
TURBO Technical Setup
Pattern: Bullish Falling Wedge Pattern
Current Price: $0.00445
Target Price: $0.00650
Target % Gain: 50.49%
MYX:TURBO is breaking out of a falling wedge on the 1D timeframe. The breakout confirms bullish momentum with structure favoring continuation toward $
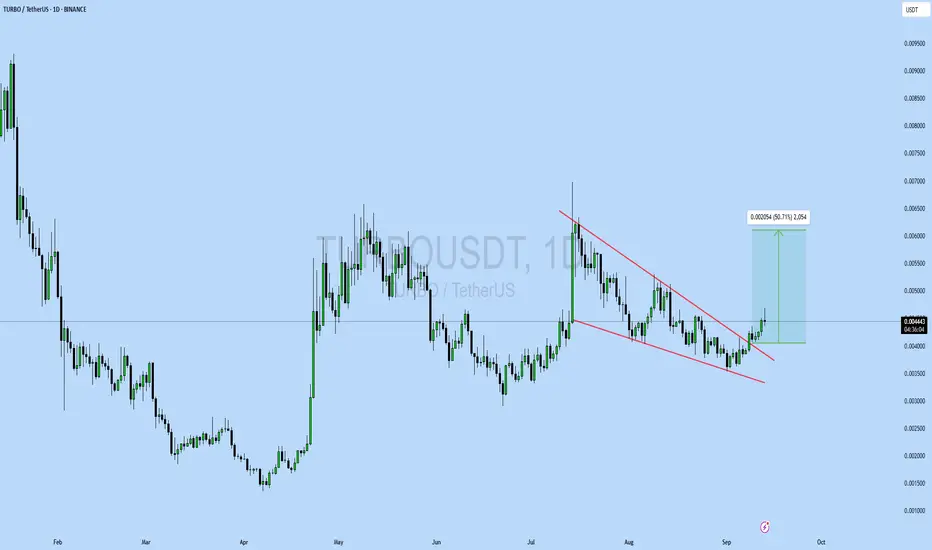
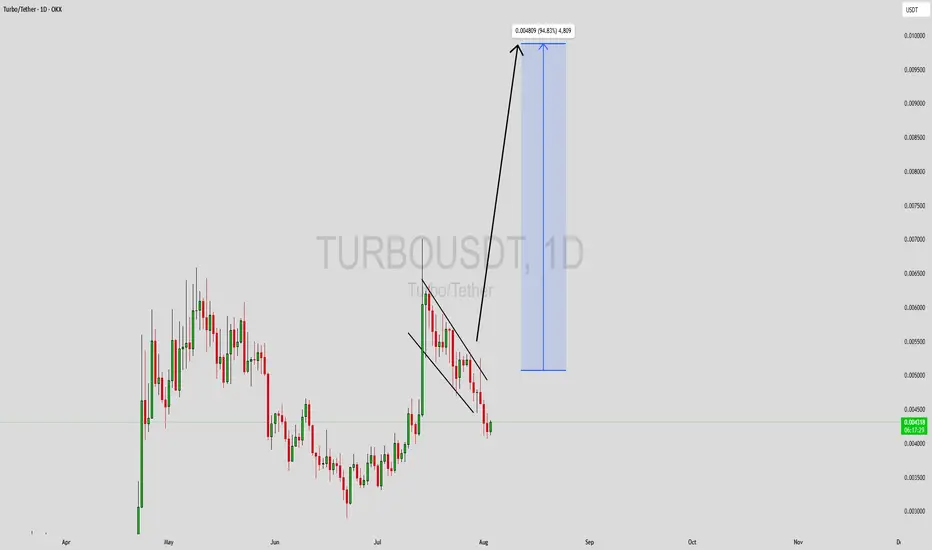
TURBOUSDT Forming Falling WedgeTURBOUSDT is showing a breakout from a falling wedge pattern on the daily chart, which is a strong bullish reversal signal. After a period of consolidation and steady accumulation, the price has pushed above resistance, confirming momentum shift in favor of buyers. With good volume supporting the mo
TURBO/USDT – at Key Demand Zone! Falling Wedge Near Breakout?📊 Full Analysis:
Currently, TURBO/USDT is trading at a very critical level. The chart shows price consistently being pressed down by the descending trendline (yellow), forming a Falling Wedge pattern—a structure that often signals a bullish reversal once broken to the upside.
At the same time, pric
Turbo Breakout and Upcoming Cycle Low StrategyTurbo has broken out of its narrowing wedge and most likely flipped it into support. This could be a breakout-retest-resumption, but its next cycle low is coming up quickly around October 4th. I have a feeling the cycle low will extend to October 6th to sync up with BTC and stocks. I’ve made my core

TURBO/USDT – Cup and Handle Formation (1D Chart)Overview:
TURBO/USDT is potentially forming a textbook Cup and Handle pattern on the 1-day chart. Price action suggests a rounded bottom (the “cup”) followed by a consolidation range (the “handle”), setting up for a possible breakout.
---
🔍 Pattern Structure:
- Cup Formation:
Price rallied fr
TURBOUSDT Forming Bullish PennantTURBOUSDT is currently exhibiting a bullish pennant pattern on the charts—a continuation setup that often leads to strong upward movement after a period of consolidation. This pattern typically forms after a sharp upward move, followed by a tightening range that resembles a pennant or small symmetri
See all ideas
Summarizing what the indicators are suggesting.
Oscillators
Neutral
SellBuy
Strong sellStrong buy
Strong sellSellNeutralBuyStrong buy
Oscillators
Neutral
SellBuy
Strong sellStrong buy
Strong sellSellNeutralBuyStrong buy
Summary
Neutral
SellBuy
Strong sellStrong buy
Strong sellSellNeutralBuyStrong buy
Summary
Neutral
SellBuy
Strong sellStrong buy
Strong sellSellNeutralBuyStrong buy
Summary
Neutral
SellBuy
Strong sellStrong buy
Strong sellSellNeutralBuyStrong buy
Moving Averages
Neutral
SellBuy
Strong sellStrong buy
Strong sellSellNeutralBuyStrong buy
Moving Averages
Neutral
SellBuy
Strong sellStrong buy
Strong sellSellNeutralBuyStrong buy
Displays a symbol's price movements over previous years to identify recurring trends.