ITC chart analysis for positional trade.......................................
(entry, exit, stop loss, identified )
ITCGX trade ideas

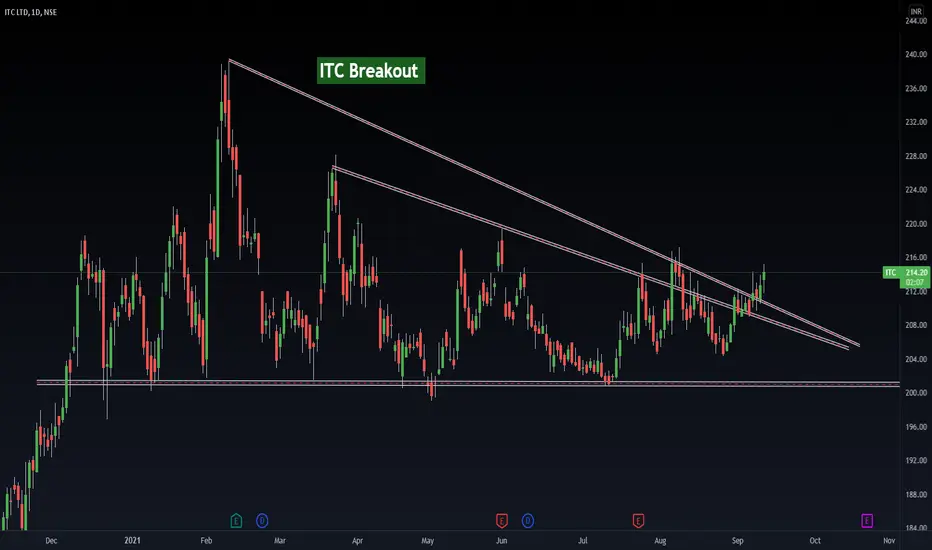
ITC - Upward BreakoutHi Traders,
As you can see from the chart ITC LTD is in downtrend from 9th Feb 2021 but now it is at the point of breaking out the downward trend line in upward direction. You can take the trade at Rs.213.25 (Buy) and Target -1 is Rs.226.5/- and Target 2 is Rs.237/- (Exit). Stop loss is based on your risk appetite. This trade is for Positional trade (i.e. for short term and not for Intraday trade). Please take the trade only after confirmation candle to avoid the risk of Fake out.
Note:
This is not a Financial advice, trade at you own risk.

Bullish NSE:ITCBuy = 234
SL = 221.35
Target 1 = 259.3
Target 2 = 271.95
17/09/2021
Bullish NSE:ITC-->ITC Ltd
Buy for short term


ITC after long time consolidationITC after long time consolidation can see good momentum in coming days.ITC after long time consolidation can see good momentum in coming days


Flag PatternStock Analysis: ITC has formed flag pattern, it is good buy around current level with below demand zone as stop loss for the target given on the chart.
Happy Investing!

ITCITC has probably become the most hated stock in recent times, but chart is telling different story, it appears that the stock is currently in wave 3, and it has possibly completed a long complex correction in wave II of 3rd, and the stock bounced back from the support zone around 200, and finally it has given a fresh breakout of decending triangle or flag pattern with very good intensity of volume, the stock is set to start wave III of 3rd. one can go long at current level or in dips (if any), all the key levels are mentioned in chart with Stop-loss and Targets.
Wave Structure, with channel and key levels
Decending Triangle pattern Breakout
Breakout with Good intensity of Volume, Zoomed View
Weekly MACD Uptick
Daily MACD Uptick
BBC up
Very Good positive Ungali setup
RSI in daily above 60 uptick
Disclaimer
I am not sebi registered analyst
My studies are Educational purpose only
Consult with your Financial advisor before trading or investing


ITC BREAKOUTITC BREAKOUT on daily chart , and also on weekly chart , what is your view for this ? will it go upside or itc nee to waitmore
ITC LongITC - Everybodys favourite stock is looking set to launch.
It looks like in a overrun bull market , there arent many stocks with resonable valuation and here is where ITC could be in radar of institutions and the buying may start. This is a thesis that could play out.
No a recommedation, No entry.
No of share holders is too high so price movement is very difficult.
Just for observation and learning.

ITC HOURLY CHART Inverse head and shoulder pattern on hourly chart .217 big hurdle if closed above and sustain for couple of days then rally will start . 260-265 potential tgt . if 217 not crossed then it will be stuck in 202-217 range

ITC (1) ITC (D) CMP:-212.65, Very high chance to break out
(2) You can enter with small quantity
after confirmation( break 220) add more.

ITC GOOD STOCK FOR LONG TERM PERSPECTIVEITC now at good support on 200 DMA will show some movement this time.

ITC : getting ready to troll trollers.Consolidation seems to have ended and ITC is ready for next leg of upmove. Important levels mentioned on chart.

My view on ITCITC forming inverse Head & Shoulder Pattern.Above 114.50 should go118-120++ in very short term.Keeping on Radar ITC 115 CE.

itc has given a breakoutitc can be bought for target 214 and 220 , stoploss 204. stock has very low movement but its direction is upward


#ITC #MemesTo all the lovers and haters of #ITC. Just sharing what charts are showing.
Triangle pattern formation on monthly charts and its very close to breakout or breakdown. Probability of a breakdown is low since the markets are in up trend. #Iamjustsaying #Itwasntme.
I have parked my FD money in this, so I have no worries of its future course.

ITC Next week target - 210 -211....SL 203Since last 8 days ITC closing RED....But today's volumes are bit convincing especially last 30mins candle....
My next week target for ITC is 210 - 211....If it sustain at least 2 days then easily we can see 218 - 220 in a week....

ITCITC .. price in triangle phase i just combined with harmonic . if u get a breakout go for buy (breakout point mentioned) till harmonic d point. the sell at harmonic d

ITC LONG TARGETSITC Short Term Analysis With Stop Loss AND Targets
STOP LOSS- 190
TARGET - 222
TARGET - 251
TARGET - 279
