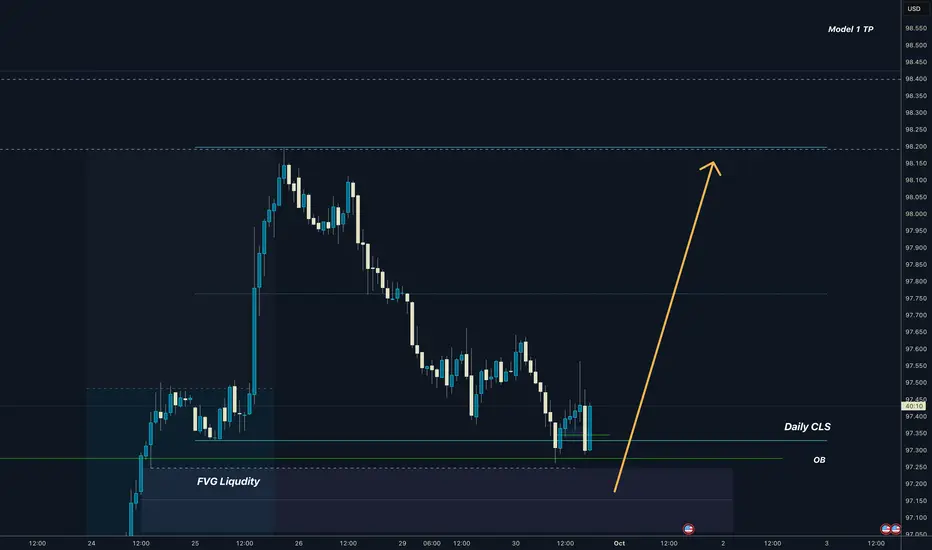
Dollar I Daily CLS I Manipulation I Bullish HTFDollar just manipulated Daily CLS range while HTF bias is nicely bullish
Im still open to the dip to FVG before it goes higher
Big picture view
Adapt useful , Reject useless add what is specifically your own.
Trade safely
Dave
About U.S. Dollar Index
The U.S. Dollar Index tracks the strength of the dollar against a basket of major currencies. DXY was originally developed by the U.S. Federal Reserve in 1973 to provide an external bilateral trade-weighted average value of the U.S. dollar against global currencies. U.S. Dollar Index goes up when the U.S. dollar gains "strength" (value), compared to other currencies. The following six currencies are used to calculate the index:
Euro (EUR) 57.6% weight
Japanese yen (JPY) 13.6% weight
Pound sterling (GBP) 11.9% weight
Canadian dollar (CAD) 9.1% weight
Swedish krona (SEK) 4.2% weight
Swiss franc (CHF) 3.6% weight
Euro (EUR) 57.6% weight
Japanese yen (JPY) 13.6% weight
Pound sterling (GBP) 11.9% weight
Canadian dollar (CAD) 9.1% weight
Swedish krona (SEK) 4.2% weight
Swiss franc (CHF) 3.6% weight
Related indices
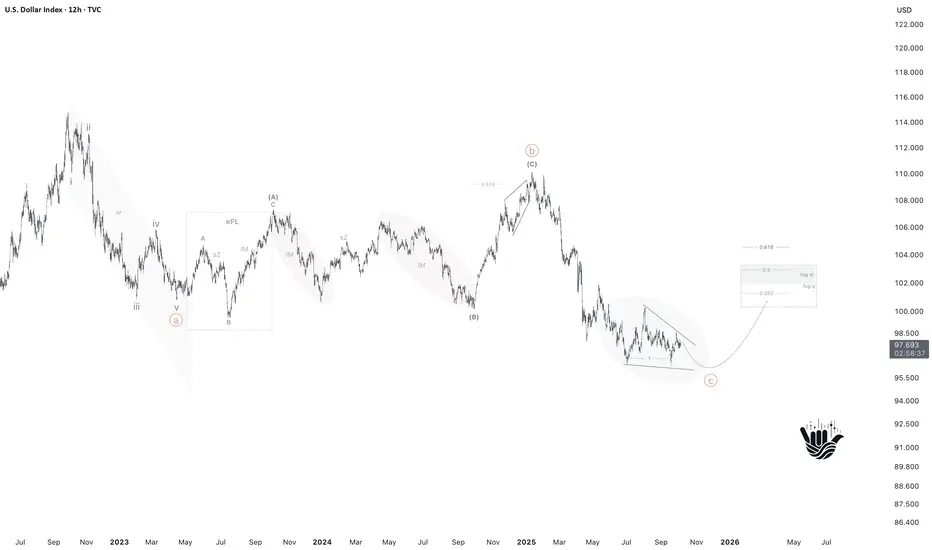
DXY: Last Dip Before Lift-Off?Previous roadmap played out well — time to refresh the view.
Global (1W)
TVC:DXY remains in an uptrend. Since 2008 we’ve built a textbook five-wave impulse.
Since 2022/2023 that impulse has been in correction — base read: a single zigzag (SimpleZ).
Base case: correction completes → tren
01.10.25 Morning ForecastPairs on Watch -
FX:USDJPY
FX:EURAUD
FX:GBPAUD
A short overview of the instruments I am looking at for today, multi-timeframe analysis down to what I will be looking at for an entry. Enjoy!

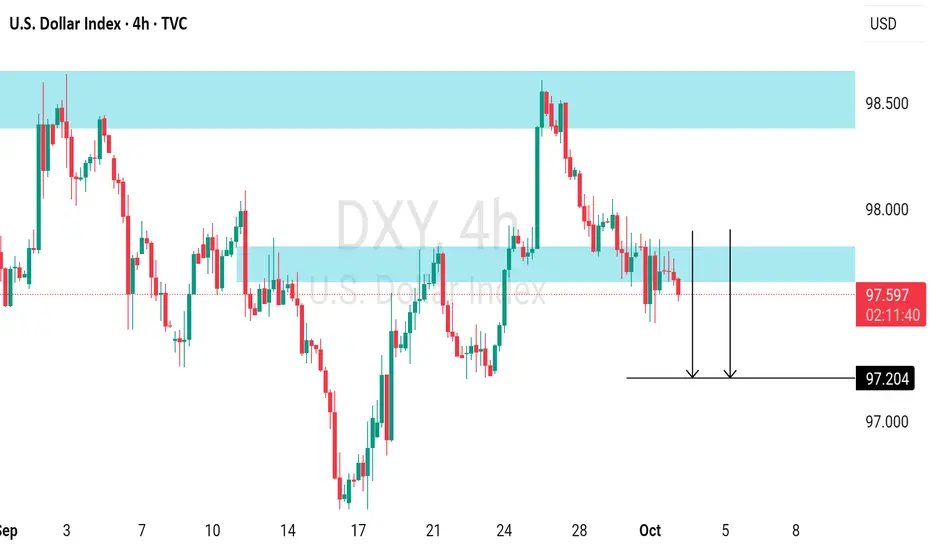
DOLLAR INDEX(DXY) : Bearish Outlook Explained The recent violation of horizontal daily support on the 📉DXY presents a reliable bearish signal.
This indicates a mid-term trend favoring sellers.
It is anticipated that the price may decline to the 97.20 support level in the near future.
DXY outlook from 29th sept to 3rd oct 2025The DXY has shown signs of longs even when the FED cut rates. the last quarter may actually be bullish for the US dollar.
it has been forming large buy candles on the daily timeframe in the previous week. this may not be a sign that we are bullish but also the market has failed to close below the F

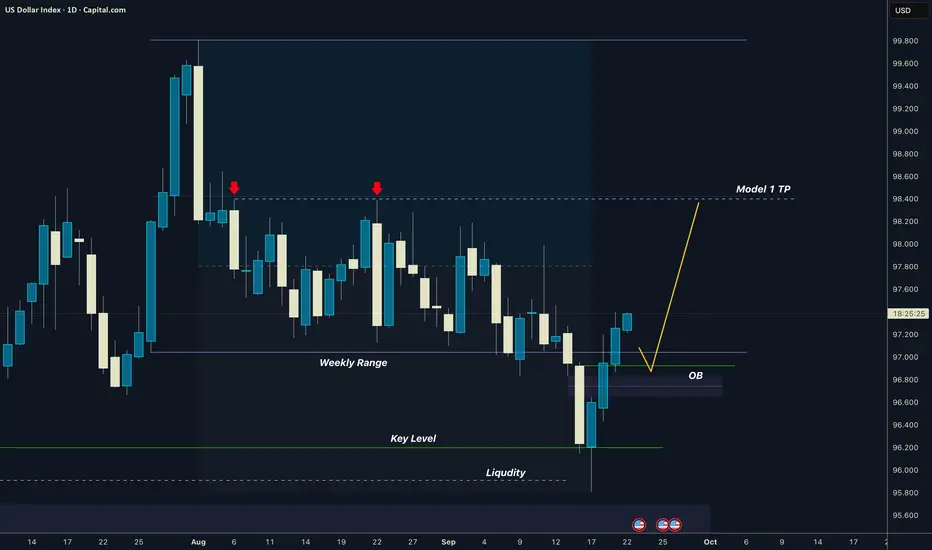
Dollar I Weekly Range I 50% Target I Model 1GM Traders, we have seen price has been accumulating thru the whole august, now it dipped bellow the range and strongly rejected and created OB. It has change to to go to 50% of that range where is doouble top liquidity which.
Have a great trading week !!
David Perk aka Dave FX Hunter
DXY Technical & Order Flow AnalysisOur analysis is based on a multi-timeframe top-down approach and fundamental analysis.
Based on our assessment, the price is expected to return to the monthly level.
DISCLAIMER: This analysis may change at any time without notice and is solely intended to assist traders in making independent inve

BUY US Dollar! Sell xxxUSD Pairs! Buy USDxxx Pairs!This is the FOREX futures outlook for the Sept 30th.
In this video, we will analyze the following FX markets:
USD Index, EUR, GBP, AUD, NZD, CAD, CHF, and JPY.
Keep it simple! Buy USDxxx pairs. Sell xxxUSD pairs. Just wait for valid setups. Once price shows a valid change in the state of deliv

U.S Dollar Index (DXY) Bullish Reversal Setup – Targeting 98.913Previous Trend:
There was a strong upward move, forming a rising channel (highlighted in pink).
Price reached the upper boundary of the channel and then reversed downward.
Current Price Action:
Price broke below the midline of the channel and is approaching a potential support zone.
This zone i

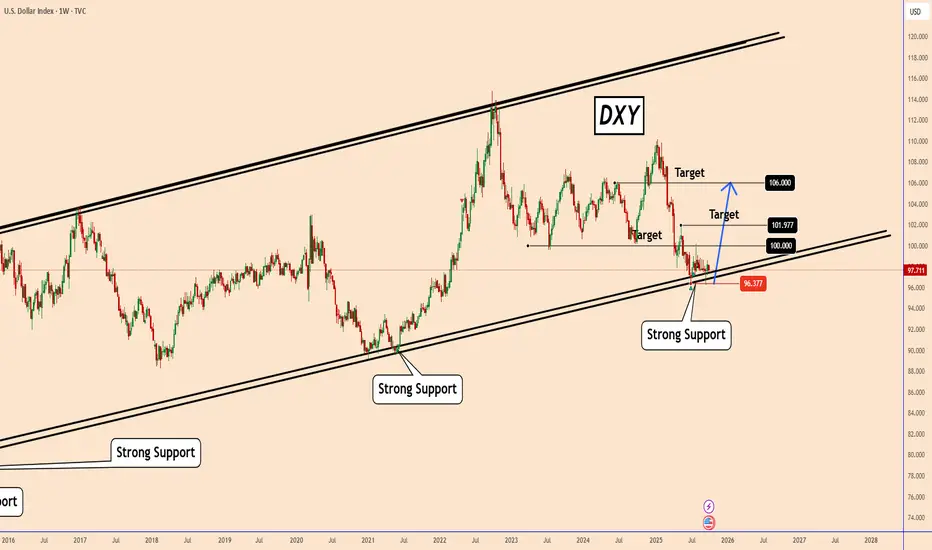
DXY (US Dollar Index): Seen in a Weekly Chart PerspectiveDXY (US Dollar Index): Seen in a Weekly Chart Perspective
The chart shows DXY is sitting on a long-term ascending support line that has held multiple times since 2015. Price recently tested this support again near 96.37, making it a key level.
Price is around 97.70, close to support. This zone is
See all ideas
Summarizing what the indicators are suggesting.
Oscillators
Neutral
SellBuy
Strong sellStrong buy
Strong sellSellNeutralBuyStrong buy
Oscillators
Neutral
SellBuy
Strong sellStrong buy
Strong sellSellNeutralBuyStrong buy
Summary
Neutral
SellBuy
Strong sellStrong buy
Strong sellSellNeutralBuyStrong buy
Summary
Neutral
SellBuy
Strong sellStrong buy
Strong sellSellNeutralBuyStrong buy
Summary
Neutral
SellBuy
Strong sellStrong buy
Strong sellSellNeutralBuyStrong buy
Moving Averages
Neutral
SellBuy
Strong sellStrong buy
Strong sellSellNeutralBuyStrong buy
Moving Averages
Neutral
SellBuy
Strong sellStrong buy
Strong sellSellNeutralBuyStrong buy
Displays a symbol's price movements over previous years to identify recurring trends.
Frequently Asked Questions
The current value of U.S. Dollar Index is 98.106 USD — it has fallen by −0.15% in the past 24 hours. Track the index more closely on the U.S. Dollar Index chart.
U.S. Dollar Index reached its highest quote on Feb 25, 1985 — 164.720 USD. See more data on the U.S. Dollar Index chart.
The lowest ever quote of U.S. Dollar Index is 70.698 USD. It was reached on Mar 17, 2008. See more data on the U.S. Dollar Index chart.
U.S. Dollar Index value has decreased by −0.80% in the past week, since last month it has shown a −0.45% decrease, and over the year it's decreased by −3.73%. Keep track of all changes on the U.S. Dollar Index chart.
U.S. Dollar Index is just a number that lets you track performance of the instruments comprising the index, so you can't invest in it directly. But you can buy U.S. Dollar Index futures or funds or invest in its components.