TLDR: SELL Gold, BUY OilGold/oil ratio seems to be evolving in a band. We've had RSI divergences every time we touched the band predicting trend reversal. RSI Divergence playing out right now as we touch the seemingly relevant support.
- FX_IDC:USDWTI / FRED:WM2NS is at an all time low support level (1998, 2016, 2020
About CFDs on WTI Crude Oil
Crude Oil is a naturally occurring liquid fossil fuel resulting from plants and animals buried underground and exposed to extreme heat and pressure. Crude oil is one of the most demanded commodities and prices have significantly increased in recent times. Two major benchmarks for pricing crude oil are the United States' WTI (West Texas Intermediate) and United Kingdom's Brent. The differences between WTI and Brent include not only price but oil type as well, with WTI producing crude oil with a different density and sulfur content. The demand for crude oil is dependent on global economic conditions as well as market speculation. Crude oil prices are commonly measured in USD. Although there have been discussions of replacing the USD with another trade currency for crude oil, no definitive actions have been taken.

Hellena | Oil (4H): SHORT to support area of 56-57.Colleagues, price is actively moving in a downward direction and I believe the move is not yet complete.
Earlier I saw this move as a big correction, but now the structure is more of an impulsive one. This means that the price is moving in the wave “3” of the higher order (Red), which should be com

USOIL formed descending flag pattern short ? Act accordinglyUSOil has formed descending flag pattern and price may go down to say around 56 incase of breakdown of support.
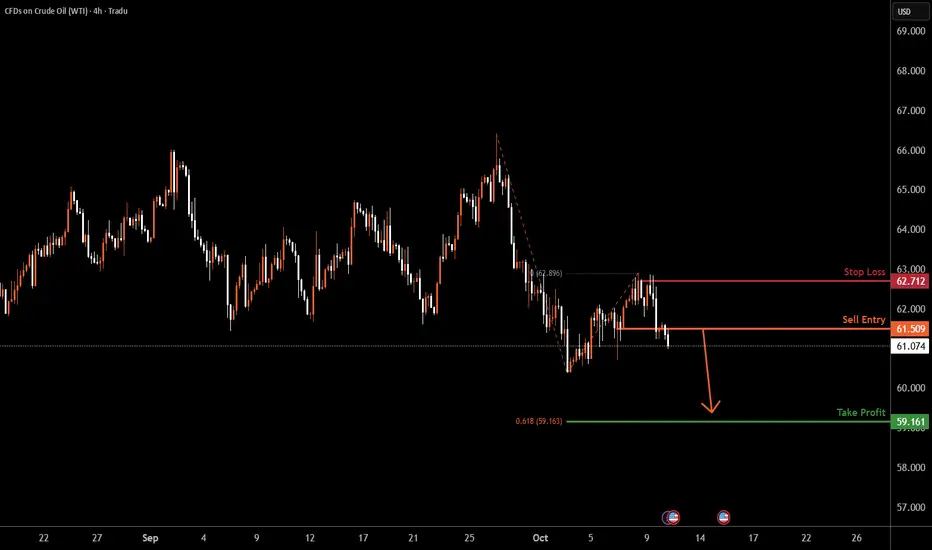
USOIL H4 | Bearish Drop OffUSOIL is reacting off the sell entry, which is a pullback resistance and could drop from this level to the downside.
Sell entry is at 61.50, which is a pullback resistance.
Stop loss is at 62.71, which is a pullback resistance.
Take profit is at 59.16, which lines up with the 161.8% Fibonacci ext
Heading into 50% Fibonacci resistance?WTI Oil (XTI/USD) is rising towards the pivot which is a pullback resistance that aligns with the 50% Fibonacci retracement and could reverse to the 1st support.
Pivot: 60.56
1st Support: 57.68
1st Resistance: 62.10
Disclaimer:
The above opinions given constitute general market commentary, and d

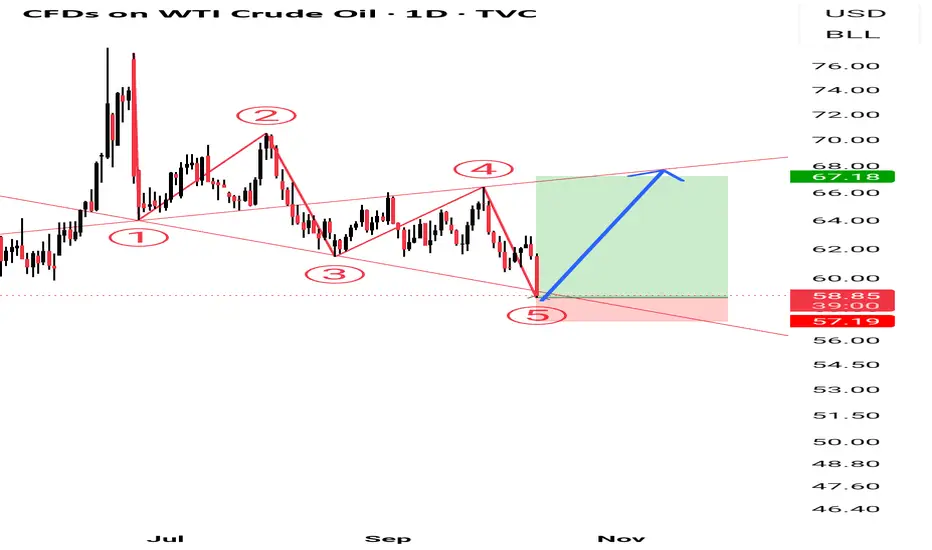
US Oil wolfwaveMy idea us oil wolfwave pattren use small trade with SL big profit
If hit SL buy again trend line up side break same SL
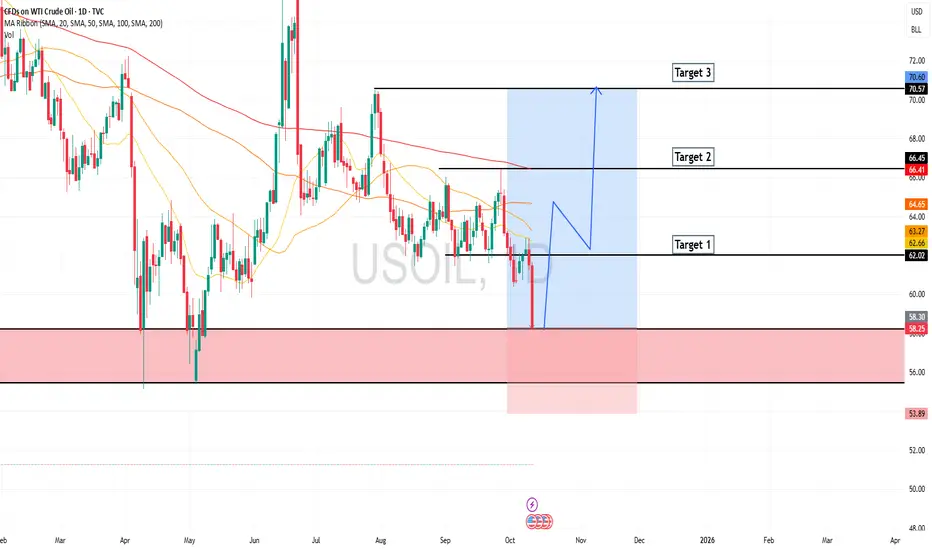
The US-Oil will jump from the historic Support LevelHello Traders
In This Chart US-OIL HOURLY Forex Forecast By FOREX PLANET
today US-OIL analysis 👆
🟢This Chart includes_ (US-OIL market update)
🟢What is The Next Opportunity on US-OIL Market
🟢how to Enter to the Valid Entry With Assurance Profit
This CHART is For Trader's that Want to Improve Their
WTI (Crude Oil) — Bullish Bat in ProgressOANDA:WTICOUSD
A bullish Bat pattern is currently forming, with a potential completion near $57.86 — the 88.6% Fibonacci retracement of the prior leg.
If the pattern confirms, it could trigger a bullish move toward $65.70, aligning with the 38.2% retracement level.
Price action around $57–58 w

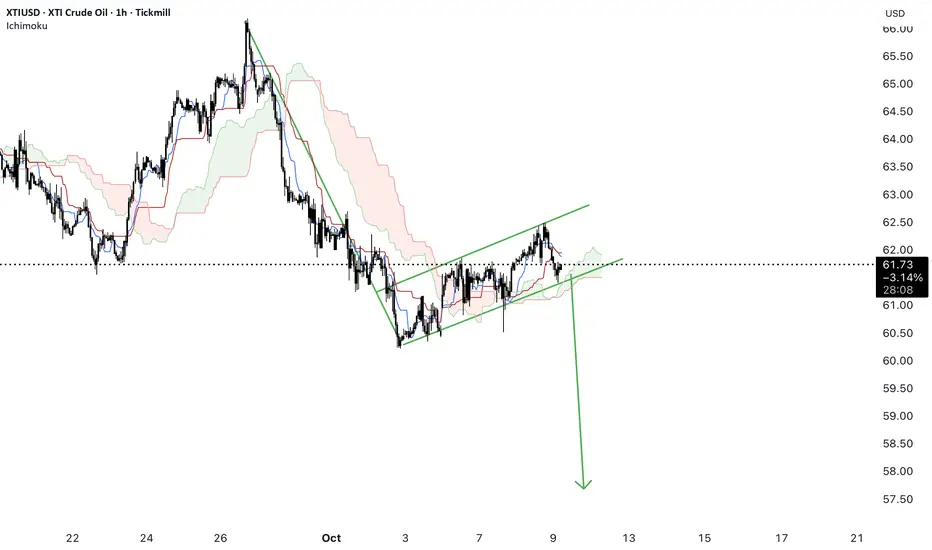
XTIUSD possible pullback set up Long The oil price fallen drastically and now price has crossed the trendline but has not crossed the cloud , price within the cloud and possibly may break resistance . Since it’s at support you can buy with very small stop loss .

XTI/USD Chart Analysis: Oil Price Falls Below $60XTI/USD Chart Analysis: Oil Price Falls Below $60
Friday’s comments from President Trump about the potential introduction of 100% tariffs on trade with China pushed WTI crude oil below the $60 level for the first time in four months. The bearish sentiment stemmed from fears of a global economic sl

See all ideas
Displays a symbol's price movements over previous years to identify recurring trends.