GER40 Intraday Technical AnalysisGER40 Intraday Technical Analysis - 10 Nov 2025
DAX 40 trades at 23,866 (12:25 PM UTC+4) with momentum compressing ahead of Europe close.
Market Context: Wyckoff distribution after vertical rally; Dow Theory shows secondary correction forming; Gann 1x1 angle rests at 23,820.
Daily/4H: 1D spinning top at 23,900 with RSI divergence; 4H broadening wedge between 23,780 support and 23,940 resistance.
1H/30M: 1H forming head-and-shoulders neckline 23,820; 30M Bollinger squeeze plus VWAP flattening signals breakout risk.
15M/5M: 15M descending triangle; 5M falling wedge testing 23,840; Ichimoku Tenkan23,940 with volume +20%; SL 23,880; TP 24,040.
Breakdown Short: 1H close <23,760; SL 23,820; TP 23,640.
Key Levels: Resistance 23,900/23,940/24,040. Support 23,780/23,760/23,640.
Indicators: RSI divergence (4H), BB squeeze (30M), anchored VWAP 23,800, EMA21 flattening, Ichimoku cloud turning neutral.
Risk Notes: Watch for bull trap above 23,940; ECB speakers 14:00 UTC elevate volatility; risk ≤1% per setup.
Educational analysis only; follow your trading plan and manage risk.
Trade ideas

#DAX at a record ALL TIME HIGHand Yet this move is far from over
My final log target is still 8000 points away.
We are witnessing #Fiat melt away in front of our eyes.
Are you actually making money is the real question?
#gold #silver #bitcoin

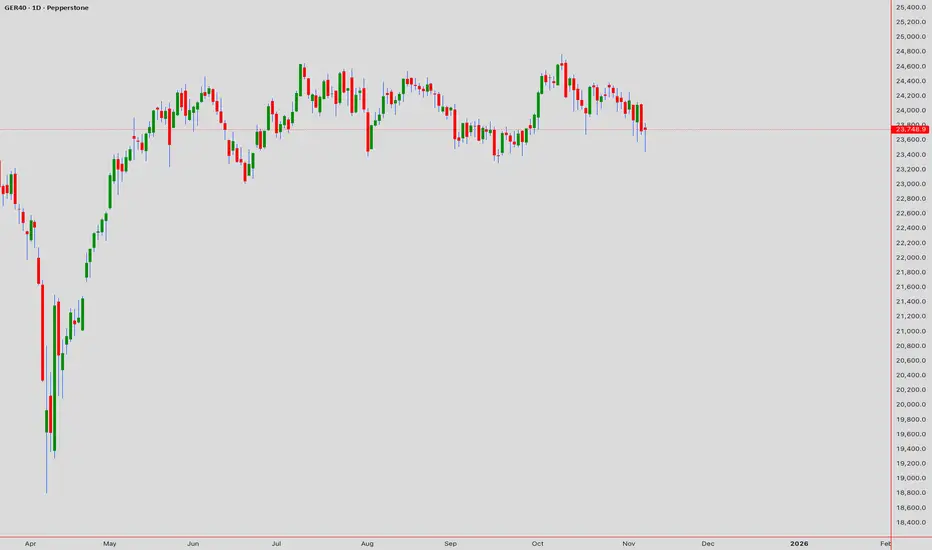
GER40 (DAX INDEX) TECHNICAL ANALYSIS# 📊 GER40 (DAX INDEX) TECHNICAL ANALYSIS 🎯
## Week of November 10-14, 2025 | Intraday & Swing Trade Mastery
Close Price: 23,748.9 Points | Entry Point: November 8, 2025, 12:54 AM UTC+4 📈
## 🔍 EXECUTIVE SUMMARY - MULTI-TIMEFRAME PERSPECTIVE
The DAX (GER40) is trading at a pivotal technical juncture with multi-timeframe alignment suggesting imminent breakout potential. Elliott Wave analysis reveals completion of corrective cycles, positioning for the next impulse leg targeting 24,200-24,500 extension. Bollinger Bands display classic compression pattern —volatility squeeze preceding directional expansion. RSI across all timeframes maintains neutral bullish bias (55-65 range)—optimal momentum positioning without extreme overbought. Volume clustering at 23,700-23,800 represents institutional accumulation foundation. Wyckoff spring tests near 23,500 provide aggressive entry triggers. Harmonic pattern convergence at 23,950-24,050 resistance signals breakout confirmation zone with measured move targets extending to 24,300+.
## 📊 TIMEFRAME-BY-TIMEFRAME ANALYSIS
### 5-MINUTE (Scalping Execution) ⚡
Candlestick Formation: Japanese candles reveal micro-consolidation breakout attempts with successive hammer/engulfing patterns at support zones. Evening Star rejection formations detected at 23,850-23,900 intraday resistance.
Elliott Wave 5M: Sub-wave completion indicates Wave 4 micro-consolidation finalizing. Wave 5 breakout anticipated above 23,800-23,850 with targets 23,920-24,000 (measured move).
Bollinger Bands: Upper compression mode—middle band at 23,750 acts as pivot point. Lower band rejection (23,680-23,710) creates scalp-long setups. Squeeze breakout targets 23,900+ on volume.
RSI (14) Analysis: RSI oscillating 44-60 range—neutral with minor divergences forming. Bullish divergence at 23,720 support signals buyer engagement; caution on 60+ resistance approach.
Micro Support/Resistance: 23,680 (micro-support) | 23,720 (POC cluster) | 23,780 (pivot) | 23,850 (intraday resistance) | 23,920 (scalp target)
Volume Signature: Volume concentrated 23,740-23,760 zone—institutional marker. Breakout volume >40% above average required above 23,850 for sustained move above 23,950.
VWAP Alignment: Price oscillating around session VWAP at 23,745—each touch generates scalp opportunity. Upper VWAP band at 23,880; lower support at 23,680.
### 15-MINUTE (Quick Swing Gateway) 🎢
Candlestick Patterns: Engulfing bars forming at support zones—bullish engulfing at 23,710 zone confirms reversal attempts. Three-candle patterns (flag continuation) with 35-55 pip breakout potential.
Harmonic Pattern Recognition: Gartley Pattern potential completion near 23,700-23,750 PRZ (Potential Reversal Zone). Exceptional risk-reward at 1:3.2 for harmonic traders. Butterfly variant also forming at secondary levels.
Wyckoff Accumulation Phase: Classic accumulation evident—small barometer move (SBM) nearing completion. Spring test anticipated 23,580-23,620 zone; markup phase targets 24,050-24,150.
Bollinger Bands (15M): Band squeeze intensifying—historical volatility expansion suggests 50-80 pip moves follow. Upper band resistance at 23,920; lower band support at 23,620.
Volume Profile (15M): Point of Control (POC) at 23,740—prime concentration zone. Volume surge >50% required confirming breakout above 23,900. Imbalances favor upside probability.
Ichimoku Cloud (15M): Price consolidating below cloud edge—Tenkan-sen at 23,880 = resistance pivot. Kijun-sen (23,820) = critical secondary support. Cloud support 23,650-23,700.
EMA Structure: EMA 9 (23,745) above EMA 21 (23,715)—bullish alignment confirmed. Price remaining above both = intraday strength maintained.
### 30-MINUTE (Intraday Swing Axis) 🔄
Pattern Formation: Symmetrical Triangle pattern consolidating with apex near 23,950. Ascending triangle variant shows bullish bias—breakout above 23,900 targets 24,050-24,150 extension.
Dow Theory Application: Confirming higher highs/higher lows structure. Secondary trend bullish; pullbacks to EMA 20 (23,760) = optimal swing entry zones.
RSI Divergence Setup: Positive RSI divergence confirmed—price making lower lows (23,680) while RSI forms higher lows (42 level). Classic reversal setup targeting 23,950 minimum.
Exponential Moving Average: EMA 9 (23,760) = core support. EMA 21 (23,715) = secondary support. EMA 50 (23,600) = structural hold level. Bullish ribbon alignment intact.
Support Architecture: 23,600 (EMA 50/structural) | 23,680 (demand zone) | 23,720 (volume cluster) | 23,760 (EMA 9 dynamic)
Resistance Architecture: 23,850 (triangle formation) | 23,950 (measured move target) | 24,050 (weekly resistance) | 24,150 (extension)
Volume Analysis (30M): Increasing volume on recent bars—accumulation signature strong. Buy volume exceeding sell volume confirms institutional interest.
### 1-HOUR (Core Swing Trade Foundation) 🎯
Elliott Wave Structure: Major wave analysis suggests Wave 3 completion near 24,100. Current Wave 4 correction targets 23,750-23,850 support zone. Wave 5 impulse anticipated—target: 24,300-24,450.
Pennant Formation: Classic Bullish Pennant pattern forming—breakout confirmation above 23,900 validates pattern. Pole height measured move = 24,200+ target.
Bollinger Bands (1H): Upper band at 24,050 = squeeze breakout target. Middle band (23,900) = bullish support. Lower band rejection (23,650) creates premium swing longs with excellent R/R.
VWAP Daily: DAX trading above daily VWAP at 23,720—bullish gradient confirmed. Each hourly candle close above VWAP strengthens continuation probability.
Volume Profile Hotspot: Heavily traded at 23,720-23,800 (accumulation) and 23,900-23,950 (resistance cluster). Imbalances above 24,000 suggest vacuum-fill potential.
Ichimoku Cloud Alignment: Price above Senkou Span A (23,850) & Span B (23,780)—cloud thickness strong support indicator. Chikou Span above candles = bullish confirmation. Cloud color: BULLISH GREEN.
Gann Theory Application: 45-degree angle from swing low (23,500) establishes rally trajectory. Resistance at 38.2% Fibonacci extension (23,950) precedes aggressive breakout phase.
Support Tiers 1H: 23,600 (structural hold) | 23,700 (EMA support) | 23,750 (Kijun-sen) | 23,800 (accumulation zone)
Resistance Tiers 1H: 23,900 (breakout trigger) | 23,950 (extension) | 24,050 (major level) | 24,150 (impulse target)
### 4-HOUR (Swing Trade Thesis Foundation) 💼
Inverse Head & Shoulders Pattern: Potential IH&S formation completing—left shoulder (23,450), head (23,350), right shoulder completing (23,550-23,650). Neckline breakout at 23,900 targets 24,100-24,250 extension.
Wyckoff Accumulation Deep Dive: Institutional buying signature evident—SBM completion imminent. Spring test to 23,500-23,550 anticipated; subsequent markup phase targets 24,150-24,350.
RSI 4H Analysis: RSI at 58-68 range—bullish bias maintained. Room for upside extension without extreme overbought. RSI above 75 targets 24,200+; below 35 = defensive posture required.
Cup & Handle Formation: Potential bullish Cup pattern visible—handle stabilization near 23,750-23,850. Breakout above handle (23,950) targets cup depth extension = 24,150-24,250.
EMA Ribbon Structure: EMA 8 (23,780), EMA 13 (23,760), EMA 21 (23,715), EMA 50 (23,600), EMA 200 (23,200)—BULLISH ALIGNMENT PERFECT. Compression/expansion cycles identify momentum phases.
Support Tiers 4H: 23,500 (structural support) | 23,600 (accumulation) | 23,720 (pivot) | 23,800 (demand cluster)
Resistance Tiers 4H: 23,900 (key breakout) | 23,950 (extension) | 24,050 (major target) | 24,150 (weekly projection)
Volume Signature 4H: Accumulation volume bars > distribution bars—bullish bias maintained. Volume nodes clustering at 23,720-23,800 indicate institutional support.
### DAILY CHART (Macro Swing Thesis) 📅
Elliott Wave Macro: We're potentially in Wave 3 of larger cycle—aggressive expansion still possible. Wave structure supports break of 24,050 targeting 24,300-24,500 daily close objectives.
Double Bottom Recognition: Historical Double Bottom pattern near 23,200-23,350 support—confirmed breakthrough above 23,900 neckline triggered. Second target near 24,200-24,300.
Bollinger Bands Daily: Upper band at 24,300 = realistic daily target. Mean (23,950) = healthy pullback support. Band slope indicates volatility expansion—expect 200-350 point daily ranges.
Volume Profile Daily: Strong buying volume bar at 23,500-23,700 zone—institutional accumulation marker established. Selling volume decreasing significantly—demand controls trend.
Ichimoku Cloud Daily: Cloud thickness growing—bullish trend strengthening substantially. Cloud support around 23,700-23,850 zone. Kumo breakout anticipated—targets cloud top at 24,000-24,100.
Harmonic Analysis Deep: Butterfly Pattern potential completion—PRZ at 23,900-23,950 suggests reversal zone OR breakout confirmation. Confluence amplifies probability of extension.
Gann Angles & Fibonacci: 50% retracement (23,600) + 61.8% extension (24,100) = key reversal zones. Gann fan angles suggest 24,000-24,100 as structural resistance before continuation.
Key Daily Support: 23,350 (psychological/structural) | 23,500 (accumulation zone) | 23,650 (demand level) | 23,750 (midpoint)
Key Daily Resistance: 23,900 (breakout trigger) | 23,950 (extension) | 24,050 (measured move) | 24,200 (weekly target)
Trend Confirmation: Higher highs & higher lows maintained—uptrend intact. Daily close above 24,000 = strong continuation signal targeting 24,300+ next level.
## 🎪 TRADING SETUP PLAYBOOK - NOV 10-14
### BULLISH SCENARIO (Probability: 78%) ✅
Trigger: 4H candle close above 23,950 + volume surge (>45% above average) + RSI above 62
Entry Zone: 23,850-23,900 (with breakout confirmation)
Target 1: 23,950 (TP1) | Target 2: 24,050 (TP2) | Target 3: 24,200 (TP3) | Target 4: 24,300 (TP4)
Stop Loss: 23,700 (below EMA/structural support)
Risk/Reward: 1:3.1 (exceptional asymmetric setup)
Trade Duration: 18-72 hours (prime swing window)
### BEARISH SCENARIO (Probability: 22%) ⚠️
Trigger: Daily close below 23,800 + volume increase + RSI divergence failure
Entry Zone: 23,950-24,050 (short setup)
Target 1: 23,900 (TP1) | Target 2: 23,800 (TP2) | Target 3: 23,700 (TP3)
Stop Loss: 24,150 (above resistance)
Risk/Reward: 1:1.6 (acceptable but lower probability)
Trade Duration: Watch for trend reversal confirmation first
## ⚠️ VOLATILITY & OVERBOUGHT/OVERSOLD CONDITIONS
Current Volatility Status: Moderate compression → Expect significant expansion imminent
5M/15M RSI: 44-60 range (neutral)—room for 20-40 point movements | Scalp target zones
30M/1H RSI: 52-68 range (bullish bias, safe zone)—sweet spot for swing entries
4H RSI: 58-72 range—approaching caution zone but room to extend | Safe for core swings
Daily RSI: 62-75 range (approaching extremes)—be defensive if daily RSI>78 | Take profits aggressively
Overbought Recognition Points:
RSI daily >77 combined with upper Bollinger Band rejection = immediate profit-taking
Ichimoku cloud top penetration fails (bearish candle rejection) = trend exhaustion signal
Volume declining on breakout attempt = false breakout warning signal
Harmonic pattern PRZ exact hit without follow-through = reversal likely imminent
Oversold Bounce Setups:
RSI 1H <32 on support touch = high-probability bounce back to 23,900-23,950
Price below EMA 50 (23,600) + RSI <30 = aggressive accumulation zone
Spring test below 23,550 with volume surge = Wyckoff spring reversal trigger
Harmonic pattern PRZ support bounce = measured move extension targets activated
## 🎯 ENTRY & EXIT OPTIMIZATION STRATEGY
### OPTIMAL ENTRY TIMING
For Scalpers (5M): RSI bounce from 42-48 zone after Band lower touch = 15-25 point scalp (1-3 min holds)
For Quick Swings (15M-30M): 15M candle close above 23,850 with 4H alignment = 80-120 point swing (30 min-2 hour holds)
For Core Swings (1H-4H): 4H pennant breakout above 23,950 on volume = 200-350+ point target (hold 12-48 hours)
For Position Swings (Daily): Daily close above 24,050 = continuation play targeting 24,200-24,300 (hold 5-7 days)
Best Entry Windows: Frankfurt open (7:00 CET), London open (8:00 CET), NY open (14:30 CET)
### EXIT STRATEGIES & PROFIT TAKING
Take Profit Levels: TP1: Fibonacci 38.2% (23,950) | TP2: Harmonic PRZ (24,000) | TP3: Daily Band upper (24,150) | TP4: Weekly target (24,300)
Stop Loss Placement: Always below most recent swing low + 15 points (strict risk management priority)
Trailing Stops: Activate at TP2—trail with 35-45 point buffer for 4H+ trades (lock in profits)
Breakeven Exit: Move stops to entry after 1:1 risk/reward achieved—eliminate emotional trading
Partial Profit Strategy: Close 25% at TP1 | 25% at TP2 | 25% at TP3 | Let 25% run to TP4 (maximize winners)
## 🔔 REVERSAL & BREAKOUT RECOGNITION CHECKLIST
### REVERSAL SIGNALS TO MONITOR:
RSI positive divergence (lower price lows, higher RSI lows) = bullish reversal setup high probability
Candlestick engulfing patterns at support/resistance zones = trend reversal confirmation strong signal
Volume profile breakdowns (declining volume on breakout attempts) = false move warning immediate
Ichimoku Cloud rejection (price fails to penetrate cloud layer) = structural resistance confirmed
Harmonic pattern completion at exact PRZ = reversal zone probability increases significantly
Elliott Wave 5th wave failure (truncation) = impulse completion = reversal imminent trigger
Gann angle break through significant angle = trend line break = reversal trigger activated
### BREAKOUT CONFIRMATION RULES:
Close beyond resistance with >40% volume surge above average = confirmed breakout signal strong
RSI crosses above 60 for bullish breakout, below 45 for bearish breakout confirmation
VWAP alignment with directional move = institutional participation confirmation strong
Bollinger Band breakout with band expansion (squeeze release) = volatility expansion confirmed immediate
Multiple timeframe confluence (5M + 15M + 1H + 4H aligned) = highest probability setup attainable
Ichimoku Cloud break (price clears all clouds with bullish candles) = strong continuation signal
Volume imbalance (ask volume > bid volume) = directional sustain likelihood increases significantly
## 💡 WEEK FORECAST SUMMARY - NOV 10-14
Monday (10th): 🌍 Consolidation continuation near 23,750-23,850 zone. Range-bound trading anticipated. Early breakout direction watch crucial. Entry setups favor reversal plays at support.
Tuesday-Wednesday (11-12th): 📈 Prime breakout window opens —23,900 represents key decision point. Expect 150-250 point daily volatility. Breakout confirmation targets 24,000-24,050 extension. This is the optimal swing trade window.
Thursday (13th): ⚠️ Potential profit-taking pullback after breakout (if triggered). Support retest of 23,950-23,850. Buying opportunity if pullback holds above 23,750.
Friday (14th): 📊 Weekly close pattern formation critical. Extension run anticipated if above 24,050. If above 24,100 = week target 24,200-24,300 achieved. End-of-week positioning for next week.
## 📍 CRITICAL CONFLUENCE ZONES - KEY TARGETS
23,500-23,550: Major support zone (accumulation marker, Wyckoff spring area, structural hold)
23,650-23,750: Secondary support (EMA 9, demand cluster, psychological level, volume POC)
23,800-23,850: Micro-resistance cluster (consolidation squeeze zone, early breakout resistance)
23,900-23,980: KEY BREAKOUT ZONE (triangle apex, harmonic confluence, all timeframe resistance)
24,000-24,100: Primary upside target (Elliott Wave 5, daily Band upper, measured move extension)
24,150-24,250: Secondary extension target (Gann level, macro resistance, wave projection)
24,300+: Weekly/monthly target (if wave 5 impulse extends beyond base projections)
## 🏆 RISK MANAGEMENT RULEBOOK
✅ 1) Position Sizing: Never risk >2% of account equity per single trade
✅ 2) Risk-Reward Ratio: Minimum 1:2.5 R/R on every entry—1:3+ preferred for swing trades
✅ 3) Profit Scaling: Close 25-50% at 1:1 ratio, let remainder run to 1:2+ targets
✅ 4) Stop Loss Discipline: Place stop IMMEDIATELY on entry—no exceptions (15-20 points tight)
✅ 5) Breakout Confirmation: Avoid FOMO—wait for candle close confirmation + volume surge always
✅ 6) Daily Support Respect: Psychological holds (round numbers 24,000) matter—trade confluence not against
✅ 7) Time Management: Exit losing trades quickly (max 1:0.5 acceptable for educational losses)
✅ 8) Macro Alignment: Always check daily/4H bias before taking 1H or lower trades
## #GER40 #DAX #DAXINDEX #TRADINGSETUP
#TECHNICALANALYSIS #ELLIOTTWAVE #HARMONICPATTERN #BREAKOUTTRADING
#SWINGTRADER #DAYTRADING #INTRADAY #INDICES #TRADINGVIEW
#BOLLINGER BANDS #RSI #ICHIMOKU #VWAP #TRADINGSTRATEGY
#WYCKOFFMETHOD #GANNTHEORY #DOWTHEORY #TECHNICALS #ANALYSIS
#SUPPORTANDRESISTANCE #VOLUMEANALYSIS #OVERBOUGHT #OVERSOLD #REVERSAL
#STOCKINDEXTRADING #GERMANYINDEX #BREAKOUTSETUP #TRADERSOFTWITTER
#TECHNICALTRADER #CANDLESTICK #PATTERRECOGNITION #CHARTANALYSIS #DAYTRADER
## 🎁 BONUS: DAILY PRE-MARKET CHECKLIST
Use this every morning before market open:
☑️ Check daily RSI (should be 60-70 for bullish bias continuation)
☑️ Identify support/resistance zones (23,700 | 23,850 | 23,950 | 24,100)
☑️ Verify 4H chart alignment (pennant/IH&S pattern status update)
☑️ Check Ichimoku cloud position (above/below = trend confirmation signal)
☑️ Review 1H Elliott Wave count (which wave are we trading exactly?)
☑️ Scan volume profile (POC = likely rejection zone area)
☑️ Set entry orders + stop losses BEFORE Frankfurt market opens
☑️ Plan 3 Take Profit levels before entering any position
☑️ Monitor economic calendar (ECB events, German data releases)
## 🌐 EUROPEAN SESSION NOTES
The DAX trades primarily during Frankfurt hours (7:00-17:30 CET) . Highest volatility typically occurs:
Frankfurt Open (7:00-8:00 CET): Initial direction breakout—watch for 50-100 point moves
London Overlap (8:00-12:00 CET): Prime trading hours —best liquidity + volatility combination
NY Open (14:30 CET): Secondary volatility surge—often confirms/reverses DAX direction
💡 Disclaimer: This technical analysis is educational only. Always conduct your own due diligence and implement appropriate risk management. Past performance does not guarantee future results. Trade responsibly within your risk tolerance. Use stop losses on every position. Not financial advice.
Analysis Created: November 8, 2025 | Valid Through: November 14, 2025 | Updated Daily
DAX40 bearish continuationThe DAX is currently trading with a bearish bias, aligned with the broader downward trend. Recent price action shows a retest of the falling resistance, suggesting a temporary relief rally within the downtrend.
Key resistance is located at 23940, a prior consolidation zone. This level will be critical in determining the next directional move.
A bearish rejection from 23940 could confirm the resumption of the downtrend, targeting the next support levels at 23600, followed by 23430 and 23285 over a longer timeframe.
Conversely, a decisive breakout and daily close above 23940 would invalidate the current bearish setup, shifting sentiment to bullish and potentially triggering a move towards 24095, then 24217.
Conclusion:
The short-term outlook remains bearish unless the price breaks and holds above 23940. Traders should watch for price action signals around this key level to confirm direction. A rejection favours fresh downside continuation, while a breakout signals a potential trend reversal or deeper correction.
This communication is for informational purposes only and should not be viewed as any form of recommendation as to a particular course of action or as investment advice. It is not intended as an offer or solicitation for the purchase or sale of any financial instrument or as an official confirmation of any transaction. Opinions, estimates and assumptions expressed herein are made as of the date of this communication and are subject to change without notice. This communication has been prepared based upon information, including market prices, data and other information, believed to be reliable; however, Trade Nation does not warrant its completeness or accuracy. All market prices and market data contained in or attached to this communication are indicative and subject to change without notice.

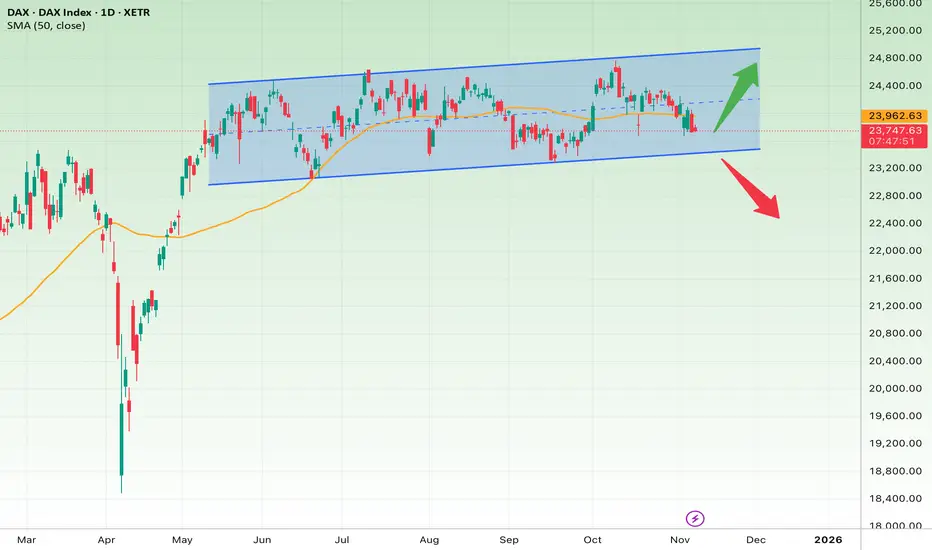
DAX 5-month Rectangle approaching the 1D MA200. Buy Signal.DAX (DE40) has been trading sideways within a large 1D Rectangle for the past 5 months. Since the October 09 High the price has been declining on a Bearish Leg that is about to test the 1D MA200 (orange trend-line) for the first time since April 09 2025, the bottom of the Tariff War.
Given that this is just above the bottom of the Rectangle, it constitutes a very strong Buy Signal. We have seen 4 Bullish Legs initiating on this level within this pattern and they all reached at least the 0.786 Fibonacci retracement level. As a result, our current Target on DAX is 24350.
Notice also how the 1D RSI has also entered its own Support Zone.
-------------------------------------------------------------------------------
** Please LIKE 👍, FOLLOW ✅, SHARE 🙌 and COMMENT ✍ if you enjoy this idea! Also share your ideas and charts in the comments section below! This is best way to keep it relevant, support us, keep the content here free and allow the idea to reach as many people as possible. **
-------------------------------------------------------------------------------
💸💸💸💸💸💸
👇 👇 👇 👇 👇 👇

DAX: Sideways at ATH, Q3 Coil → Q4 Pop?Since May the DAX has moved sideways at/near all-time highs. Q3 has been chop as expected, but momentum hasn’t broken—buyers keep defending the 23.4–23.7k shelf. I’m leaning into seasonality and prior behavior: staying long for a push into quarter-end, then I’ll reassess. Plan on scaling out into 24,500 → 24,600 → 24,700 (ATH supply), with risk tucked below the recent range floor.
Technicals
• Structure: Multi-month range at the highs; no decisive lower-low. The 4H view shows repeated rejections of a minor descending supply line while the base at ~23,6xx keeps holding.
• Entry zone: 23,620–23,720 (range support / prior VWAP shelf).
• Invalidation: daily close below 23,200–23,300 (range break).
• Targets: 24,000 (psych), 24,300 (mid-supply), 24,600 (ATH line from your chart).
• Breadth/rotation clues (dashboard): Financials firm, tech mixed, autos soft; overall market still balanced rather than risk-off—consistent with consolidation, not reversal.
• Tape feel: Repeated “muted opens” with buyers showing up later in the session fits the grind-higher playbook into month/quarter end.
Fundamentals
• Macro tone: US risk appetite improved after the Fed’s first cut, even as Powell tempered hopes of an aggressive path—enough to cap deep corrections but still supportive of equities. European desk notes point to a restrained start, not a bear impulse.
• Germany specifics: Headlines flag auto-sector warnings (VW/Porsche) weighing on sentiment, but banks and select industrials offset—matching the mixed sector board rather than broad deterioration.
• Flows/seasonality: Quarter-end & Q4 seasonality often favor indices that have consolidated at highs; with DAX still ~1k points off the record, a range breakout toward 24.3k–24.65k is a reasonable path before re-calibrating.
• Risks to thesis: Another round of negative guidance from autos, hotter-than-expected US data re-pricing fewer cuts, or a clean daily close below 23.2k (range failure).
Trade what’s on the chart, respect the invalidation, and pay yourself into strength.
Note: Please remember to adjust this trade idea according to your individual trading conditions, including position size, broker-specific price variations, and any relevant external factors. Every trader’s situation is unique, so it’s crucial to tailor your approach to your own risk tolerance and market environment.

DAX/GER30 - TIME TO FISHINGTeam,
thank for your patience, this morning i sent out 12 hours ago to enter this range.
But during the day i found a good entry so we did, in and out quickly with target hit.
NOW IS PERFECT TIME.
We are looking to enter long at 23600-23575 ranges
WITH STOP LOSS at 23540
Once it hit our entry, wait for above 23650, bring stop loss to BE
Target 1 at 23665-23685
Target 2 at 23735-23745
Target 3 at 23705-23865
SO PLEASE BE PATIENT, as soon as I can, I will update the comment.
LETS GO FISHING

DAX at the Edge – Germany’s Market Faces a Big Decision!The German DAX Index has been trading within a gentle upward channel for several months and is now testing the lower boundary of that channel around the key support zone of 23,600–23,800. This level also aligns with the 50-day moving average (SMA50), which adds extra strength to the support.
In the short term, if the index holds above 23,700 and forms a bullish reversal candle, a rebound toward 24,500–24,800 (the top of the channel) is likely. The stop loss for this bullish setup would be a confirmed breakdown below 23,400.
However, if selling pressure continues and the price closes below 23,400, it could trigger a deeper correction toward 22,800–23,000, signaling a potential trend shift in the medium term.
From a long-term perspective, as long as the DAX remains above 23,000, the broader trend stays bullish, with next major upside targets around 25,000–25,500.
In short, the current area represents the dividing line between a continuation of the uptrend and the beginning of a medium-term correction in the German market.
DAX/GER40 - LETS GO FISHINGTeam, we kill both LONG last week and this week.
Yesterday, I could have had another good short at 24083, but I failed to execute it. Apologies.
Today, we are going to learn to be patient, like going fishing and waiting for the FISH to bite.
We are looking to enter long at 23600-23575 ranges
WITH STOP LOSS at 23520
Once it hit our entry, wait for above 23650, bring stop loss to BE
Target 1 at 23665-23685
Target 2 at 23735-23745
Target 3 at 23705-23865
SO PLEASE BE PATIENT, as soon as I can, I will update the comment.
LETS GO FISHING

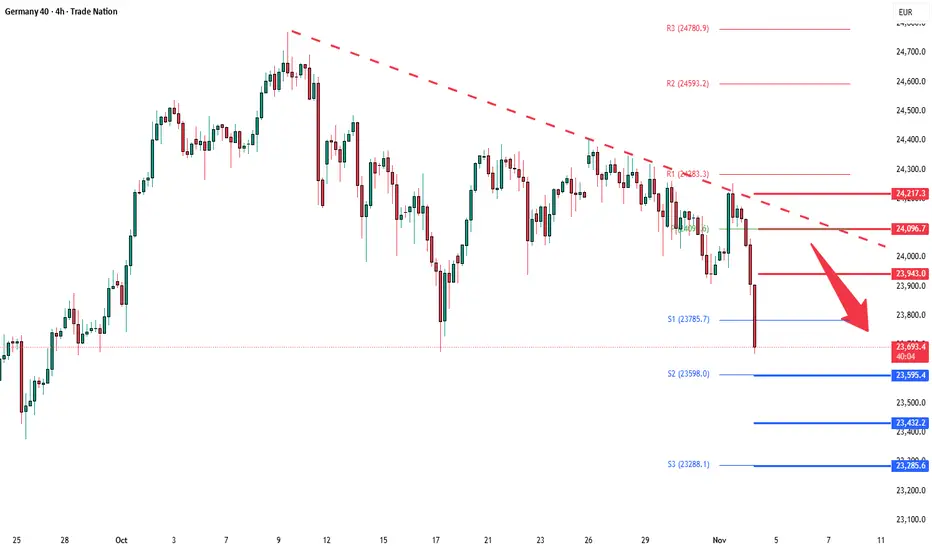
DAX falling resistance at 24095The DAX is currently trading with a bearish bias, aligned with the broader downward trend. Recent price action shows a retest of the falling resistance, suggesting a temporary relief rally within the downtrend.
Key resistance is located at 23940, a prior consolidation zone. This level will be critical in determining the next directional move.
A bearish rejection from 23940 could confirm the resumption of the downtrend, targeting the next support levels at 23600, followed by 23430 and 23285 over a longer timeframe.
Conversely, a decisive breakout and daily close above 23940 would invalidate the current bearish setup, shifting sentiment to bullish and potentially triggering a move towards 24095, then 24217.
Conclusion:
The short-term outlook remains bearish unless the price breaks and holds above 23940. Traders should watch for price action signals around this key level to confirm direction. A rejection favours fresh downside continuation, while a breakout signals a potential trend reversal or deeper correction.
This communication is for informational purposes only and should not be viewed as any form of recommendation as to a particular course of action or as investment advice. It is not intended as an offer or solicitation for the purchase or sale of any financial instrument or as an official confirmation of any transaction. Opinions, estimates and assumptions expressed herein are made as of the date of this communication and are subject to change without notice. This communication has been prepared based upon information, including market prices, data and other information, believed to be reliable; however, Trade Nation does not warrant its completeness or accuracy. All market prices and market data contained in or attached to this communication are indicative and subject to change without notice.

DAX BEARISHthe long term vision on dax is bearish as it's shown in the higher time frame , the movement is still consolidating but the overall sentiment it's bearish let's wait for a proper entry

DAX/GER - LET RIDE THE WAVE AGAINTeam, yesterday we got both targets 1 and 2 hit,
Now we are entering at 23690 and buying more at 23650 - with stop loss at 23580
Once it breaks above 23710, bring the stop loss to BE
Target 1 at 23735-65
Target 2 at 23810-45
LETS GO - LETS MAKE DAX GREAT AGAIN

Is Germany's Economic Success Just an Illusion?Germany's benchmark DAX 40 index surged 30% over the past year, creating an impression of robust economic health. However, this performance masks a troubling reality: the index represents globally diversified multinationals whose revenues originate largely outside Germany's struggling domestic market. Behind the DAX's resilience lies fundamental decay. GDP fell 0.3% in Q2 2025, industrial output reached its lowest level since May 2020, and manufacturing declined 4.8% year-over-year. The energy-intensive sector suffered even steeper contraction at 7.5%, revealing that high input costs have become a structural, long-term threat rather than a temporary challenge.
The automotive sector exemplifies Germany's deeper crisis. Once-dominant manufacturers are losing ground in the electric vehicle transition, with their European market share in China plummeting from 24% in 2020 to just 15% in 2024. Despite leading global R&D spending at €58.4 billion in 2023, German automakers remain trapped at Level 2+ autonomy while competitors pursue full self-driving solutions. This technological lag stems from stringent regulations, complex approval processes, and critical dependencies on Chinese rare earth materials, which could trigger €45-75 billion in losses and jeopardize 1.2 million jobs.
Germany's structural rigidities compound these challenges. Federal fragmentation across 16 states paralyzes digitalization efforts, with the country ranking below the EU average in digital infrastructure despite ambitious sovereignty initiatives. The nation serves as Europe's fiscal anchor, contributing €18 billion net to the EU budget in 2024, yet this burden constrains domestic investment capacity. Meanwhile, demographic pressures persist, though immigration has stabilized the workforce; highly skilled migrants disproportionately consider leaving, threatening to transform a demographic solution into brain drain. Without radical reform to streamline bureaucracy, pivot R&D toward disruptive technologies, and retain top talent, the disconnect between the DAX and Germany's foundational economy will only widen.

DAX40 corrective pullback capped at 23940 resistance The DAX is currently trading with a bearish bias, aligned with the broader downward trend. Recent price action shows a retest of the falling resistance, suggesting a temporary relief rally within the downtrend.
Key resistance is located at 23940, a prior consolidation zone. This level will be critical in determining the next directional move.
A bearish rejection from 23940 could confirm the resumption of the downtrend, targeting the next support levels at 23600, followed by 23430 and 23285 over a longer timeframe.
Conversely, a decisive breakout and daily close above 23940 would invalidate the current bearish setup, shifting sentiment to bullish and potentially triggering a move towards 24095, then 24217.
Conclusion:
The short-term outlook remains bearish unless the price breaks and holds above 23940. Traders should watch for price action signals around this key level to confirm direction. A rejection favours fresh downside continuation, while a breakout signals a potential trend reversal or deeper correction.
This communication is for informational purposes only and should not be viewed as any form of recommendation as to a particular course of action or as investment advice. It is not intended as an offer or solicitation for the purchase or sale of any financial instrument or as an official confirmation of any transaction. Opinions, estimates and assumptions expressed herein are made as of the date of this communication and are subject to change without notice. This communication has been prepared based upon information, including market prices, data and other information, believed to be reliable; however, Trade Nation does not warrant its completeness or accuracy. All market prices and market data contained in or attached to this communication are indicative and subject to change without notice.
GER/DAX30 - ARE YOU READYTeam, market is heavily sold off today
But it will recover during US Market opening
I find a good opportunity to go long DAX at 23720-35 - NOTE: it may drop low at 23700
STOP LOSS consider at 23650
Once the market hit above 23780 range bring STOP LOSS TO BREAK EVEN
Target 1 at 23785-23815 - take partial only 30%
Target 2 at 23845-85 - take another 30%
Target 3 at 23915-24015
LETS GO

Technical Analysis WeeklyGermany 40 is still stuck in a neutral range phase. Price is at 24,159, close to the VWAP of 24,150. The RSI at 50.3 suggests a totally neutral bias. Support is at 23,878, and resistance is at 24,427.
UK 100 continues in a strong bullish impulsive trend, trading at 9,732 above its VWAP of 9,532. Momentum remains strong with an RSI of 69.3, nearing overbought territory. Support is seen at 9,234 and resistance at 9,829.
Wall Street maintains its bullish trend and is still in an impulsive phase, trading at 47,643 and comfortably above the VWAP of 46,711. The RSI at 68.0 reflects strong upside pressure. Support lies at 45,359, with resistance at 48,063.
Brent Crude is still bearish overall, though it has entered a correction phase- and could be staging a trend reversal. Price is at 6,461, hovering above the VWAP of 6,333. RSI at 51.5 indicates a neutral stance. Support is found at 6,000, while resistance caps at 6,667.
Gold’s bullish trend has paused into a correction, now trading at 4,002, still below the VWAP of 4,104. The RSI of 49.1 reflects a cooling momentum. Support is at 3,861, with resistance at 4,104.
EUR/USD has broken down into a 3-month low but remains in an overall neutral trend, trading at 1.1515 and under its VWAP of 1.1614. The RSI at 33.1 hints at building downside momentum. Support is found at 1.1500, with resistance at 1.1710.
GBP/USD has weakened to test the bottom of its multi-month range setting up possible breakdown into a new bearish trend, currently at 1.3127 and beneath the VWAP of 1.3309. The RSI at 30.4 signals oversold conditions. Support is at 1.3106, with resistance at 1.3513.
USD/JPY continues its bullish impulsive trend, now trading at 154.13, above the VWAP of 152.19. The RSI at 66.3 shows strong upward pressure. Support lies at 149.74, with resistance at 154.64.

DAX, after tomorrow interest cuts we could open new long positiduring tomorrow we could see lots of volotility on the market and market manipulation,
-if the rates will be cutted than it should be a good long opportunity on DAX, and in generally on all the indices
-also US dollar dominance against other currencies, It's important to be very carefull that market will try to manipulate
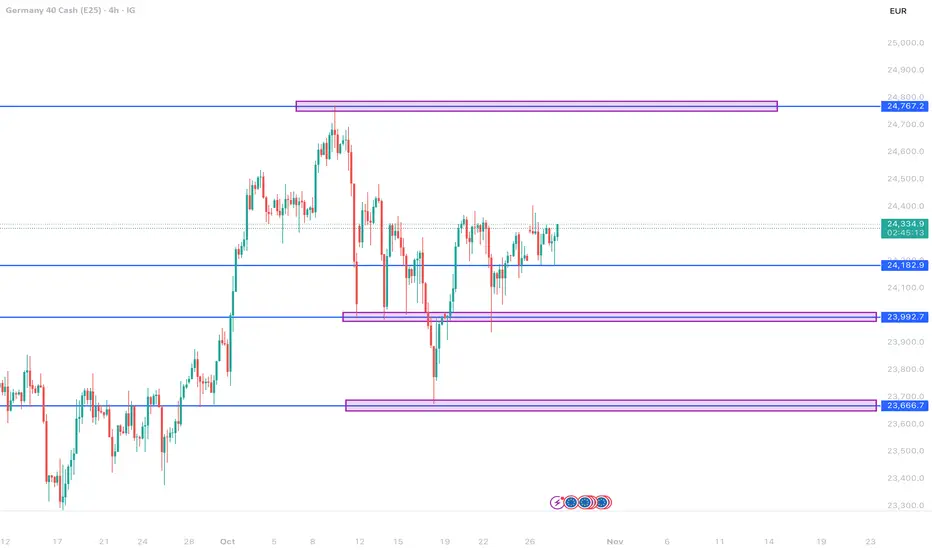

GER30 H4 | Bullish Reversal from Overlap Support LevelBased on the H4 chart analysis, we could see the price fall to the buy entry which is an overlap support and could bounce from this level to the upside.
Buy entry is at 23,885.59, which is an overlap support.
Stop loss is at 23,661.20, whic is a pullback support that is slightly above the 100% Fibonacci projection.
Take profit is at 24,383.02, which is an overlap resistance.
Stratos Markets Limited (tradu.com ):
CFDs are complex instruments and come with a high risk of losing money rapidly due to leverage. 68% of retail investor accounts lose money when trading CFDs with this provider. You should consider whether you understand how CFDs work and whether you can afford to take the high risk of losing your money.
Stratos Europe Ltd (tradu.com ):
CFDs are complex instruments and come with a high risk of losing money rapidly due to leverage. 70% of retail investor accounts lose money when trading CFDs with this provider. You should consider whether you understand how CFDs work and whether you can afford to take the high risk of losing your money.

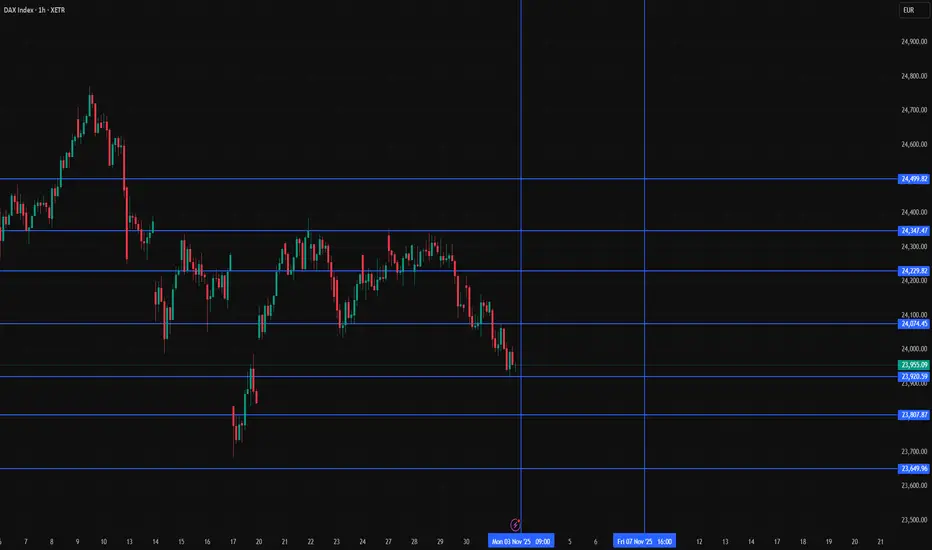
DAX weekly pivot map for 3 to 7 November 2025Why this matters
Next week is a sequence market. Final PMIs set tone. Germany prints factory orders and industrial production. The week closes with the U.S. jobs report. That mix often compresses ranges around fair value until something cracks. So the plan is one grid, two scenarios, three rules.
Chart to publish
Timeframe 1H on GER40. Add a single grid from last week Xetra cash.
High 24 348.59. Low 23 922.95. Close 23 958.30.
Pivot 24 076.61. R1 24 230.28. R2 24 502.25. R3 24 655.92.
S1 23 804.64. S2 23 650.97. S3 23 379.00.
Optional helpers. VWAP. Cumulative delta. No extra overlays. Keep it clean so the levels do the talking.
What I am watching on tape
How price behaves around the pivot during quiet periods. The first pass into R1 or S1 without a fresh release often mean reverts. If a surprise hits, the grid becomes a runway for extension. The job is not to predict. The job is to recognise when ranges are intact and when a genuine break is underway.
Catalysts and session notes
Germany releases often land near 08:00 CET. Factory orders midweek. Industrial production the day after. The U.S. Employment Situation prints Friday at 08:30 ET. That one moves global curves and the euro which feeds back into exporters. I do not hold risk through the print. I would rather enter the follow through once the first sweep finishes.
Levels that matter this week
Pivot 24 076 is the magnet. Above it the burden of proof is on sellers. Below it buyers need time to build. R1 24 230 is the first supply pocket. R2 24 502 lines up with prior supply. R3 24 656 sits just under the recent extremes. On the downside S1 23 805 is first support. S2 23 651 is where momentum sellers usually engage. S3 23 379 is the stress zone if the week turns heavy.
Two simple scenarios
Scenario A soft landing tone
PMIs steady. Orders stabilise. Production improves. Payrolls strong enough but wages calm. The tape accepts price above the pivot and north of R1. Tactics. Buy pullbacks into 24 080 to 24 120 with a hard stop under 23 980. First take-profit at R1. Trail into the 24 330 pocket. If R2 breaks on confirmation keep a runner toward 24 650 to 24 770 where supply stacked recently. The idea is to let the market pay you for being patient near the magnet then step aside if the grid stops working.
Scenario B growth scare tone
PMIs revise down. Orders miss. Production disappoints. Payrolls hot on wages. Sellers defend R1 and the euro wobbles. Tactics. Sell failed bounces close to 24 230 with a stop above 24 330. First target the pivot. Add only on a clean loss of 23 980. Manage into S2 and be pragmatic near S3 because volatility tends to spike there.
How to trade the grid
Entry
I anchor on 1H structure. I drill down to 15m for the trigger. I want acceptance around the level. That means a pause, a clean candle close, and a little confirmation from volume. Chasing the very first touch is optional and usually a worse price unless the day is a trend day.
Risk
Fixed R works. Use a small stop around the other side of the level. I like 0.5 R stops and 1.0 R first targets. On days with a data print I cut size in half or I skip the first twenty minutes. The easiest way to survive event weeks is to size for the noise and accept that some moves will run without you.
Adds and exits
Adds only after partials are banked. No martingale. I scale out at the next grid line or at VWAP if the run stalls. I do not marry a view. If the grid stops behaving I go flat and wait for the next high quality test.
Why this works
These weekly levels attract flow. Dealers manage hedges around them. When the tape is balanced the pivot acts like gravity. When the tape is imbalanced the break through R2 or S2 gives you a repeatable context to join the side that is pressing. You are not forecasting. You are responding with a simple structure.
Rules to pin on the chart
• Fade the first clean touch of R1 or S1 back to the pivot if no high impact release is due within the next hour.
• Trade breakouts only on a firm thirty minute close above R2 or below S2 with volume support and a positive delta profile.
• Stay flat into red events. Flat at least five minutes before the U.S. jobs report. Reassess after the first sweep.
Instrument
GER40 on the 1H chart. If you execute futures on Eurex or a CFD feed, tiny price differences do not change the grid. Rebuild the levels each weekend from the cash high low close so the numbers stay honest.
Mindset
The grid is a map. It tells you where to look. Your edge comes from taking the same trade the same way every time. Good process first. P and L follows.
Education only.
German DAX 30 Rally Ahead? Strong Pullback Signals Momentum💎 DE30 (German DAX 30) — Thief Trader’s Market Profit Playbook! 💎
📈 Bias: Bullish Play Confirmed
⚙️ Strategy Type: Layered Limit Order Entries (Thief’s Signature Style)
🧠 Game Plan:
The German DAX 30 (DE30) shows strong bullish momentum after a clean moving average pullback — confirming a short-term continuation setup on the 4H and daily charts.
We’re loading our Thief-style layering entries to ride this momentum wave! 🏄♂️
Layered Entry Zone (Buy Limits):
💰 23,800 | 23,900 | 24,000 | 24,100
(Add more layers if you’re managing dynamic scaling — this is the Thief style of playing smart, not hard!)
🛑 Stop Loss (Protective Zone):
🚨 23,700 (Thief’s guard line!)
⚠️ Note: Dear Ladies & Gentlemen (Thief OGs), this SL is not a must-follow — manage your risk wisely. This is an educational plan — trade at your own discretion.
🎯 Take Profit Zone:
🎯 24,500 — realistic first exit zone.
💥 24,700 — Electric Shock Resistance Wall ⚡️ (strong resistance area + overbought + potential trap zone).
⚠️ Note: Again, dear Thief OGs — take your profits when you’re happy! Targets are reference points, not financial advice.
🔍 Key Technical Highlights:
Strong MA Confluence: 20EMA and 50EMA crossover support the bullish bias.
Volume Uptick: Smart money rotation visible on hourly accumulation bars.
Momentum Recovery: RSI rebounding from mid-zone (40–50), eyeing bullish breakout potential.
🌐 Correlated Assets to Watch:
Stay sharp — DAX often dances with global indices and major USD flows:
CAPITALCOM:US30 (Dow Jones) — correlated risk sentiment, bullish tone confirmation.
FX:FRA40 (CAC 40) — follows European equity momentum.
💵 FX:EURUSD — inverse correlation with DE30 strength during USD volatility.
Tracking these helps confirm whether the bull party 🎉 continues or the market bouncer 🚫 shows up early.
✨ “If you find value in my analysis, a 👍 and 🚀 boost is much appreciated — it helps me share more setups with the community!”
#DE30 #DAX30 #ThiefTrader #IndexTrading #GermanDAX #BullishSetup #LayeredEntry #PriceAction #SmartMoney #TradingStrategy #MarketAnalysis #ThiefStyle #ForexCommunity #RiskManagement

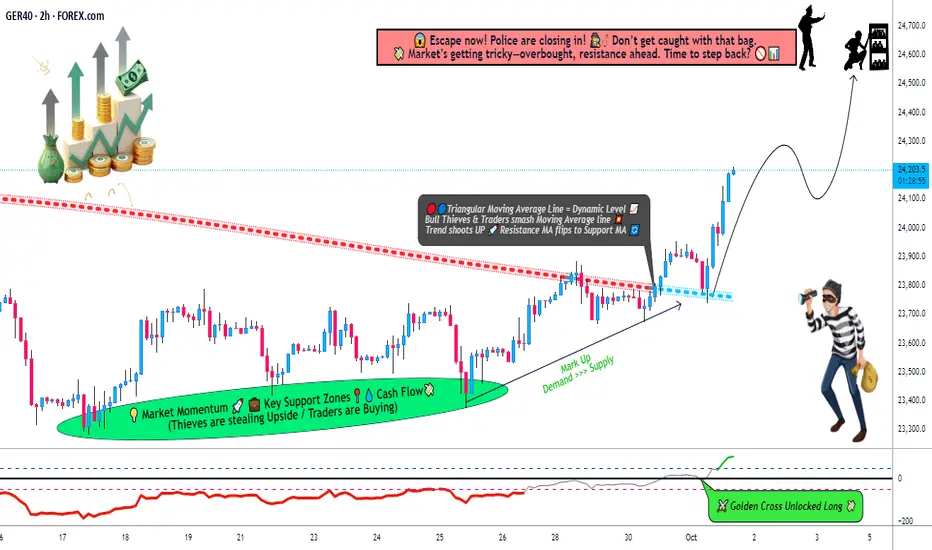
"DAX 40 Strategy Map — Multi-Layer Entries & Thief Twist"📊 GERMANY 40 Index Market Wealth Strategy Map (Swing/Day Trade)
Ladies & Gentlemen (aka Thief OG’s 😎), here’s my fresh DAX roadmap.
🔑 Plan (Bullish Bias):
Triangular Moving Average 382 broken upwards ✅
CCI Oscillator flashing a Golden Cross ⚡
Both signals together = bullish confirmation.
🎯 Entry (Thief Layer Strategy):
This is not a single-entry plan. Instead, I’m layering multiple buy-limit levels:
23800, 23900, 24000, 24100
(You can increase layers if market structure supports it.)
This layering method (Thief Strategy) spreads risk and improves average entry.
🛡️ Stop Loss (Thief Guardrail):
My SL marker: 23700
⚠️ Note: This is my personal map, not financial advice. You can adjust according to your own risk appetite.
💰 Target (Take Profit Zone):
Primary Exit: 24600
Strong barricade & resistance near 24700 🚨 (watch out for overbought trap).
Idea: escape with profits before the police (market sellers) block the road!
📌 Correlations & Watchlist:
FOREXCOM:GER40 (Germany 40 Index)
XETR:DAX (cash market ticker)
CAPITALCOM:DE40 (futures contracts)
ICMARKETS:STOXX50 (Euro Stoxx 50 correlation)
SP:SPX / NASDAQ:NDX (U.S indices often influence DAX intraday flow)
FX:EURUSD (currency correlation can impact European equities via euro strength/weakness)
Keeping an eye on global risk sentiment is essential — strong U.S. momentum often supports DAX upside.
✨ “If you find value in my analysis, a 👍 and 🚀 boost is much appreciated — it helps me share more setups with the community!”
📜 Disclaimer:
This is a Thief-style trading strategy — designed for fun, educational purposes, and market mapping only. This is not financial advice. Trade at your own risk.
#GER40 #DAX #Germany40 #SwingTrade #DayTrading #IndexTrading #TechnicalAnalysis #ThiefStrategy #TradingView
DAXHow to become successful in forex and stock trading:
1.Master fundamentals and technical analysis.
2.Build and follow a solid trading plan.
3.Apply strict risk management (4–6% rule).
4.Stay disciplined—control fear and greed.
5.Record and analyze every trade.
6.Focus on high-quality setups only.
7.Diversify across assets and markets.
8.Keep evolving—study, adapt, and grow daily.
