Possibility of uptrend It is expected that the upward trend will continue and the index will advance to the specified resistance levels. Otherwise, a correction to the support area will be possible, and then a change in the trend scenario will be likely.
Trade ideas

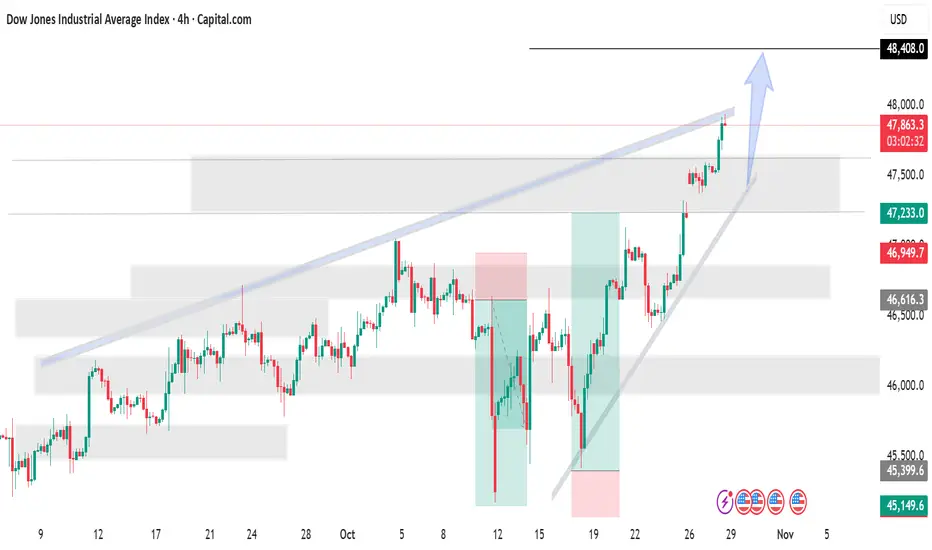
US30 ForecastThe Dow Jones Industrial Average Index is showing strong bullish momentum breaking above the ascending channel resistance. Price is holding above the 47,800 support zone and aiming toward the next key resistance near 48,400. The clear uptrend structure and breakout projection suggest further upside continuation, with buyers maintaining firm control.
"Thank you for your support! If you found this idea valuable or learned something new, please consider liking and leaving a comment. I’d really appreciate hearing your feedback and thoughts."
US30 Ready for shorts?Momentum on US30 is finally slowing. Character of price action is indicating short term shorts for a continuation of longs. Price is very overextended currently. I would have preferred a few pips in longs to major key level before sells, but current price action is hinting at shorts, and you do not want to miss it if that is the case. Waiting for my entry criteria to enter sells. Best of luck. Manage Risk!

DowJoned bullish breakout supported at 47260Key Support and Resistance Levels
Resistance Level 1: 48085
Resistance Level 2: 48255
Resistance Level 3: 48500
Support Level 1: 47260
Support Level 2: 47040
Support Level 3: 46880
This communication is for informational purposes only and should not be viewed as any form of recommendation as to a particular course of action or as investment advice. It is not intended as an offer or solicitation for the purchase or sale of any financial instrument or as an official confirmation of any transaction. Opinions, estimates and assumptions expressed herein are made as of the date of this communication and are subject to change without notice. This communication has been prepared based upon information, including market prices, data and other information, believed to be reliable; however, Trade Nation does not warrant its completeness or accuracy. All market prices and market data contained in or attached to this communication are indicative and subject to change without notice.

US30 Intraday Plan – Bullish Bias Above 47,700 - 28/10/2025US30 has been maintaining strong bullish structure with a series of higher highs and higher lows on the lower timeframes. After breaking through the 47,700 zone, price is now retesting that area — which may act as intraday support going into the U.S. session.
📊 Scenarios:
Bullish Scenario (Primary Bias)
Watch for a pullback into the 47,730–47,700 zone — this area may serve as a liquidity grab / confirmation zone before continuation.
If support holds, potential upside targets are:
TP1 → 47,850
TP2 → 47,950
TP3 → 48,000 (psychological level & round number target)
Bearish Scenario (Alternative)
If price rejects near 47,780 and fails to hold above 47,700, we could see a deeper retracement.
Downside targets in that case:
TP1 → 47,500
TP2 → 47,350–47,300
📈 Bias: Bullish above 47,700
📉 Invalidation: Sustained break below 47,600
This plan focuses on waiting for confirmation at key levels rather than chasing momentum. Watch the first 15–30 minutes after NY open for direction confirmation — expect volatility and potential fakeouts.

US30 Trade Set Up Oct 28Price is trading above PDH and made ATH so i will wait for a pullback into 1h FVG before looking for internal structure on the 1m-5m forming IFVG/CISD to take buys back up

DOWJONES Strong Gains Continue on Solid Earnings and Trade HopesUS30 – MARKET OVERVIEW | Strong Bullish Momentum Continues 🇺🇸
The Dow Jones continues to extend its strong gains, adding more than +400 points since yesterday, supported by optimism surrounding tariff developments and solid corporate earnings.
The index maintains a bullish structure, and as long as it trades above 47,570, the trend is expected to continue toward 48,220.
A short-term retest toward 47,570 would be considered normal within the ongoing bullish momentum.
However, a confirmed 15-minute candle close below 47,370 would shift sentiment to bearish, targeting 47,090 as the next key support.
Key Technical Levels
Pivot Line: 47,570
Resistance: 48,210 · 48,550
Support: 47,090 · 46,900
Outlook:
US30 remains bullish while above 47,570, targeting 48,220 and possibly higher.
Only a 15-minute close below 47,370 would signal a short-term correction toward 47,090.

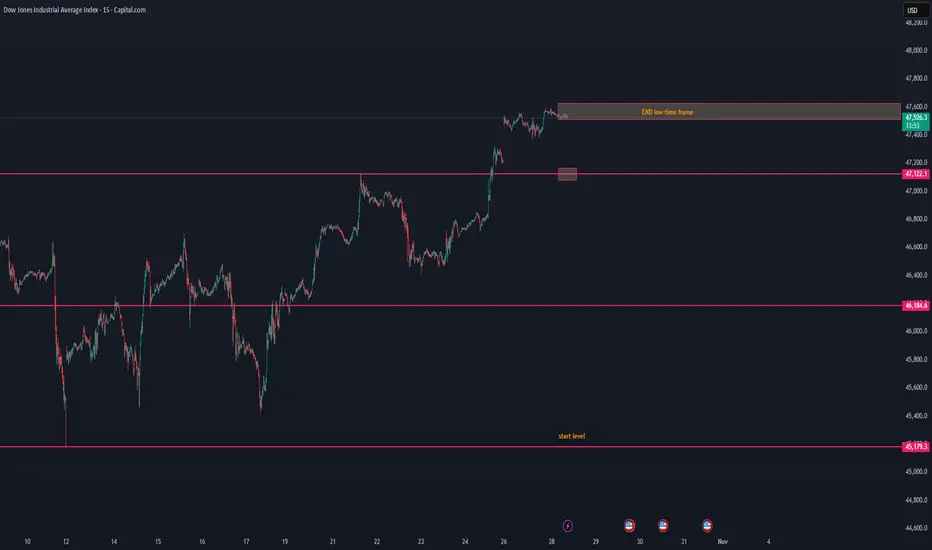
US30 lost its low time frame — possible breakdown aheadUS30 lost its low time frame — possible breakdown ahead ⚠️
US30 has lost its low time frame structure, showing early signs of weakness after the recent push to 47.5K.
The current price action suggests that momentum is fading, and sellers may start to take control.
📉 Short-term view:
Structure break below 47.5K zone confirms loss of bullish control.
The next visible support area sits around 47.1K, followed by 46.1K.
With time, price could continue to drift down toward the start level near 45.1K if buyers fail to defend.
📊 Observation:
Volume has started to cool off, and price is trading below the short-term EMA range — a typical setup before a gradual downward retrace.
💬 Summary:
US30 lost its low time frame momentum and looks to break down step by step toward the start level zone. We’ll monitor if buyers can react near 47.1K or if this becomes a broader correction phase.
US30 Looking bearish trend a short-term ForecastThe US30 index has retested its recent highs, and a short-term pullback appears likely as the new trading week begins.
Technically, price action suggests that after reaching the top once again, the index may retrace to recover lost ground. Local investors are closely watching the midweek release of September economic data, which will provide further insight into the Federal Reserve’s potential interest rate path. Market participants largely anticipate a rate cut later this week, which could inject renewed volatility into equities.
The market opened with a gap, indicating possible short-term indecision If the gap is filled, a rejection from resistance could trigger a decline toward the support zone between 46,800 and 46,000 Sustained buying pressure above resistance would invalidate the bearish setup and could signal further upside momentum.
You may find more details in the chart.
Trade wisely best of Luck buddies.
Ps; Support with like and comments for better analysis Thanks for Supporting.

US30 H4 | Bearish ReversalDow Jones (US30) is reacting off the sell entry, which aligns with hte 161.8% Fibonacci extension and the 61.8% Fibonacci projection, and could drop from this level to the downside.
Sell entry is at 47,651.31, which lines up with the 161.8% Fibonacci extension and the 61.8% Fibonacci projection.
Stop loss is at 48,228.80, whic lines up with the 100% Fibonacci projection.
Take profit is at 46,892.33, which is an overlap support that lines u;p with hte 38.2% Fibonacci retracement.
Stratos Markets Limited (tradu.com ):
CFDs are complex instruments and come with a high risk of losing money rapidly due to leverage. 68% of retail investor accounts lose money when trading CFDs with this provider. You should consider whether you understand how CFDs work and whether you can afford to take the high risk of losing your money.
Stratos Europe Ltd (tradu.com ):
CFDs are complex instruments and come with a high risk of losing money rapidly due to leverage. 70% of retail investor accounts lose money when trading CFDs with this provider. You should consider whether you understand how CFDs work and whether you can afford to take the high risk of losing your money.

Dow Gains on Earnings Optimism and Shutdown Resolution Hopes.Fundamental approach:
- The Dow Jones index advanced this week, supported by strong corporate earnings optimism and hopes for a government shutdown resolution.
- Major earnings reports from technology companies may lead the gains, with IBM scheduled to report Q3 earnings on Wed, 22 Oct, with expectations for AI-driven growth. Additionally, 3M (MMM) is scheduled to report Q3 earnings on Tue, 21 Oct, before market open.
- Fed Governor Christopher Waller provided a dovish signal, noting inflation was "not a barrier to rate cuts."
- This sentiment pushed US Treasury yields lower, with the 10-year note falling below 4.00%, offering support to equities amid the data uncertainty.
- Investors also focused on the potential end to the federal government shutdown, which has created data blackouts for key economic releases, with National Economic Council Director Kevin Hassett indicating the shutdown could end this week.
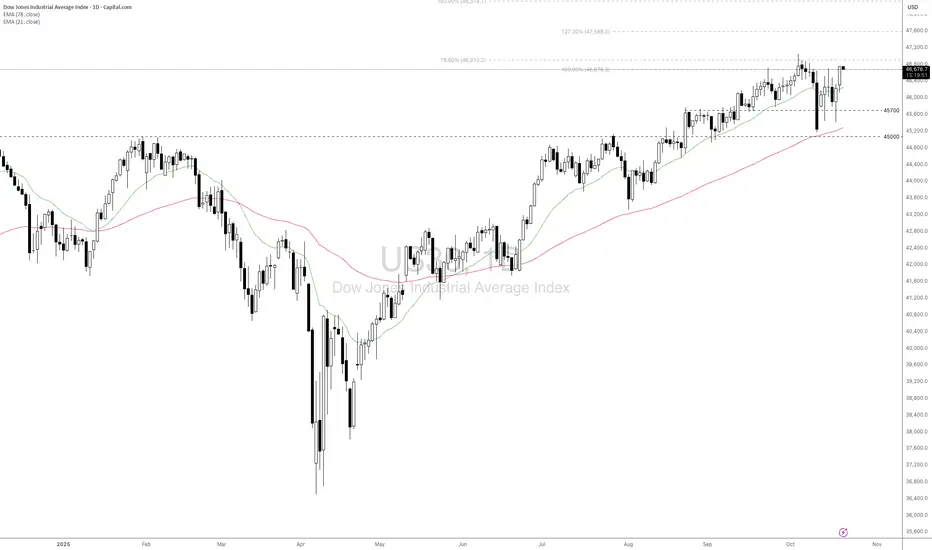
Technical approach:
- US30 is testing the previous all-time high at around 47000. The index is above both EMAs, indicating a strong bullish movement.
- If US30 breaches above 47000, the index may advance to test 127.20% Fibonacci Extension at 47590.
- On the contrary, staying below EMA21 may prompt US30 to retest the support at 45700.
Analysis by: Dat Tong, Senior Financial Markets Strategist at Exness
US30 - Intraday Playbook for NY Session 27/10/2025Here’s my structured 15M game plan heading into the US session today. We’re currently sitting inside a bullish trend, but we’re also at a point where price could either continue higher or shift momentum if key demand levels fail. So I’m prepared for both bullish continuation and a possible bearish reversal scenario.
✅ Overall Trend Context:
Higher highs / higher lows remain intact on the 4H / 1H.
Recent bullish leg may need a liquidity sweep / pullback before continuation.
Key intraday structure levels are now clearly defined.
📈 Bullish Continuation Scenario (Primary Bias)
I’ll look for long setups if price pulls back into demand zones and shows bullish rejection.
⚠️ Valid only while price holds above 47,200.
✅ Long Zone #1: 47,300 – 47,350 (first demand / shallow pullback zone)
✅ Long Zone #2: 47,150 – 47,200 (deeper liquidity pool)
Bullish Confirmation Triggers (15M or 5M):
Rejection wick from demand
Bullish engulfing / candle flip
Break of minor 5M structure after tap
🎯 Bullish Targets:
TP1: 47,450 (reaction zone)
TP2: 47,500 – previous high
TP3: 47,600+ if momentum extends
📉 Bearish Reversal Scenario (Alternate Plan)
I will only shift bearish if price breaks below the key higher-low level.
🔻 Bearish bias becomes active if we break & hold below 47,200.
✅ Plan: Wait for a break → retest of 47,200 – 47,250 as resistance → look for rejection
(5M / 15M bearish engulfing, failed reclaim, or lower high confirmation)
🎯 Bearish Targets:
TP1: 47,050 – first liquidity pocket
TP2: 46,900 – prior swing low / demand zone
TP3: 46,750 – deeper structural support
📍 Key Notes
✅ I won’t chase anything at market open — I’ll wait for liquidity grab and confirmation.
❌ No longs if 47,200 breaks decisively and turns into resistance.
❌ No shorts while above 47,200 unless a clear fakeout rejection occurs at 47,500.

DJIA Long Position Dow Jones reached an ATH today and it is half way through to my target. This shows strong bullish momentum from the Dow. I predict the Dow reaching $50,000 price in the following months.
US30 Trade Set Up Oct 27 2025Price ended up making ATH in Asia session closing above PDH and creating a 4h FVG which has been filled along with Asia lows/SSL being swept so i am expecting price to continue bullish to London highs/BSL

WTI crude oil upcoming week outlook!!📊 Technical Insight:
Price shows a clear Market Structure Shift (MSS) after multiple CHOCHs, confirming bearish intent ✅
Current setup targets the $57.88 zone after rejection from $61.50–$61.70 supply area 🔻
💡 Fundamental Insight:
🏭 Supply rising → OPEC+ easing cuts + U.S. output steady
📉 Demand concerns → Slower global growth & refinery maintenance
🛢️ Inventories building → Indicates short-term oversupply
⚠️ Risk factor → Geopolitical tensions may cause short-term spikes
🎯 Bias:
Bearish outlook remains valid toward $57.80 unless price reclaims $61.75+ zone 🚫
🧭 Watchlist:
EIA inventory data 🗓️
OPEC+ headlines 📰
U.S.–China trade updates 🌍
📍Summary:
WTI looks poised for a bearish continuation 📉
Stay patient, manage risk, and let probability and structure play out 🧘♂️

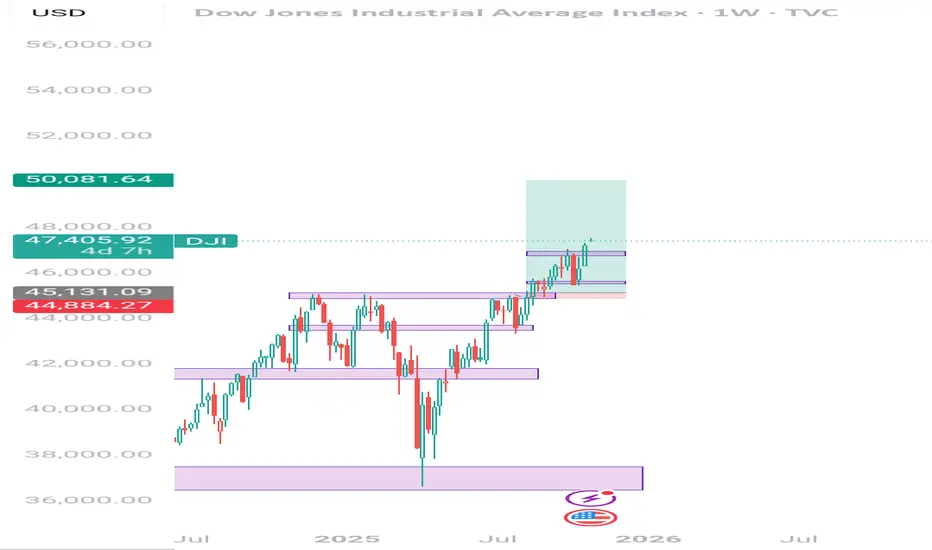
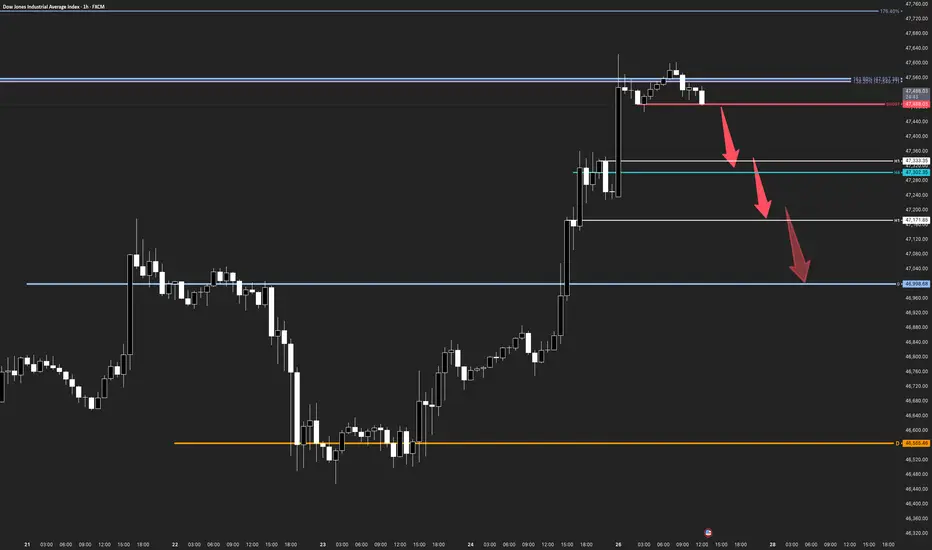
US30 | Countertrend Setup From Long-Term Fibonacci Target ZoneThe Market Flow | Oct 27, 2025
Technical Overview
Weekly / Daily:
• Price has reached the 138.2% Fibonacci extension , aligning with the upper boundary of the long-term impulse zone.
• This region represents a potential profit-taking area within an extended expansion phase.
• The daily structure completed an impulse to the 161.8% Fibonacci target .
• Market currently trades inside a high-probability reaction zone , suggesting risk of corrective flow.
H4:
• Price action shows initial hesitation beneath the prior breakout.
• Intermediate structural support rests near 47,330–47,200 , representing the first countertrend target .
H1:
• A defined trigger = 47,488 (red SHORT level) marks potential short confirmation if broken with a 1–2–3 sequence on M15.
• Below this level, the path → 47,333 → 47,171 → 46,998 aligns with visible breakout retests.
Trade Structure & Levels
• Bias: Bearish countertrend short below 47,488
• Trigger = 47,488
• Invalidation = 47,580 (H1 structure high)
• Path → 47,333 → 47,171 → 46,998
• Phase: Countertrend within extended impulse reaching long-term target zone
Risk & Event Context
• Long-term momentum remains bullish, but exhaustion signals at key Fibonacci confluence may induce a corrective phase.
• Watch for volatility spikes near macro releases or equity session opens that could accelerate profit-taking.
Conclusion
US30 sits within its long-term Fibonacci target zone. A confirmed lower-timeframe trigger below 47,488 would validate a short-term countertrend move toward daily breakout levels before broader structure reassessment.
US30Trading forex based on strong fundamentals is beneficial because it allows investors to make informed decisions grounded in real economic data rather than speculation. By analyzing key indicators like interest rates, inflation, GDP growth, employment, and geopolitical stability, a trader can anticipate currency movements driven by macroeconomic forces. This approach helps identify long-term trends and reduces emotional or impulsive trading, offering more consistent and sustainable profits. In essence, good fundamentals turn forex trading from a gamble into a strategic investment rooted in economic reality.

US 30 UpdateNext move on the way, focus on proper risk management & stay discipline. Wishing you successful trades..!
Key Reason:
1. Market structure was bullish.
2. H1 support area fresh and unmitigated.
3. Hidden OB formation.
4. Wait for retracement and confirmation.
This is not a financial advise take it with your own risk. Let's see how it will work.

US30US30 has taken the top one more time, now we are expecting a Pullback to start this week.
Disclosure: We are part of Trade Nation's Influencer program and receive a monthly fee for using their TradingView charts in our analysis.

US30 (1H) — Demand Zone Mapping & Bullish ScenariosHere’s my latest mapping for US30 on the 1-hour timeframe.
After a strong bullish impulsive move, I’m now watching for a potential retracement to one of the key demand zones before the next leg higher.
Zone 1: 47,100 – 47,000
This is the nearest demand zone and the first area where buyers might step in again.
If price holds here and forms a bullish reaction (e.g., engulfing candle or strong wick rejection), I’ll be watching for a possible continuation toward 47,750 – 48,100.
This level aligns closely with the 0.236 Fibonacci retracement, so it could serve as a shallow pullback for aggressive buyers.
Zone 2: 46,850 – 46,700
This zone sits around the 0.5 Fibonacci retracement, which usually acts as a more balanced correction area.
If price rejects Zone 1 but finds support here, it could form a stronger base for a continuation rally.
I’ll be monitoring this level closely for a cleaner structure before re-entry.
Zone 3: 46,600 – 46,400
This deeper zone overlaps with the 0.618–0.786 Fibonacci area, often referred to as the “golden pocket.”
If the market extends its retracement this far, it could present a high-probability buy setup—especially if liquidity sweeps below the previous low before reversing upward.
This would indicate smart money accumulation before a potential breakout.
Upside Targets
If bullish momentum continues, my key upside targets remain:
47,430 (0.27 ext)
47,750 (0.618 ext)
48,100 (1.0 ext)
I’ll look for confirmation and structure before committing to any position.
Bias remains bullish unless price breaks below 46,300, which would invalidate this short-term outlook.
Summary
I’m expecting a short-term pullback followed by a continuation toward new highs.
The goal is to wait patiently for price to come to the demand zones instead of chasing moves.
Plan the trade. Wait for confirmation. Execute with discipline.

US30: Bearish Continuation & Short Signal
US30
- Classic bearish setup
- Our team expects bearish continuation
SUGGESTED TRADE:
Swing Trade
Short US30
Entry Point - 47206
Stop Loss - 47308
Take Profit - 46961
Our Risk - 1%
Start protection of your profits from lower levels
Disclosure: I am part of Trade Nation's Influencer program and receive a monthly fee for using their TradingView charts in my analysis.
❤️ Please, support our work with like & comment! ❤️

US30 - Potential TargetsDear friends in trading,
As long as equities are making HH's it's going up...
The yellow line will serve as breakout support for the new ATH.
Keynote:
The government shutdown has the markets uneasy and unpredictable - BE SAFE
Thank you for taking the time to study my analysis.

US30 Massive Short! SELL!
My dear friends,
Please, find my technical outlook for US30 below:
The instrument tests an important psychological level 47206
Bias - Bearish
Technical Indicators: Supper Trend gives a precise Bearish signal, while Pivot Point HL predicts price changes and potential reversals in the market.
Target - 46982
Recommended Stop Loss - 47329
About Used Indicators:
Super-trend indicator is more useful in trending markets where there are clear uptrends and downtrends in price.
Disclosure: I am part of Trade Nation's Influencer program and receive a monthly fee for using their TradingView charts in my analysis.
———————————
WISH YOU ALL LUCK
