DXY about to break down and send NAS and Gold higher?Full Analysis of DXY, XAG, XAU, WTI, NAS, S&P and DJ30. I go through my whole analysis for the day and week on the daily and the 1h timeframe applying my mutitimeframe approach and Stacey Burkes teachings to my whole basket.
DJI trade ideas

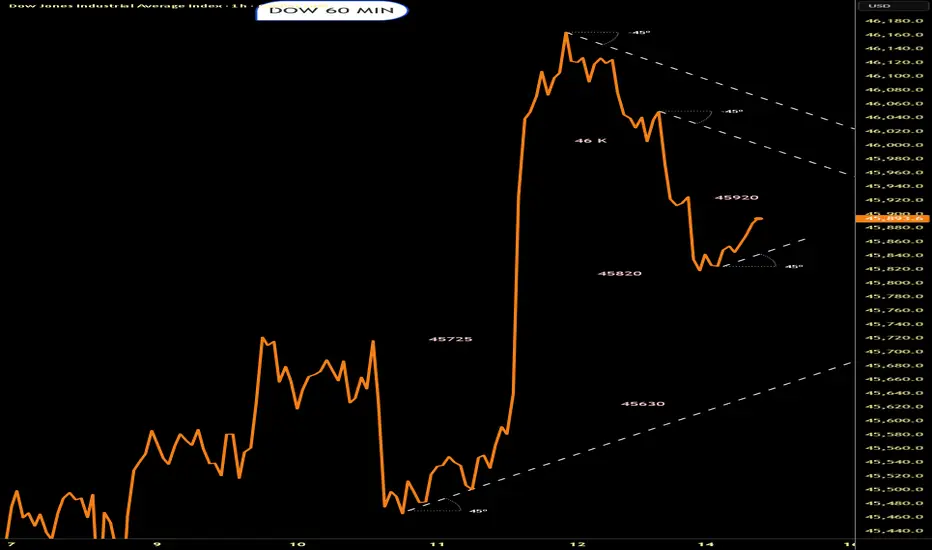
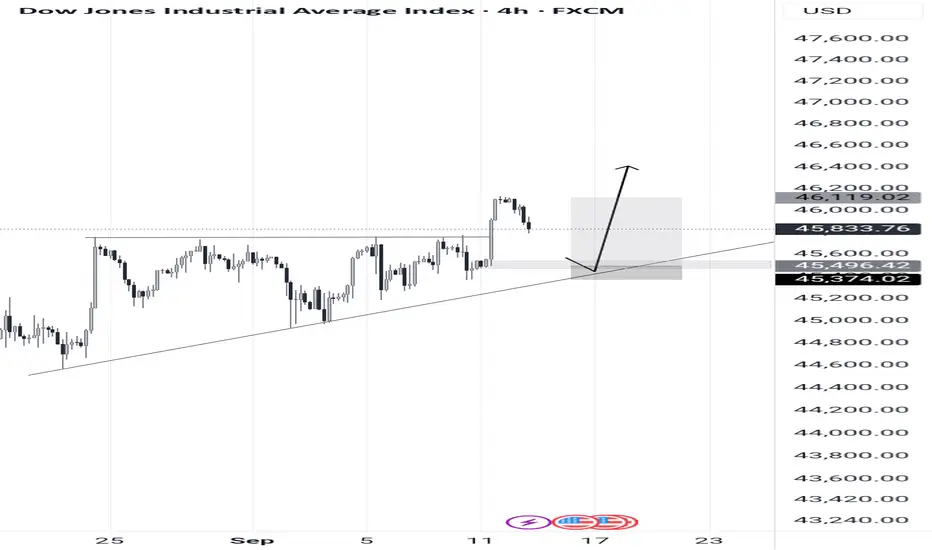
Gan strategy’s In dow jones has return after determining and calculating it’s considered my angle is 90 dgree and for time angle i calculated 90 candle though. Its in square shape and maybe it completes all major angles which is 360 last one
The smal rectangle consider price / time
And the trend line is my bias which golden one is major road and red is for selling and green is for buying.
Les see

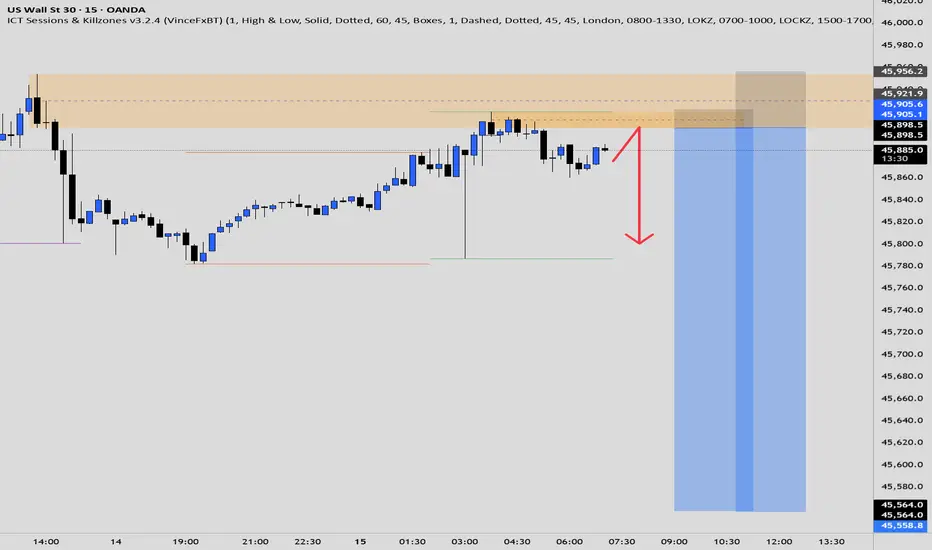
Long on US30 for NY OpenThis is long idea for US30 in the new york open ... We had a low taking out and now we had a great bullish leg up , im looking at new york open high taken out

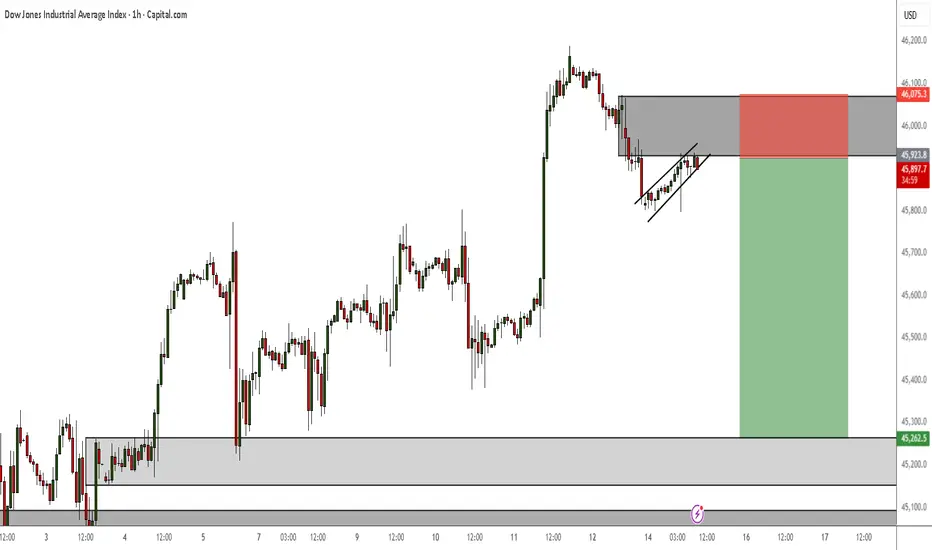
Dow Jones is in a Bearish CorrectionThe downside correction for US30 will also continue as DXY pushes up this week.
Currently on M15 TF I am seeing a bearish correction pattern for shorting.
Us30 Trade Set Up Sep 15 2025www.tradingview.com
Price has swept PDL back stayed closed above, so i am overall still bullish. I would like to see price sweep internal SSL followed by a IFVG/CISD on the 1m-2m to continue higher

US30 ShortElite Analysis
Now we wait for price to come to us
Targeting lower liquidity pools
Executing 2 trades
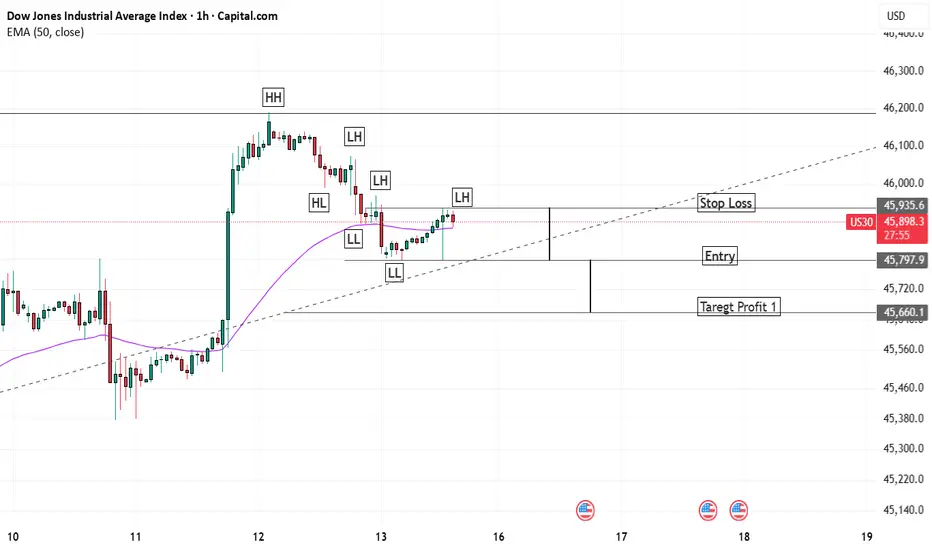
US 30 1 Hour Downward Trend Simple Dow TheoryUS 30 1 Hour Downward Trend Simple Dow Theory
LH and LL Making
Setup is Mentioned
Trade with Care
Dow not looking too happyNot looking as good as the other index.Might find some buyers.? Lets se what happens
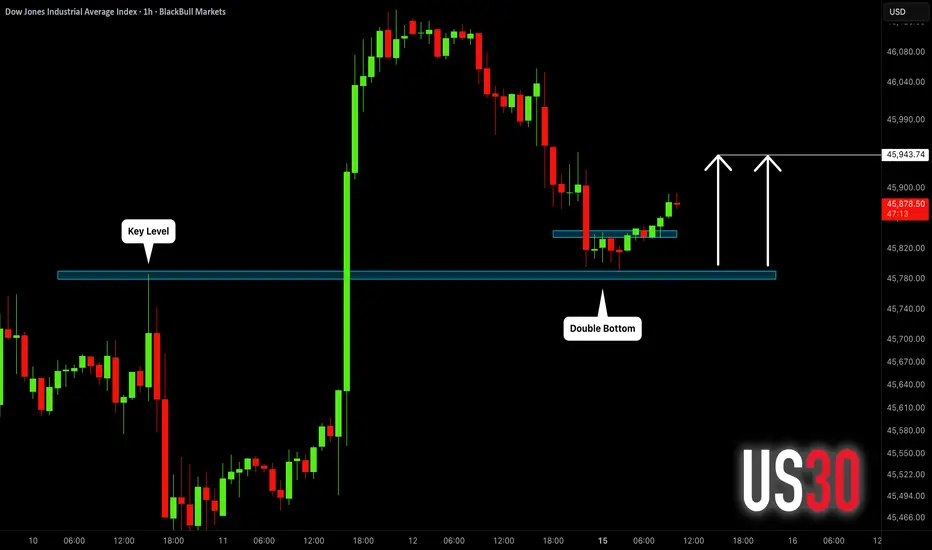
DOW JONES (US30): Pullback From Support Confirmed
Following our Friday's analysis, US30 retested a recently broken
major daily demand zone.
Testing the underlined horizontal key level, the price formed a tiny double bottom.
Its neckline breakout indicates a highly probably pullback.
Goal - 45940
❤️Please, support my work with like, thank you!❤️
I am part of Trade Nation's Influencer program and receive a monthly fee for using their TradingView charts in my analysis.
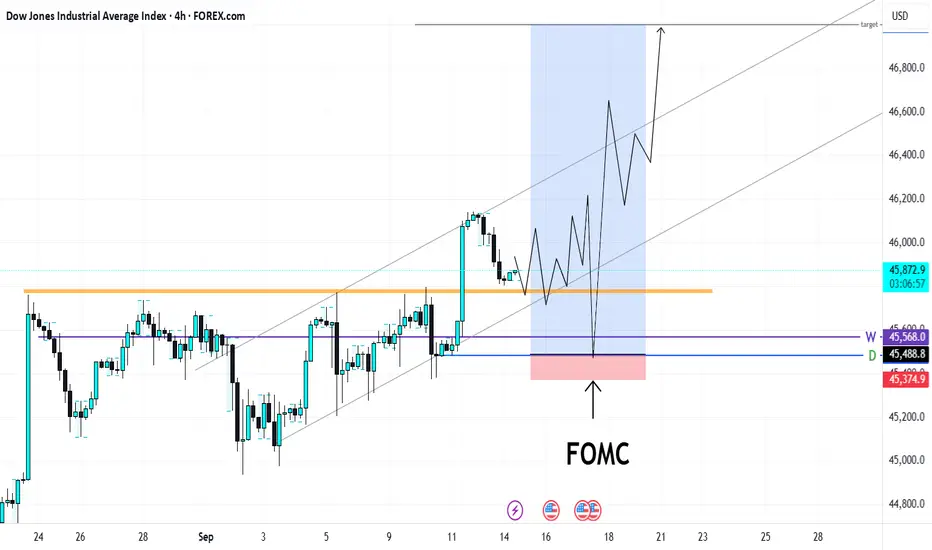
Dow Jones - FOMC idea: LONG to 47,000Fundamentals
I don't think it is good idea to be selling the dollar any longer but it's still good to be long on equities indexes.
There's a guaranteed rate cut of -0.25% from the Federal Reserve on Wednesday. Lowering interest rates means more people are going to borrow. More people spending, more businesses thriving, stocks go up, index go up. There are two more cuts to be expected for 2025 and that is what smart money is pricing in. That is the expectation. The Fed has chosen the labor market over inflation issue. The surprise here would be if the Fed changes its focus to inflation. Which could stun or drop the indexes. That is unlikely that is why it is high probability long.
Technical
It's too early to tell right now, how the price action is going to be. If price action changes on tuesday, I'm going to be doing the same thing. That is to find liquidity of bandwagon buyers, at an obvious break and retest support. Below that where stops and sell stops is I estimate where the discounted smart money longs would be. That is 45,500
I will not be putting a buy limit until Wednesday London session that is if price action remains the same
Us30what ya think?
easy break n re-test
i got nothing else to say lol
its up trend and kept going up back and the same support it was trying to break when it was resistance

Sell offsLooking to see if us30 plans on closing below this zone for the week. if we get a close below the zone then expect to see the lower high set ups and retest back to the previous higher low at 45486

Dow Jones Industrial Average Possible outlook Week 38 ATHAre we ready for the new All Time High? US30 possibly aiming to correct during the early days of the week prior the anticipated bullish run.

US30 - Bullish Continuation SetupBias: Bullish
High-Timeframe (4H/1H):
Price shows a strong bullish board structure with momentum firmly to the upside. Volume candles are clean and imprinted, signaling continuation potential and smart money control.
Mid-Timeframe (30M):
Dropped down to monitor board continuations. Structure has been mapped and refined—everything is aligned with HTF bullish intent. We are now waiting for proper sell-side liquidity to be taken. This is the “courtyard” where stops are absorbed before smart money resumes the upward move.
Lower-Timeframe (5M):
Once mitigation occurs and the order block is properly cleared, we will drop to 5M for precise entry confirmation. Price should hold the mitigated area, confirming smart money support before riding the continuation.
Entry Zone: Pending proper mitigation of the mid-timeframe order block.
Targets:
• Lower timeframe highs (5M)
• Mid-timeframe highs (30M)
Mindset Note:
Let smart money lead direction. No rushing entries—wait for the order block to be mitigated and price to confirm support before engaging. Patience and precision over impulse.
Too clear too easy We'll be patient with this one. Once price reach to our POi, dropp down to lower timeframe to find precise entry, worthy the wait. #us30
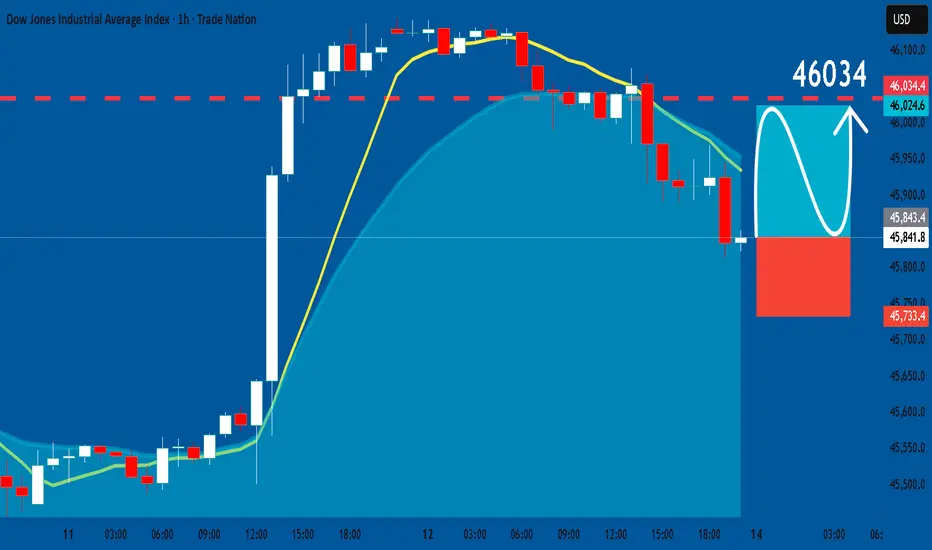
US30: Long Trade Explained
US30
- Classic bullish pattern
- Our team expects retracement
SUGGESTED TRADE:
Swing Trade
Buy US30
Entry - 45841
Stop - 45733
Take - 46034
Our Risk - 1%
Start protection of your profits from lower levels
Disclosure: I am part of Trade Nation's Influencer program and receive a monthly fee for using their TradingView charts in my analysis.
❤️ Please, support our work with like & comment! ❤️
Bye Bye - Dow & IndicesThis is not financial advice but a 100% true method of market structure and what to expect in the future. Watch and see.... Believe it or not!


US30US30 needs some correction and then continue the same direction.
Disclosure: We are part of Trade Nation's Influencer program and receive a monthly fee for using their TradingView charts in our analysis.

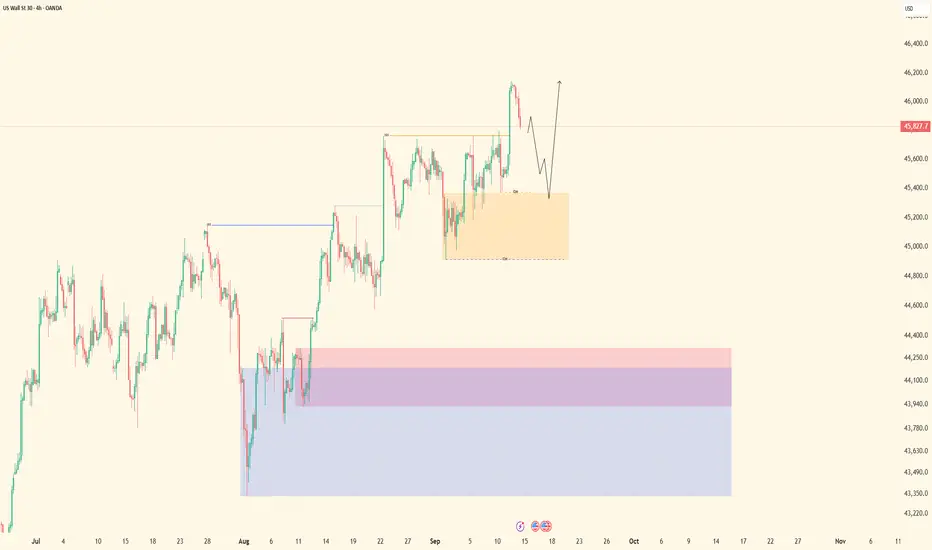
us30 4hTrading Outlooks for the Week Ahead
In this series of analyses, we review short-term trading outlooks and perspectives.
As can be seen, in each analysis there is a key support/resistance zone close to the current price of the asset. The market’s reaction to or breakout from these levels will determine the next price movement toward the specified targets.
Important Note: The purpose of these trading outlooks is to highlight critical price levels ahead and the market’s potential reactions to them. The analyses provided are by no means trading signals!

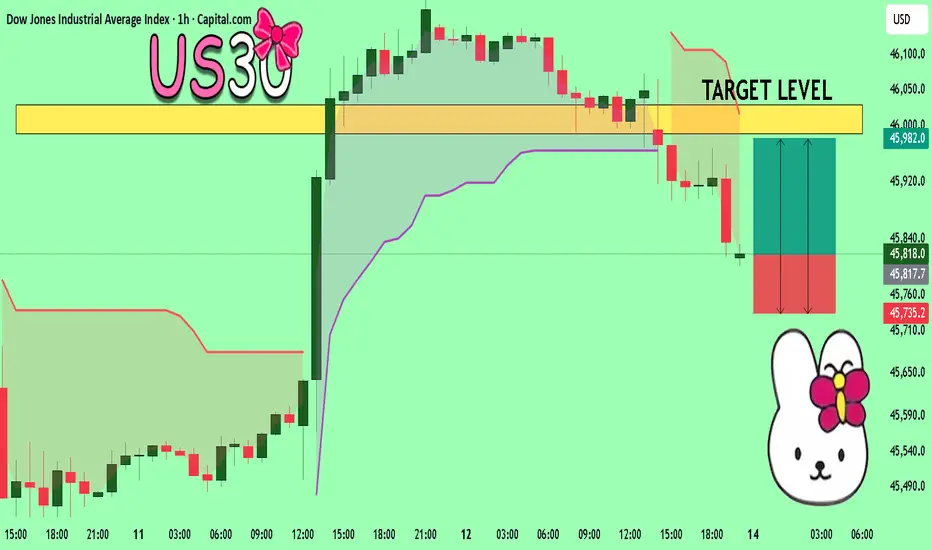
US30 Will Explode! BUY!
My dear friends,
Please, find my technical outlook for US30 below:
The price is coiling around a solid key level - 45818
Bias - Bullish
Technical Indicators: Pivot Points Low anticipates a potential price reversal.
Super trend shows a clear buy, giving a perfect indicators' convergence.
Goal - 45988
Safe Stop Loss - 45735
About Used Indicators:
The pivot point itself is simply the average of the high, low and closing prices from the previous trading day.
Disclosure: I am part of Trade Nation's Influencer program and receive a monthly fee for using their TradingView charts in my analysis.
———————————
WISH YOU ALL LUCK
Weekly Forex Outlook Sun.Sept.14.2025 - Fri.Sept.19.2025Like and Comments would be appreciated :D Not Financial Advice, Just my outlook/opinion

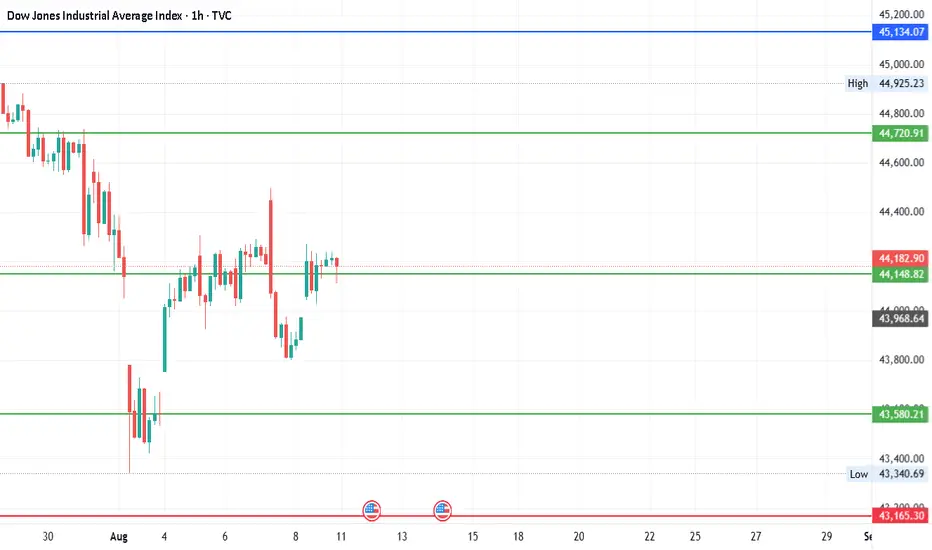
#DJI - Levels for Aug 2025Date: 09-08-2025
#DJI - Current Price: 44175.61
Pivot Point: 44149 Support: 43580 Resistance: 44721
#DJI Upside Targets:
| 🎯 Target 1 | 45134 |
| 🎯 Target 2 | 45547 |
| 🎯 Target 3 | 46072 |
| 🎯 Target 4 | 46596 |
#DJI Downside Targets:
| 🎯 Target 1 | 43165 |
| 🎯 Target 2 | 42750 |
| 🎯 Target 3 | 42226 |
| 🎯 Target 4 | 41702 |
#TradingView #Nifty #BankNifty #DJI #NDQ #SENSEX #DAX #USOIL #GOLD #SILVER
#BHEL #HUDCO #LT #LTF #ABB #DIXON #SIEMENS #BALKRISIND #MRF #DIVISLAB
#MARUTI #HAL #SHREECEM #JSWSTEEL #MPHASIS #NATIONALUM #BALRAMCHIN #TRIVENI
#USDINR #EURUSD #USDJPY #NIFTY_MID_SELECT #CNXFINANCE
#SOLANA #ETHEREUM #BTCUSD #MATICUSDT #XRPUSDT
#Crypto #Bitcoin #BTC #CryptoTA #TradingView #PivotPoints #SupportResistance