us30 April 10 4h + 1hr Downtrend entryif 23% holds as resistance then we short to head lower. the better the premium price the better. let see what liquidity builds over night.
target 1 is always the lows and target 2 is -27%
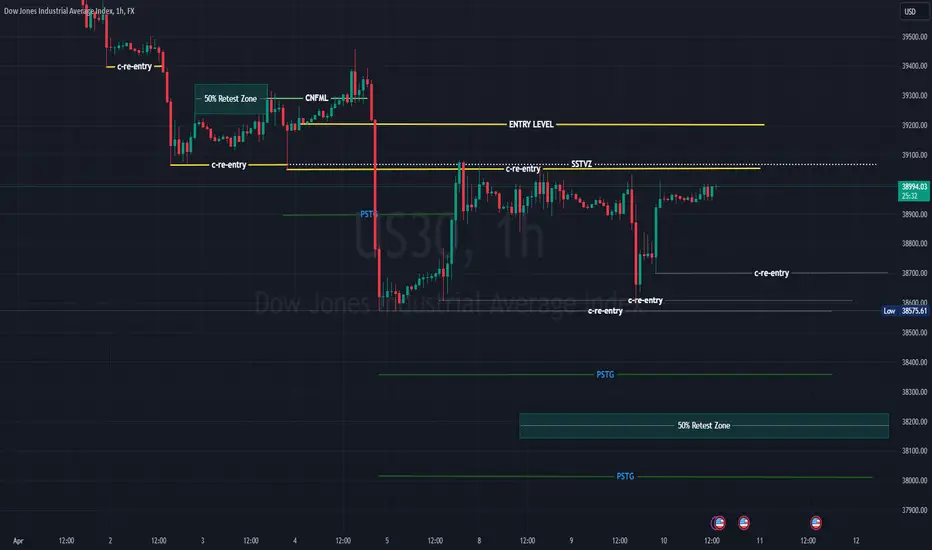
DJI trade ideas

US30 PRICE PREDICTIONUS30 looks to be reversing on the high (daily) timeframe. it made a perfect M formation and has now closed below the 50 ema on the daily timeframe.
when price is below the 50 EMA it indicates a down trend vice versa
price may retest the 50 ema before going down.
NOTE : price pulled back to the 618 on fibs (daily timeframe)
looking for price to reach the 200 ema on d1 timeframe

US30 4H EOD Idea April10 24'Key Bull area @ 88.6 % area.
waiting for market to create a pocket of liquidity and then grab it
so we can head up, bearish until then.
gonna post next tokyo and london session setups for smaller timeframes.

Handling The Draw DownCurrently in Draw-Down. Remember always to limit your loss to 1%. The trader with the remaining capital to trade again, always stands a chance to win in the end.

Dow Jones, interpretation of where we areDespite the fact that i calculated the dates, this is just my calculation and correction could easily end in 2033rd, but for now we are monitoring the index and in the future it will be clearer to us where we are, and idea can be updated.
According to my interpretation, the bull market ended in 2021 and now we are in a rising sideways leg, which should end at the beginning or end of summer 2024.
I have two prefered calculation's of target for rising sideway's leg(wave, local rally):
1)39150$ +-500$
2)39950$
Then we go to 1st area(white lines) and bear market within flat should last about 1 year.
Next rally(leg) in the context of the expected flat correction should end around 36000$ in Spring of 2027.
And i hope that all the correction will be finished in March of 2028(Prefered, because it should be fast destroy like tsunami) or December 2029, at the 2nd area(red lines), so we won't be too old by then.)

US 30 - Ranges overview We are taking out the weekly sellside liquidity on US 30.
Keep a close eye to it and watch how we close this week.
IF we hold it expect us to target back towards the highs
IF we fail to hold expect further pa to the downside
Don't hesitate to correlate it with DXY and its current trading range.
Stay safe and never risk more than 1-5% of your capital per trade. The following analysis is merely a price action based analysis and does not constitute financial advice in any form.

US30 April 10'24 Daily EODPremium Area on the daily time frame. If current market candles can close above in 2 hours then that would be added confluence towards a buy bias. It would be an 80% chance we reach all time highs again if respected. Lower time frame analysis coming soon.

US30 April 10 HTF M + WAfter a long break from posting on TV. I am back with Dow jones updates.
Currently under a consistency Routine in a mission to progress through. I am funded and trading Forex and Futures.
Now getting into tecnicals, I was waiting for a top to form so I could have a clear Point to establish the swing high where i can place the fibs. Anticipating buy levels for end of month activity with these significant retracement levels.
Going to aim to post HTF ideas as often as the candles close.


DOW JONESVery short time chart 15 minutes counts
I may be wrong but seems to have done wave 1 or A downside.


US30 VS CPIThe Consumer Price Index (CPI) has exceeded expectations for the third consecutive month. This development suggests that the US30 price may have reached a monthly low and could potentially continue its upward trajectory, establishing new higher highs as investors are likely to maintain their investments.
What are your thoughts?
Tradebudz

US30 Sell IdeaCAPITALCOM:US30 has broken the last Higher Low after forming bearish divergence on RSI indicating potential bearish move. Moreover, It has also broken bullish trendline by forming new Lower Low. We can look for sells between fib 50-75% levels.


US30 PLAYED OUT JUST EXACTLY AS I PREDICTED AS ALWAYSEven after CPI, the market on US30 did play out as i predicted, When it comes to analyzing the market, you don't have to tell me.

#us30 Daw Jones - closeday price attitudeHey Guyz...
wish u have a good day !!
there is something that may most of you know about it ...
but i did a publish about it , as a refreshment !!
as u see in the screen , price has a good reaction to the "Previous day close Price"
and safely gave u 3 buy position ...
this was a real-time example ...
you can back-test and check for yourself !!
that's a lot helpful for you, if you have Daw jones in your watchlist !
if this was helpful for you , just gimme a pray :X
Good Luck friends.

US30 SELLERS GETTING READY FOR CPI Here we are on us30 waiting for CORE CPI/INFLATION RATE News release and sellers are getting ready to take the big decision as we get ready to make the most money out of that decision they will take.
Dow Jones' next moveHe can probably move based on the drawing path ! So you can only think about buying from the floor


DOW JONES ANALYSISChart : 1Hour
Overall Trend : Bullish
Current Market Structure : Consolidation
Scenario 1 :
Price is failing to break below 38800 , as we can see that is a strong demand area to push off on . Will wait for a break towards the upside . Will find entry on lower timeframe . We are forming a bullish chart pattern

Possibility of uptrend Considering the recent downward wave, if the index crosses the support range, the continuation of the downward trend is likely. Otherwise, by crossing the resistance range, the downward trend will be canceled and the continuation of the sideways or upward trend will be possible

US30 SELLCurrently in a sell position on Dow Jones. We've reached a very respected resistance level on the 1 hour. Market has made several attempts to break the resistance for the past 3 trading days but hasn't been able to push through even during heavy volume sessions. I'm expecting market to correct its FVG and create another support (higher low) before being able to go above the current respected resistance. Trade at your own risk
