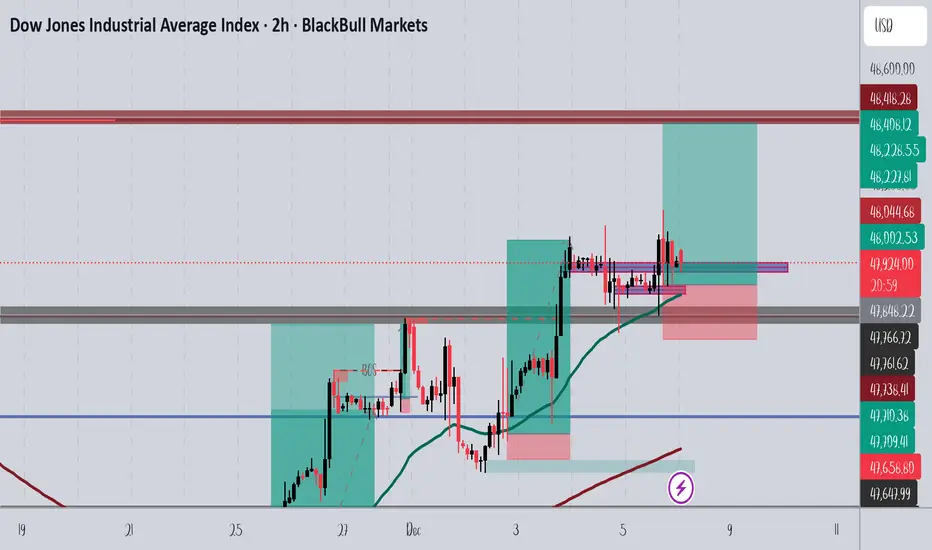
US30 Long
I'm watching a potential buy opportunity on US30. The supply zone looks like it's failing to hold, so my bias is shifting toward a long position.
Dow Jones Industrial Average Index
No trades
Trade ideas

US30 Trading Opportunity! SELL!
My dear friends,
Please, find my technical outlook for US30 below:
The instrument tests an important psychological level 47934
Bias - Bearish
Technical Indicators: Supper Trend gives a precise Bearish signal, while Pivot Point HL predicts price changes and potential reversals in the market.
Target - 47694
About Used Indicators:
Super-trend indicator is more useful in trending markets where there are clear uptrends and downtrends in price.
Disclosure: I am part of Trade Nation's Influencer program and receive a monthly fee for using their TradingView charts in my analysis.
———————————
WISH YOU ALL LUCK

US30 -2HR SetupPrice is holding above the demand zone after a clean break of structure. As long as this level is maintained, bullish continuation toward the next resistance remains in play.
DOW/US30 - OVER BOUGHT Team, I hope you recall the trade last 3 days ago about OPPORTUNITY OF BEAUTIFUL CHART
Since then, it has been running up over 1400 points in 3 days.
Now I find myself in a good time to SHORT, with 3-4 confluences to make that decision.
1- 1400 points up in 3 days, (2 days up because of RATE cut)
2 - Daily chart indicates overbought
3 - NEW ATH
Therefore, we expect a small retracement.
SHORT range at 48787 - 48850 - STOP LOSS above 50050
Target 1 at 48715-48650
Target 2 at 48600-48550
Target 3 at 48412-48350
LETS GO

US30 Short Bias | Resistance Rejection SetupUS30 is showing bearish pressure near the 48,000 zone, which is acting as a short-term resistance area. Price rejection from higher levels suggests weakening bullish momentum and potential continuation to the downside. Lower highs on the intraday timeframe indicate sellers are in control.
Trade Plan:
As long as price remains below 48,050, the bearish setup stays valid. A move toward 47,200 is expected if selling pressure continues. Trail stop once price moves in profit to secure gains.
KEY LEVELS
Entry 48,000
Target 47,200
Stop Lose 48,050

US30 Technical Breakdown – 12/11/2025📍 US30 Technical Breakdown – 12/11/2025
US30 rejected sharply from the 48,100–48,200 resistance zone, creating a clean wick rejection before pulling back into the mid-range. Despite the selloff, the broader structure remains bullish as long as price holds above 47,700, but momentum has clearly cooled with EMAs flattening out 🔍📉.
📊 Market Behavior:
🔹 Strong rejection from 48,150 — sellers defending heavy supply
🔹 EMAs tightening → momentum slowing after the push
🔹 Price stuck in a wide consolidation between 47,700–48,150
🔹 Bulls still defending higher-timeframe structure
📌 Key Levels:
🔹 Resistance:
48,150 → major supply / rejection zone
48,000 → intraday reaction level
47,930 → current retest zone
🔹 Support:
47,700 → immediate support (key for trend continuation)
47,500 → deeper intraday demand
46,960 → strong structural support if market breaks down
🧠 Bias:
Neutral-to-bullish above 47,700 📈
📈 Break & close above 48,150 → opens path to 48,300 → 48,500
📉 Lose 47,700 → downside opens toward 47,500 → 47,000
💡 Trade Ideas:
🔹 Bullish Setup:
Entry: 48,020 (break + retest above resistance)
TP1: 48,180
TP2: 48,320
SL: 47,820
🔹 Bearish Setup:
Entry: 47,680 (loss of support)
TP1: 47,500
TP2: 47,300
SL: 47,850
🎯 Summary:
US30 rejected the 48,100 resistance zone and is now rotating back toward support. Bulls remain in control on the higher timeframe, but short-term momentum has slowed. Watch 47,700 closely — hold = continuation, break = correction 🔥📊
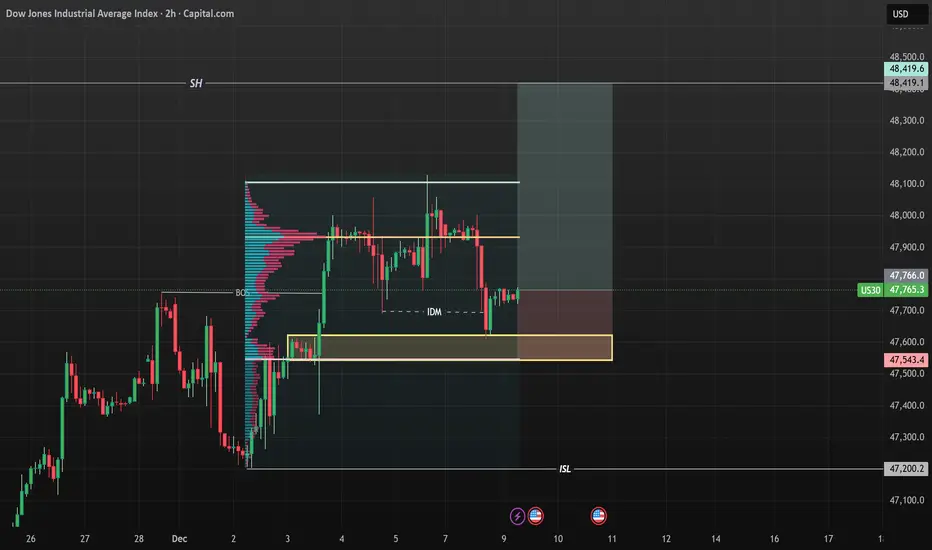
US30 BUY NOW!!!!!!!US30 take out the recent previous internal structure high and made an inducement with a proper price rejections off the demand zone am looking forward to see price maintain a bullish bias moves till price arrives 48,419....
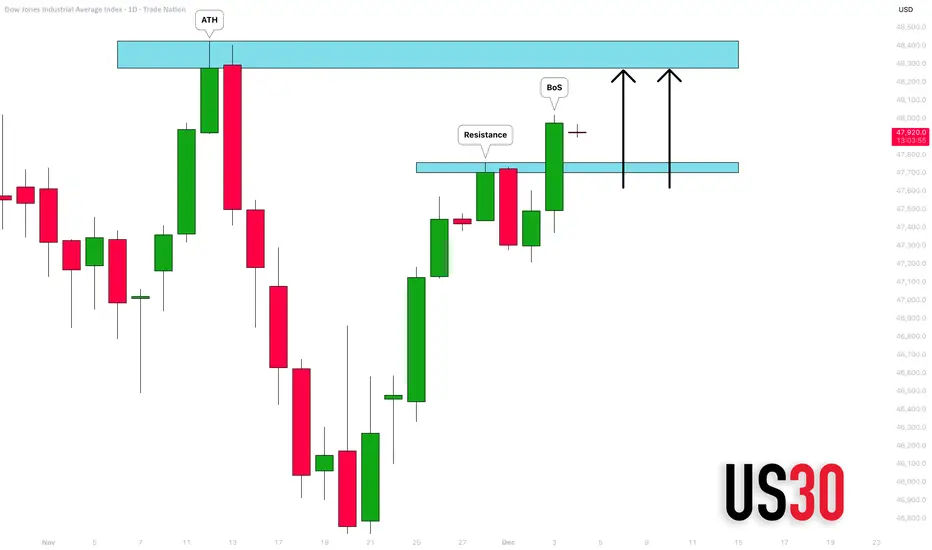
DOW JONES INDEX (US30): Confirmed BoS
With the yesterday's fundamental US news releases and
Trump's speech, US30 bounced strongly.
The market violated a significant daily resistance cluster
and closed above that.
It opens a potential for more growth to a resistance based
on a current All-Time High.
❤️Please, support my work with like, thank you!❤️
I am part of Trade Nation's Influencer program and receive a monthly fee for using their TradingView charts in my analysis.
SELLS ON US30SELLS on us30. we're currently at all time high. i saw a shift in momentum from buy to sell as indicated by the sell H2 time frame candle in black . i dont expect this short to work though as we are on all time highs
US30

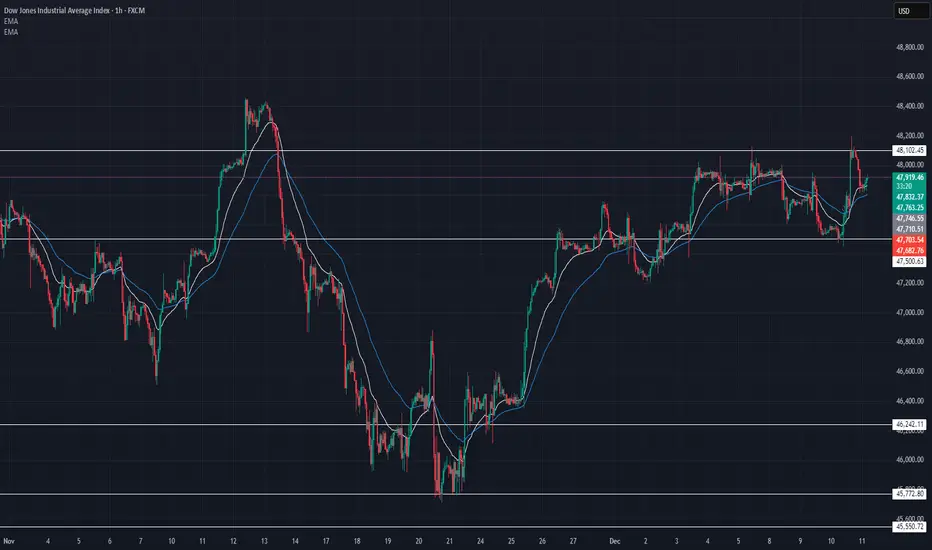
US30 reflected by the upper bandIn my opinion, the upper band will reflect US30 and will go down to the lower one.
If the lower is crossed, expect more bearish.
The US 30 could stay more days between this interval - expected end of the week.

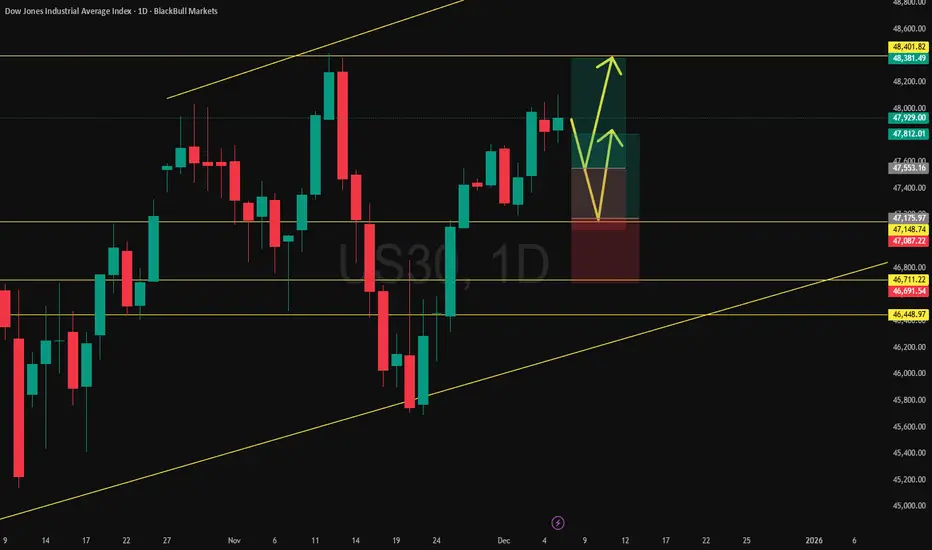
US30: Targeting the Top of the Upward Channel via Two RetracemenUS30 continues to climb within a broad upward-sloping channel, and the bias remains toward a run into the channel high.
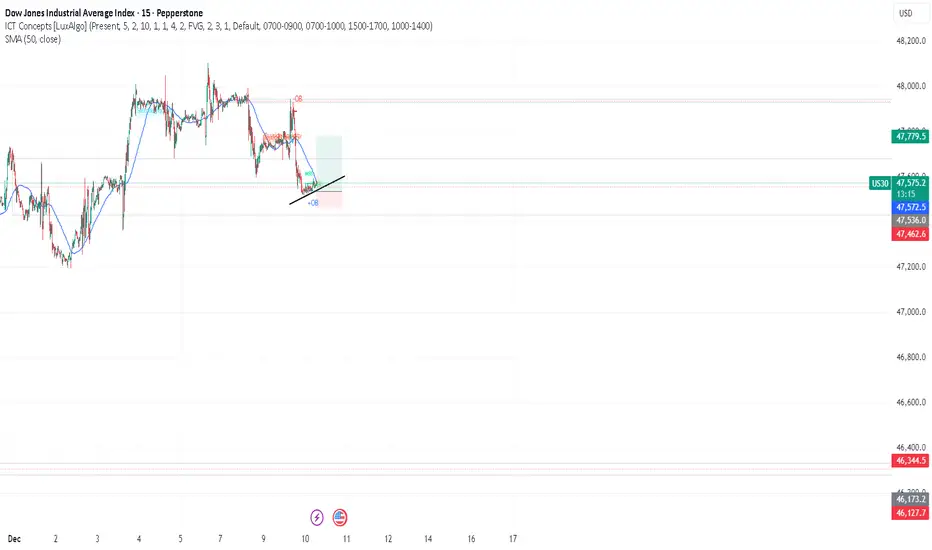
US30 Trade Set Up Dec 11 2025Price is making HH/HL so now in a bullish trend but it currently at a supply and approaching PDH so if it sweeps it i will look for internal IFVG/CISD to target Asia lows before continuing a bullish trend but if price closes above PDH price can go higher to BSL and higher supply

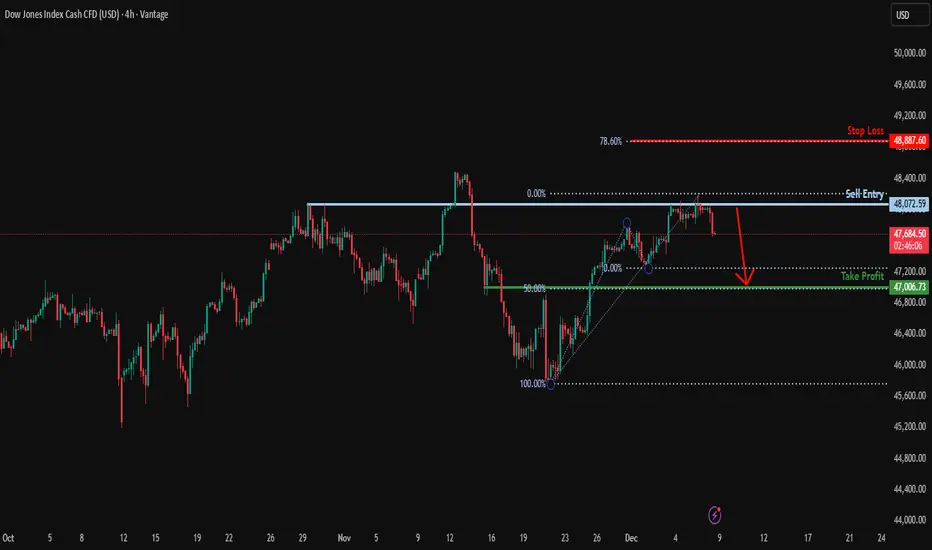
Could we see a reversal from here?NAS100 has rejected off the resistance level, which is a pullback resistance and could potentially drop from this level to our take profit.
Entry: 48,072.59
Why we like it:
There is a pullback resistance level.
Stop loss: 48,887.60
Why we like it:
There is a resistance level at the 78.6% Fibonacci projection.
Take profit: 47,006.73
Why we like it:
There is a pullback support that aligns with the 50% Fibonacci retracement.
Enjoying your TradingView experience? Review us!
Please be advised that the information presented on TradingView is provided to Vantage (‘Vantage Global Limited’, ‘we’) by a third-party provider (‘Everest Fortune Group’). Please be reminded that you are solely responsible for the trading decisions on your account. There is a very high degree of risk involved in trading. Any information and/or content is intended entirely for research, educational and informational purposes only and does not constitute investment or consultation advice or investment strategy. The information is not tailored to the investment needs of any specific person and therefore does not involve a consideration of any of the investment objectives, financial situation or needs of any viewer that may receive it. Kindly also note that past performance is not a reliable indicator of future results. Actual results may differ materially from those anticipated in forward-looking or past performance statements. We assume no liability as to the accuracy or completeness of any of the information and/or content provided herein and the Company cannot be held responsible for any omission, mistake nor for any loss or damage including without limitation to any loss of profit which may arise from reliance on any information supplied by Everest Fortune Group.
DOW/US30 - BEAUTIFUL CHART Team, I am looking at the US30/DOW - whatever you call it
look beautiful on the 5/15 minutes channel
Sorry, i been too lazy to post because lately I've been doing scalping
I am about to prove another challenge where $1000 turns into a million
Last account $1000 turned into 100k, took 6 months
But this challenge, I am not sure.
Anyway lets focus on the trade right now
the price is 47590-99 - long entry
STOP LOSS at 47550
Target 1 at 47650-47666
Target 2 at 47701-47715
Target 3 at 47760-47781
LETS GO
DowJones Key support at 47530 Key Support and Resistance Levels
Resistance Level 1: 48132
Resistance Level 2: 48276
Resistance Level 3: 48420
Support Level 1: 47530
Support Level 2: 47366
Support Level 3: 47185
This communication is for informational purposes only and should not be viewed as any form of recommendation as to a particular course of action or as investment advice. It is not intended as an offer or solicitation for the purchase or sale of any financial instrument or as an official confirmation of any transaction. Opinions, estimates and assumptions expressed herein are made as of the date of this communication and are subject to change without notice. This communication has been prepared based upon information, including market prices, data and other information, believed to be reliable; however, Trade Nation does not warrant its completeness or accuracy. All market prices and market data contained in or attached to this communication are indicative and subject to change without notice.

US30 patienceSells? This is a setup I tend to look for. As I explained in my previous post. I look for clear direction obvious pull back and a continue in that direction. I'm watching this on a 30min TF. I'm still waiting on confirmation of continuation even if its 600 points. It's already touched 3 quarter levels since 5AM. If I get in for sells my first target it 47,625.

US30 Trade Set Up Dec 8 2025Price is currently in a 1h range so first i want to see either a sweep of SSL/Asia and London lows to then look for 1m-5m IFVG/CISD to target BSL and supply

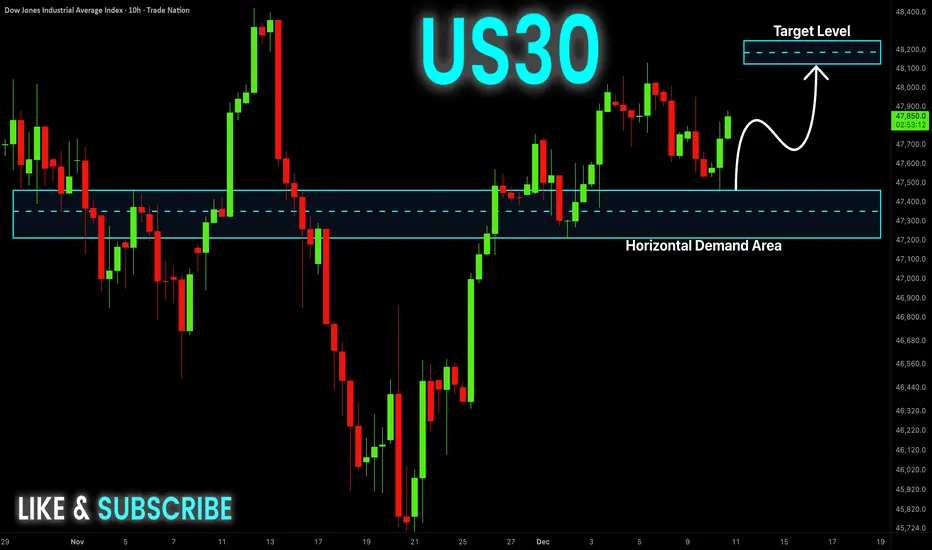
US30 Will Go UP! Buy!
Hello,Traders!
US30 has rebounded cleanly from the horizontal demand area after sweeping sell-side liquidity, confirming an SMC accumulation reaction that shifts order-flow bullish and draws price toward the next buy-side target above. Time Frame 10H.
Buy!
Comment and subscribe to help us grow!
Check out other forecasts below too!
Disclosure: I am part of Trade Nation's Influencer program and receive a monthly fee for using their TradingView charts in my analysis.
SHORT ON US30Us30 has created a head and shoulder pattern at a major supply area/zone.
FOMC is coming out in a few minutes and this could be a major catalyst to US30 falling.
Strictly going off technical's with the chart. Looking to make 1k-2k points.

DowJones key trading levelsKey Support and Resistance Levels
Resistance Level 1: 49000
Resistance Level 2: 49253
Resistance Level 3: 49600
Support Level 1: 48100
Support Level 2: 47870
Support Level 3: 47520
This communication is for informational purposes only and should not be viewed as any form of recommendation as to a particular course of action or as investment advice. It is not intended as an offer or solicitation for the purchase or sale of any financial instrument or as an official confirmation of any transaction. Opinions, estimates and assumptions expressed herein are made as of the date of this communication and are subject to change without notice. This communication has been prepared based upon information, including market prices, data and other information, believed to be reliable; however, Trade Nation does not warrant its completeness or accuracy. All market prices and market data contained in or attached to this communication are indicative and subject to change without notice.

US30: Late-Cycle Pop or Pullback Setup?The 𝐃𝐨𝐰 is pressing fresh highs into a historically soft seasonal window with stretched momentum and limited follow-through. I’m initiating/adding to a daily timeframe short aiming for a retrace back into prior breakout territory. My baseline path is a drift lower toward 44,500–44,000 (T1) and then the broader demand band near 43,000–42,2500 (T2), where I’ll reassess.
This isn’t a “crash” call—just a tactical mean-reversion as macro tailwinds fade, breadth narrows and the first Fed cut shifts the narrative from “rates down” to “why they’re down.”
Technicals:
• Stretched swing: Price has stair-stepped higher with shallow pullbacks; we’re now extended above the 50/100-DMA stack with waning impulse on push days (smaller real bodies, upper wicks).
• Local resistance: Repeated stalls into the same supply shelf. I’m leaning into the most recent failed extension and fading the box.
Structure map:
• Entry: around/into the failed-break zone 46.4k area.
• Invalidation: daily close > recent spike highs around 47.7k-48.0k.
• Targets: T1 45,000–44,500 (prior ATH retest / micro-POC region); T2 44,000–43,000.
• Risk: 0.5–1.0R per add; scale in only on rejection prints or lower-highs.
Fundamentals:
1) The first Fed cut is not automatically bullish.
The Fed delivered a 25 bps cut in September and signaled more easing, which historically can coincide with late-cycle growth scares and choppier equity returns rather than a straight-line melt-up. The cut was framed around cooling activity and inflation progress. 
2) Growth data is mixed—manufacturing still weak.
The ISM Manufacturing PMI remained in contraction in August (48.7)—below the 50 expansion line—signaling ongoing softness in goods demand. That is typically a headwind for the Dow’s cyclical mix. 
3) ES500 (S&P 500) breadth is narrow; concentration risk elevated.
Mega-caps continue to dominate performance and index leadership, while equal-weight underperforms and concentration risk stays high—conditions that historically increase pullback vulnerability. 
4) Valuations are rich versus history.
FactSet’s mid-summer forward 12-month P/E for the S&P 500 hovered well above 5- and 10-year averages (>22x vs. ~19x/17x), leaving less cushion if growth wobbles or margins compress. 
5) Sentiment & seasonality aren’t tailwinds.
September/early Q4 are seasonally tricky—historically the weakest stretch for US equities—just as the market tries to price the path of cuts vs. growth. 
6) Policy & trade headline risk.
Tariff timelines and “reciprocal” duties remain in play (with officials signaling Aug-1 implementation and additional measures possible), a rolling overhang for global cyclicals and exporters tied into the Dow complex. 
Note: Please remember to adjust this trade idea according to your individual trading conditions, including position size, broker-specific price variations, and any relevant external factors. Every trader’s situation is unique, so it’s crucial to tailor your approach to your own risk tolerance and market environment.

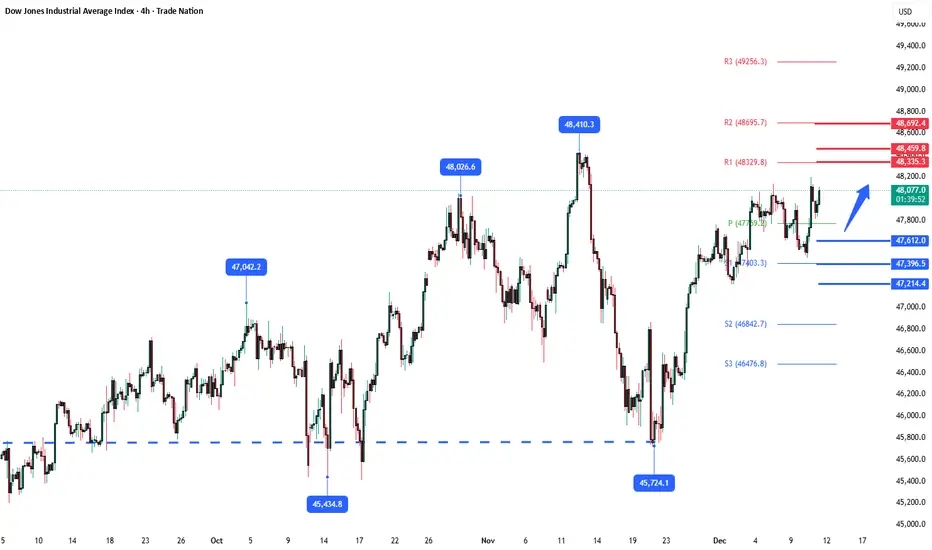
DpwJones Key Trading LevelsKey Support and Resistance Levels
Resistance Level 1: 48335
Resistance Level 2: 48460
Resistance Level 3: 48690
Support Level 1: 47610
Support Level 2: 47390
Support Level 3: 47210
This communication is for informational purposes only and should not be viewed as any form of recommendation as to a particular course of action or as investment advice. It is not intended as an offer or solicitation for the purchase or sale of any financial instrument or as an official confirmation of any transaction. Opinions, estimates and assumptions expressed herein are made as of the date of this communication and are subject to change without notice. This communication has been prepared based upon information, including market prices, data and other information, believed to be reliable; however, Trade Nation does not warrant its completeness or accuracy. All market prices and market data contained in or attached to this communication are indicative and subject to change without notice.
Bullish continuation setup?Dow Jones (US30) is reacting off the pivot and could bounce to the 1st resistance which is a swing high resistance.
Pivot: 47,730.53
1st Support: 47,204.31
1st Resistance: 48,435.66
Disclaimer:
The opinions given above constitute general market commentary and do not constitute the opinion or advice of IC Markets or any form of personal or investment advice.
Any opinions, news, research, analyses, prices, other information, or links to third-party sites contained on this website are provided on an "as-is" basis, are intended to be informative only, and are not advice, a recommendation, research, a record of our trading prices, an offer of, or solicitation for, a transaction in any financial instrument and thus should not be treated as such. The information provided does not involve any specific investment objectives, financial situation, or needs of any specific person who may receive it. Please be aware that past performance is not a reliable indicator of future performance and/or results. Past performance or forward-looking scenarios based upon the reasonable beliefs of the third-party provider are not a guarantee of future performance. Actual results may differ materially from those anticipated in forward-looking or past performance statements. IC Markets makes no representation or warranty and assumes no liability as to the accuracy or completeness of the information provided, nor any loss arising from any investment based on a recommendation, forecast, or any information supplied by any third party.
