Weekly Forex Outlook Sun.Sept.28.2025 - Fri.Oct.3.2025Like and Comments would be appreciated :D Not Financial Advice, Just my outlook/opinion
DJI trade ideas

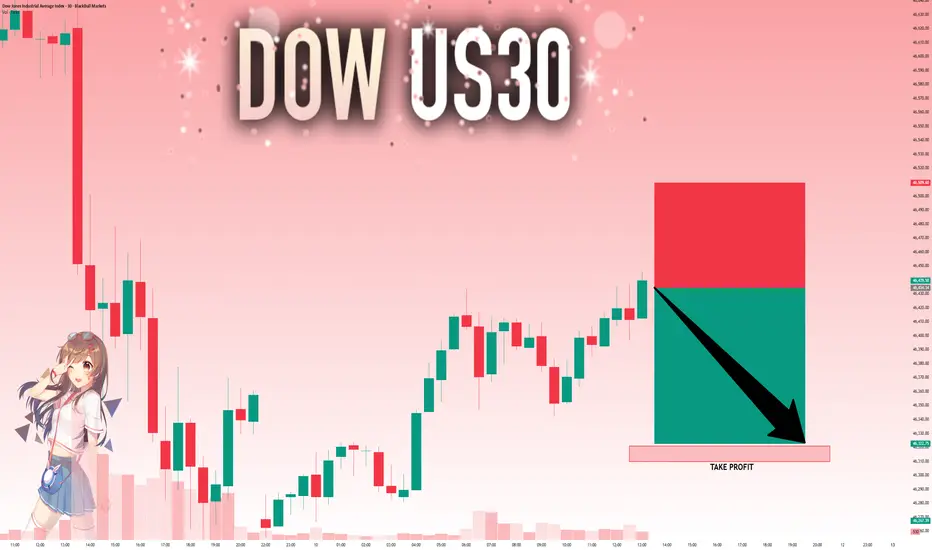
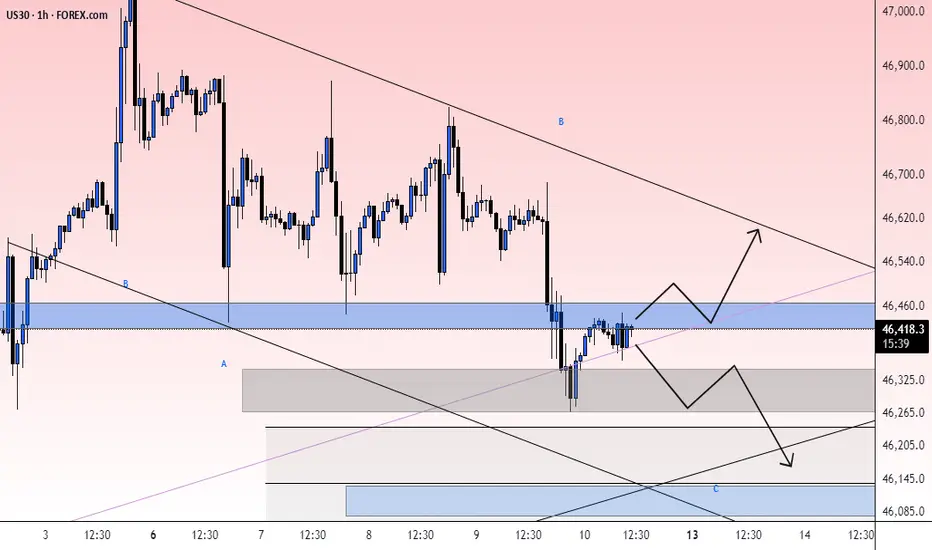
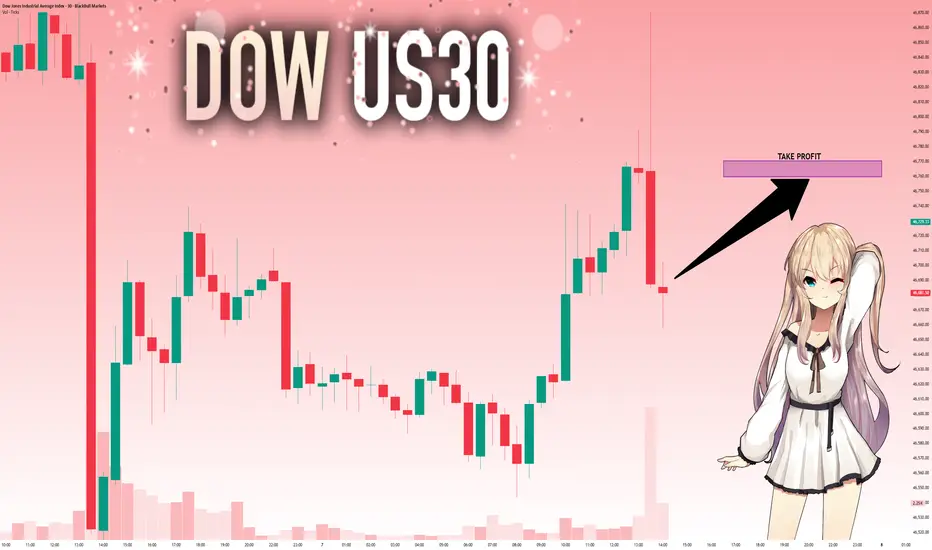
Kwrwshmhmdy4 We saw signs of a decline in the US30 chart last week. And this decline was enough to convince retail traders to enter a sell trade and place a stop at the highest peak. And this is exactly the wrong thing to do, because the market will turn around and hit all the stop losses and with the volume that enters the market, the price will flow down. So the market will first go up and eventually fall more sharply.

US30 Resistance Cluster Above!
HI,Traders !
#US30 made a bearish
Breakout of the support
Cluster of the rising and
Horizontal support levels
Which is now a resistance
Cluster round 46329.8 then
Went down and made a local
Pullback on Thursday and
Friday but we are bearish
Biased mid-term so we
Will be expecting a further
Bearish move down this week !
Comment and subscribe to help us grow !

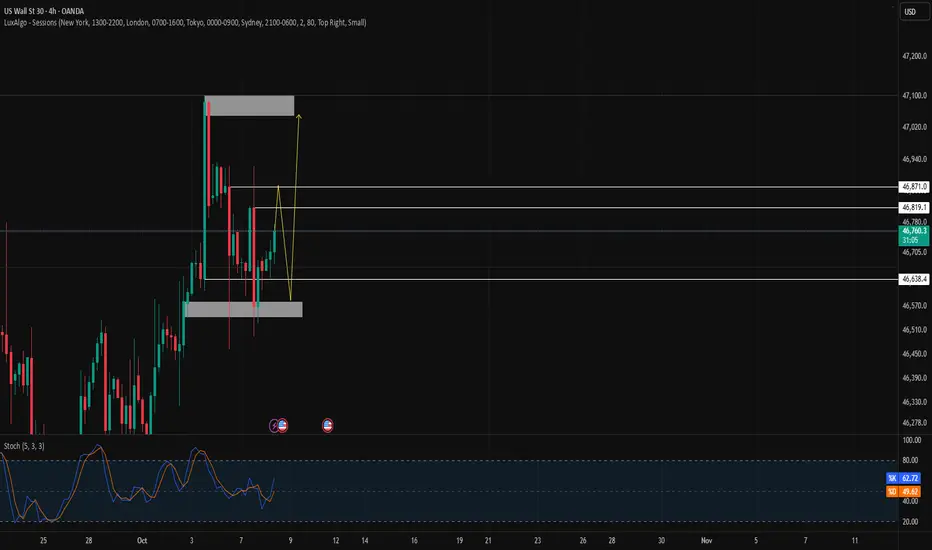
US30 4H🔹 Overall Outlook and Potential Price Movements
In the charts above, we have outlined the overall outlook and possible price movement paths.
As shown, each analysis highlights a key support or resistance zone near the current market price. The market’s reaction to these zones — whether a breakout or rejection — will likely determine the next direction of the price toward the specified levels.
⚠️ Important Note:
The purpose of these trading perspectives is to identify key upcoming price levels and assess potential market reactions. The provided analyses are not trading signals in any way.
✅ Recommendation for Use:
To make effective use of these analyses, it is advised to manually draw the marked zones on your chart. Then, on the 15-minute time frame, monitor the candlestick behavior and look for valid entry triggers before making any trading decisions.

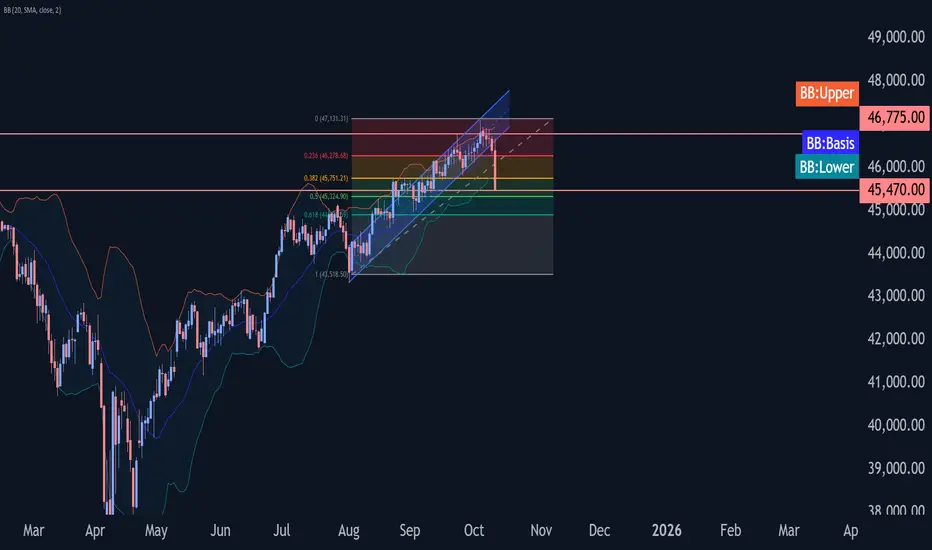
Dow Jones index Wave Analysis – 10 October 2025- Dow Jones index broke daily up channel from
- Likely to fall to support level 45470.00
Dow Jones index recently broke the daily up channel from end of July – which was preceded by the downward reversal from the key resistance level 46775.00 (former monthly high from last month).
The breakout of this up channel from accelerated the active short-term downward correction ii from the start of October from resistance level 46775.00.
Given the strength of the resistance level 46775.00 and the bearish divergence on the daily Stochastic indicator, Dow Jones index can be expected to fall to the next support level 45470.00 (target price for the completion of the active correction (ii)).
US30: Absolute Price Collapse Ahead! Short!
My dear friends,
Today we will analyse US30 together☺️
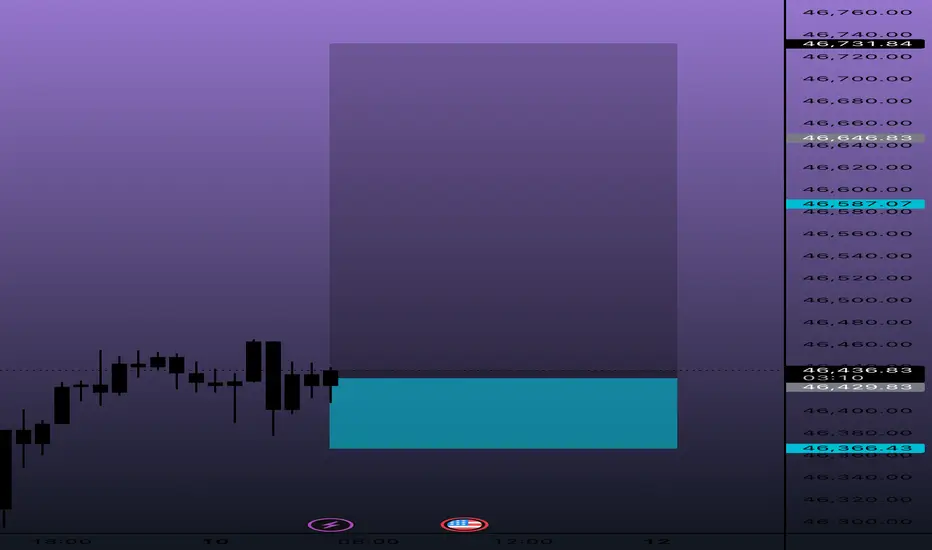
The recent price action suggests a shift in mid-term momentum. A break below the current local range around 46,434.34 will confirm the new direction downwards with the target being the next key level of 46,322.75 and a reconvened placement of a stop-loss beyond the range.
❤️Sending you lots of Love and Hugs❤️
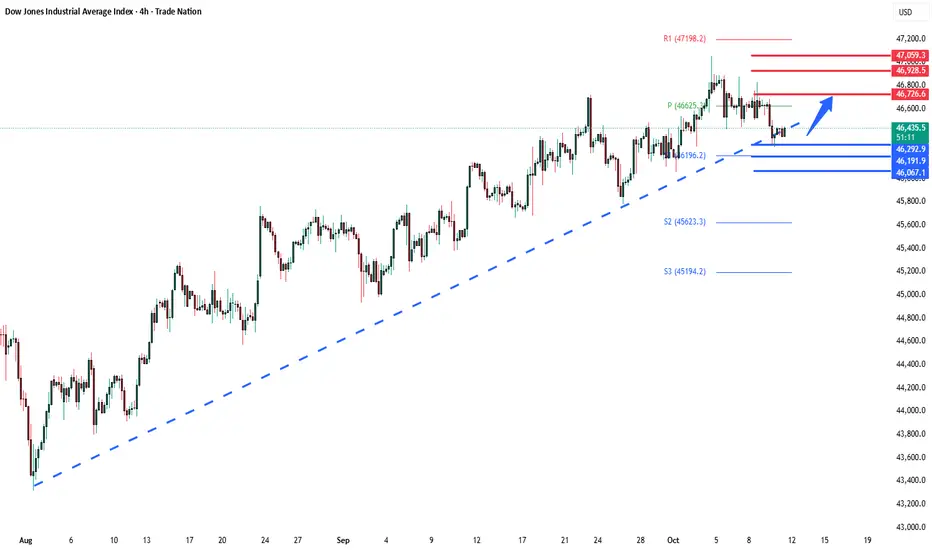
DowJones key trading levels Friday 10th OctoberKey Support and Resistance Levels
Resistance Level 1: 46726
Resistance Level 2: 46930
Resistance Level 3: 47060
Support Level 1: 46290
Support Level 2: 46190
Support Level 3: 46070
This communication is for informational purposes only and should not be viewed as any form of recommendation as to a particular course of action or as investment advice. It is not intended as an offer or solicitation for the purchase or sale of any financial instrument or as an official confirmation of any transaction. Opinions, estimates and assumptions expressed herein are made as of the date of this communication and are subject to change without notice. This communication has been prepared based upon information, including market prices, data and other information, believed to be reliable; however, Trade Nation does not warrant its completeness or accuracy. All market prices and market data contained in or attached to this communication are indicative and subject to change without notice.
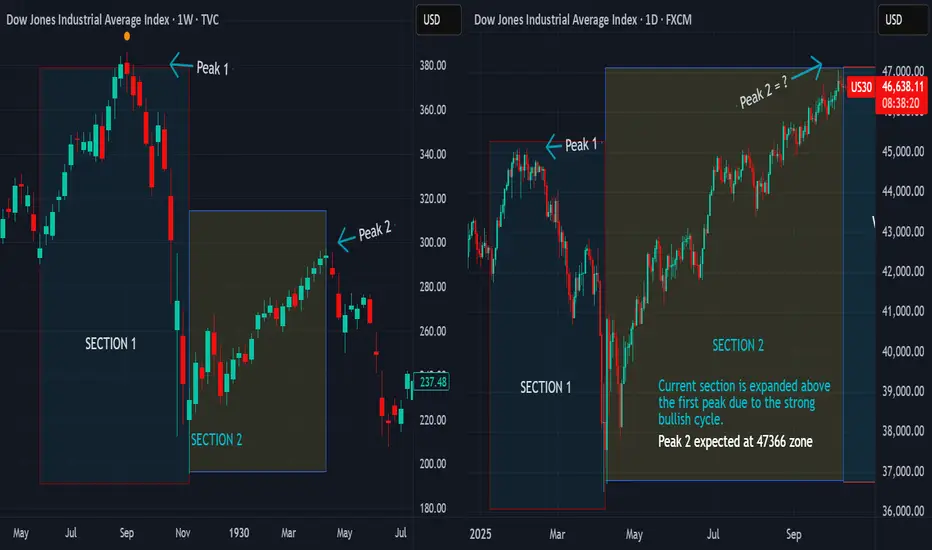
Dow Jones v/s Gold Ratio — History Repeating?Currently both DJI & Gold are at there peak levels, but the ratio has already breached a historical support, signaling further downfall.
Whenever the Dow-to-Gold ratio tests or breaks the 12.0 level, stories are created in history.
* 1929: Great Depression hit — stocks crashed, gold outperformed.
* 1973: Oil shock & stagflation — gold surged as inflation soared.
* 2008: Global Financial Crisis — stocks collapsed, gold became the safe haven.
- 2020: COVID tested the level but failed to break it.
Now, in 2025, the ratio has again breached the historic level of 12.0 — the same zone that preceded past market meltdowns.
Each time stocks looked strong relative to gold, the cycle turned
* Gold rallied.
- Stocks corrected.
----------------------------------------------------------------------------------------------------------------
What is the Dow-to-Gold Ratio?
Dow/Gold Ratio = Value of Dow Jones Index ÷ Price of Gold (per ounce)
This ratio tells us how many ounces of gold it takes to buy one unit of the Dow Jones Industrial Average.
For example:
If Dow = 46,000 and Gold = 4000 → Ratio = 11.5.
That means it takes 11.5 ounces of gold to buy one unit of Dow.
If the ratio falls to 6, which the chart is signaling, then it will mean:
1. Stocks might weaken or
2. Gold might become stronger or
3. If both weaken, then stocks will fall more than gold
----------------------------------------------------------------------------------------------------------------
Interpretation
1. Whenever the ratio is high, it means stocks are expensive compared to gold (risk-on period) .
2. Whenever the ratio falls, it means gold is outperforming stocks (risk-off, crisis or correction phase) .
Overall, the Dow to Gold ratio suggests that this is not a normal period - a period of crisis & correction - a risk-off period
Each time this ratio reached around current levels, a major stock market downturn followed

Us30Last post up…
Full porting for $46,600s run the remains.
Cutting Nasdaq. Go long smack out ,336 into extensions…
Have a great weekend!!!
💼

Us30.Shoot a long here…. Looks worth it…
Last one on the night, time to drink 🥂
Have a great weekend!!!
Everyone!!!! 🧘☺️
check the trendGiven the index is located between the two resistance and support areas, with the price breaking and stabilizing, the continuation of the movement in the same direction is likely.

MARKETS AT CROSSROADS... THE STORIES OF TOMMORROWA picture is worth a thousand words.
We are comparing the 7-months cycle currently unravelling with its fractal counterparts that have repeated with striking periodicity in the past.
We will compare the trends that follow the completion of the cycle in each of the fractals.
Fractal 1 - (28/06/1965 - 07/02/1966) compared to (07/04/2025 to present)
Fractal 2 (19/10/1987 - 16/07/1990) compared to present
Fractal 3 (07/10/2002 - 16/10/2007) compared to present
In the last two shots, we have represented the entire 5-year cycle so we could see the entire picture for a clearer view. It is interesting to note that the last 7-months cycle is itself a fractal of the entire 5-year cycle.
There are several of them but we would represent only three to make the illustrations simpler.
FOR THE TRENDS THAT FOLLOW THE COMPLETION OF THESE FRACTALS...
April 1930 - July 1932
Feb 1966 - October 1966
July 1990 - October 1990
October 2007 - March 2009
5 out of 5 the market corrected at completion of this cycle. Also by observation the declines are sharp and the recoveries are massive, starting a second wave of hyper-bullish trends
TWO OCCASSIONS WHERE THE CORRECTION WAS PROLONGED
WHATS AHEAD...?
Markets are running into a correction, between October 2025 to February 2026, we expect wide asset classes and global indices to stage a correction. The correction should be quick and sudden which likely would complete in April 2026. A second wave of sharp bullish trend would follow into 2027. We expect a second correction that could start from Feb/March 2027 making a bottom in October 2027. This bottom will be the base for the next 5-year hyper-bullish trend completing the entire 13-year Cycle from 2020.
Follow and check back for the price levels breakdown
Trade safe and good luck.
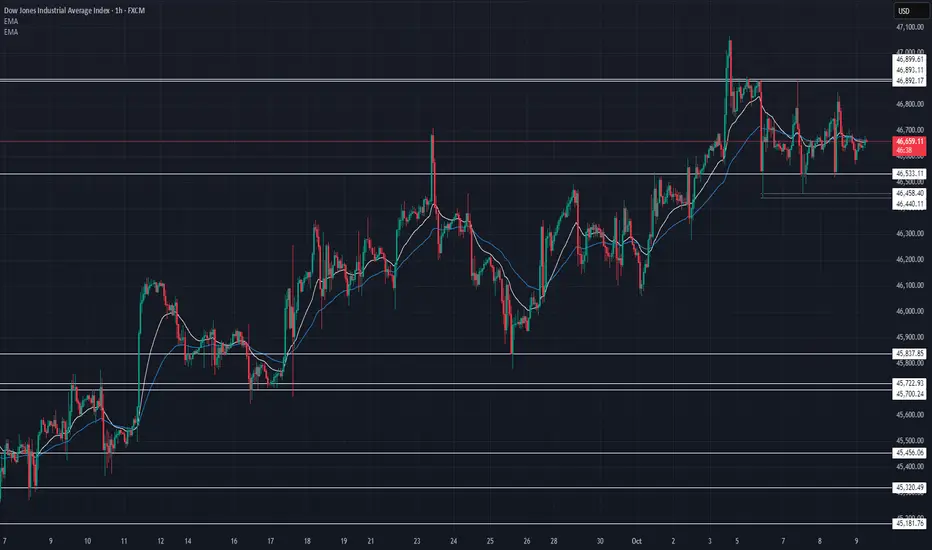
US30 Technical Breakdown – 10/09/2025📍 US30 Technical Breakdown – 10/09/2025
US30 consolidating near 46,650 after rejecting the 46,900 zone 🧱
Momentum slowing — EMAs flattening, signaling indecision between bulls and bears ⚖️
📊 Market Behavior:
🔹 Price ranging between 46,450 – 46,900
🔹 Multiple rejections at 46,900 resistance
🔹 Support holding around 46,500 area
📌 Key Levels:
🔹 Resistance Zones:
46,700 → intraday ceiling
46,892 → major resistance
46,900–47,000 → breakout zone 🚀
🔹 Support Zones:
46,533 → local support
46,440 → key demand area
46,250 → deeper support
45,837 → downside target
🧠 Bias:
Neutral–Bullish ⚖️
➡️ Above 46,700 → retest of 46,900 likely
⬅️ Below 46,440 → bearish move toward 46,250
uptrend The current support level is expected to change and we will see the start of an uptrend. If the index breaks through the support level, a continuation of the downtrend is likely.

Us30 Trade Set Up Oct 8 2025Price is trading between PDH/PDL so i will either want to see a run up to PDH to sweep it and look for internal bearish structure to sell or a sweep of SSL first to then go higher to PDH
www.tradingview.com

DowJones Key trading levels ahead of FOMC minutesKey Support and Resistance Levels
Resistance Level 1: 46930
Resistance Level 2: 47060
Resistance Level 3: 47200
Support Level 1: 46420
Support Level 2: 46290
Support Level 3: 46190
This communication is for informational purposes only and should not be viewed as any form of recommendation as to a particular course of action or as investment advice. It is not intended as an offer or solicitation for the purchase or sale of any financial instrument or as an official confirmation of any transaction. Opinions, estimates and assumptions expressed herein are made as of the date of this communication and are subject to change without notice. This communication has been prepared based upon information, including market prices, data and other information, believed to be reliable; however, Trade Nation does not warrant its completeness or accuracy. All market prices and market data contained in or attached to this communication are indicative and subject to change without notice.

Us30 Chart forecast as on 08/10/2025Looking for bearish movements as for today but daily bias is bullish....
What you think!?

US30: Next Move Is Up! Long!
My dear friends,
Today we will analyse US30 together☺️
The recent price action suggests a shift in mid-term momentum. A break above the current local range around 46,689.60 will confirm the new direction upwards with the target being the next key level of 46,759.66 and a reconvened placement of a stop-loss beyond the range.
❤️Sending you lots of Love and Hugs❤️
Us30 Trade Set Up Oct 7 2025Price is approaching a 4h FVG, if price respects it i will take sells to SSL but if price trades through it i will wait for PDH to be swept before looking for sells
www.tradingview.com


BUY EVERY DIP, HOLD FOR THE NEXT 7-MONTH CYCLE UNTIL OCTOBERThere are the current turmoil by tariffs and perceived recession, yet, the cycles strongly support a further advance from the March lows until October 2025. The bottom in March 2020 formed the base for the 5 year bull cycle nested within the larger 13 year cycle.
PRICE
The 2020 crash low formed at 18213.65, the decline in 2022 formed a bottom at 28660.94. We would have a price range Low - Low of (+10447.29 pts)
(28660.94 - 18213.65) = 10447.29 units
By projection if the range between the first two bottoms is 10447.29 we would expect the third bottom connecting three expanding points to be at 1.618 of 10447.29 points from 28660.94
28660.94 + (10447.29 x 1.618) = 45564.66
This makes the current top at 45073.63 through 45564.66 level a major support whereas its also a minor resistance for some correction and we expect price to move through this level.
TIME
Time connecting the three points 23/03/2020 - 03/01/2022 - 10/10/2022 with March 2020 as starting point would give us a time count (0.0 - 651 days - 931 days).
We find that between the two bottoms the top in Jan 2022 came in at 651 days. By projection we expect the next bottom to be at least 209 weeks or 1463 days from 10/10/2022 with a top located at a Phi variation of 651.
We would project a time range 1064 - 1099 days for a top and a decline into the third bottom 1463 days from 10/10/2022 and 2394 days from 23/03/2020. Trade safe, good luck.
