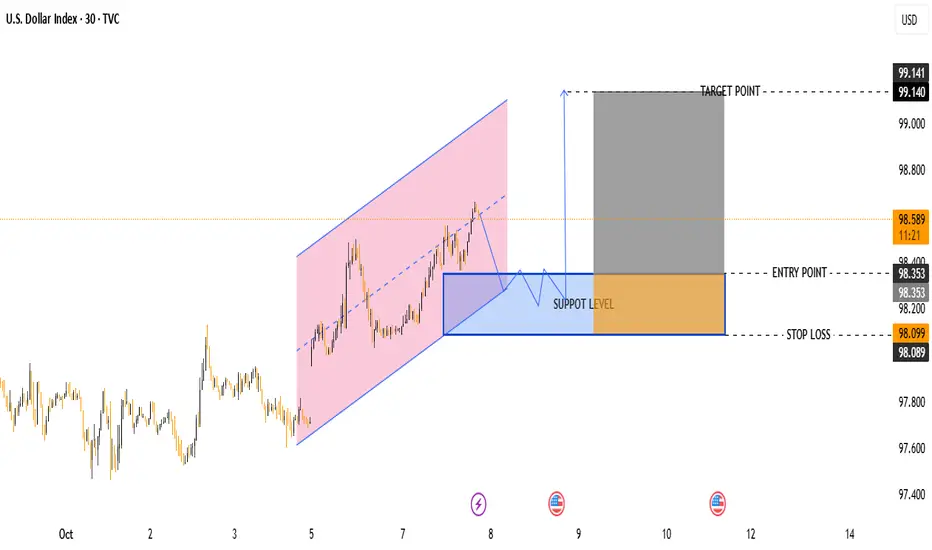
DXY Buy Opportunity – Support Retest Before Next Leg UpPair: U.S. Dollar Index (DXY)
Timeframe: 30 minutes
Current Price: 98.602
Trend: Short-term bullish channel (highlighted in pink)
🧭 Key Levels
Support Zone: 98.100 – 98.350
Entry Point: 98.353 (buy zone confirmation)
Stop Loss: 98.099 (below support)
Target Point: 99.140
📊 Market Structure
About U.S. Dollar Index
The U.S. Dollar Index tracks the strength of the dollar against a basket of major currencies. DXY was originally developed by the U.S. Federal Reserve in 1973 to provide an external bilateral trade-weighted average value of the U.S. dollar against global currencies. U.S. Dollar Index goes up when the U.S. dollar gains "strength" (value), compared to other currencies. The following six currencies are used to calculate the index:
Euro (EUR) 57.6% weight
Japanese yen (JPY) 13.6% weight
Pound sterling (GBP) 11.9% weight
Canadian dollar (CAD) 9.1% weight
Swedish krona (SEK) 4.2% weight
Swiss franc (CHF) 3.6% weight
Euro (EUR) 57.6% weight
Japanese yen (JPY) 13.6% weight
Pound sterling (GBP) 11.9% weight
Canadian dollar (CAD) 9.1% weight
Swedish krona (SEK) 4.2% weight
Swiss franc (CHF) 3.6% weight
Related indices
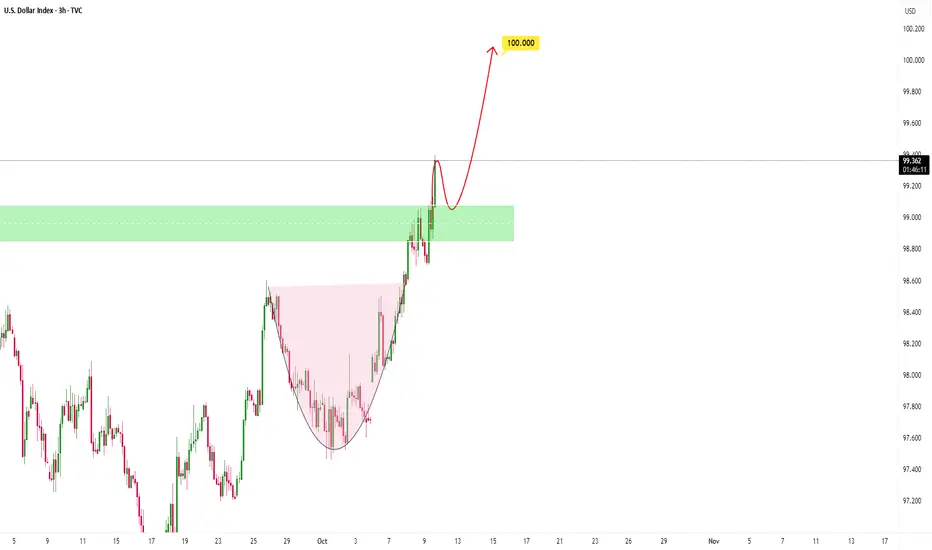
DXY could continue higherPrice has been in a bullish phase, forming a continuation setup showing buyers steadily gaining control after consolidation. The rounded base reflects accumulation, where buyers absorbed selling pressure and built momentum for a breakout.
If buyers manage to hold above the breakout zone, that would
10.10.25 Morning ForecastPairs on Watch -
FX:EURCAD
OANDA:XPTUSD
FX:CADJPY
A short overview of the instruments I am looking at for today, multi-timeframe analysis down to what I will be looking at for an entry. Enjoy!

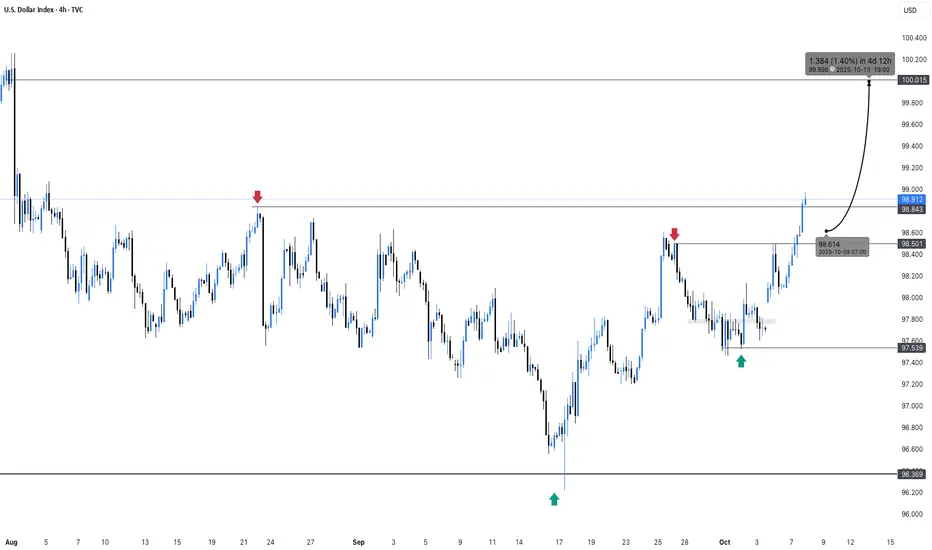
DXY Analysis – Bullish Structure Still IntactIn my latest DXY analysis, I mentioned that the 100.00 level remains the next key target for the U.S. Dollar Index.
After an initial push higher to 99.55, the index faced some selling pressure and is now trading slightly below 99.00.
However, the constructive bullish structure remains intact as long

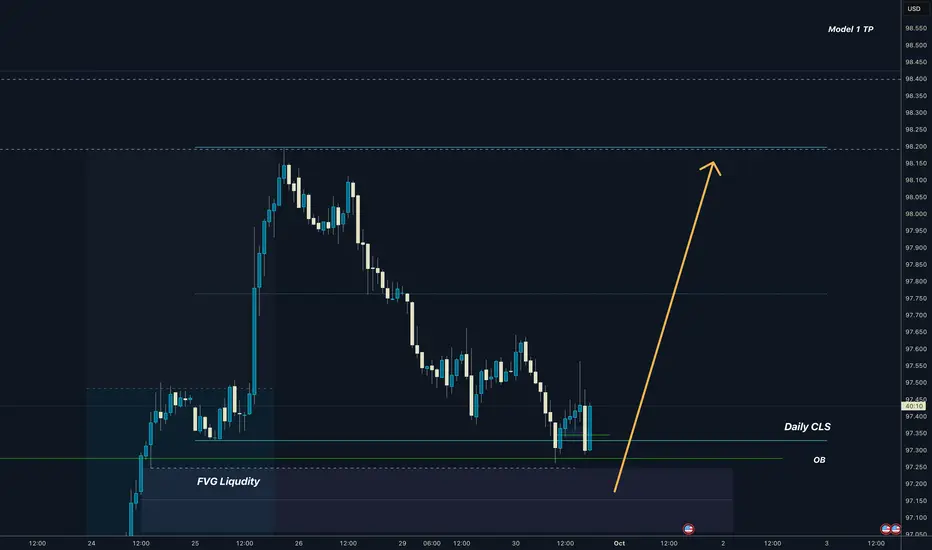
Dollar I Daily CLS I Manipulation I Bullish HTFDollar just manipulated Daily CLS range while HTF bias is nicely bullish
Im still open to the dip to FVG before it goes higher
Big picture view
Adapt useful , Reject useless add what is specifically your own.
Trade safely
Dave
DXY index Near Resistance – Will Powell Trigger the Next Move?To kick off this week, let's take a quick look at the upcoming key indexes in the economic calendar before diving into the DXY analysis ( TVC:DXY ).
On Tuesday, we have Fed Chair Powell speaking, which could stir some excitement in the DXY index and ripple through correlated financial marke
08.10.25 Morning ForecastPairs on Watch -
FX:GBPUSD
FX:EURUSD
A short overview of the instruments I am looking at for today, multi-timeframe analysis down to what I will be looking at for an entry. Enjoy!

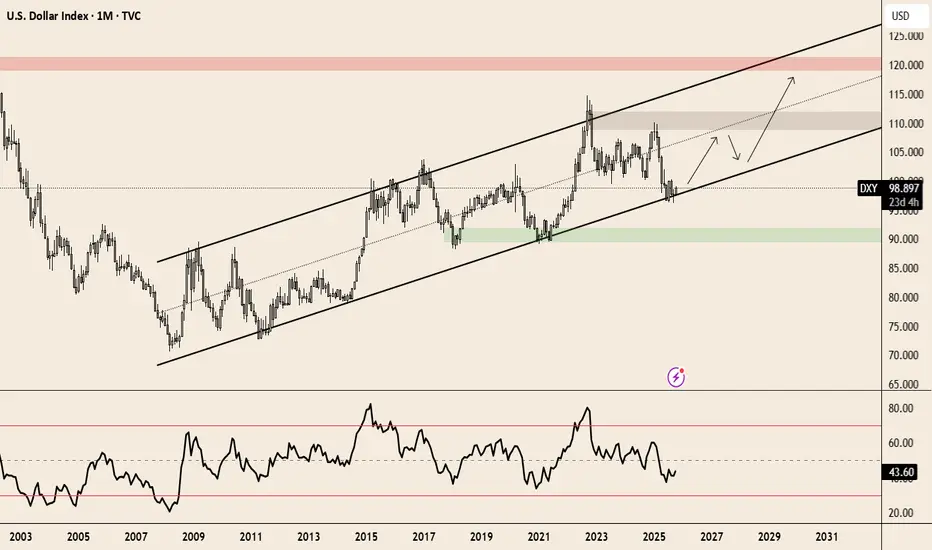
$DXY at a key level: the dollar could reclaim its role as a safeTVC:DXY is currently at a key level.
Historically, when markets enter a phase of euphoria and everything rises simultaneously — TVC:SPX equities, TVC:GOLD gold, CRYPTO:BTCUSD crypto — the dollar tends to reassert itself as a safe-haven asset.
With major indices and technical indicators show
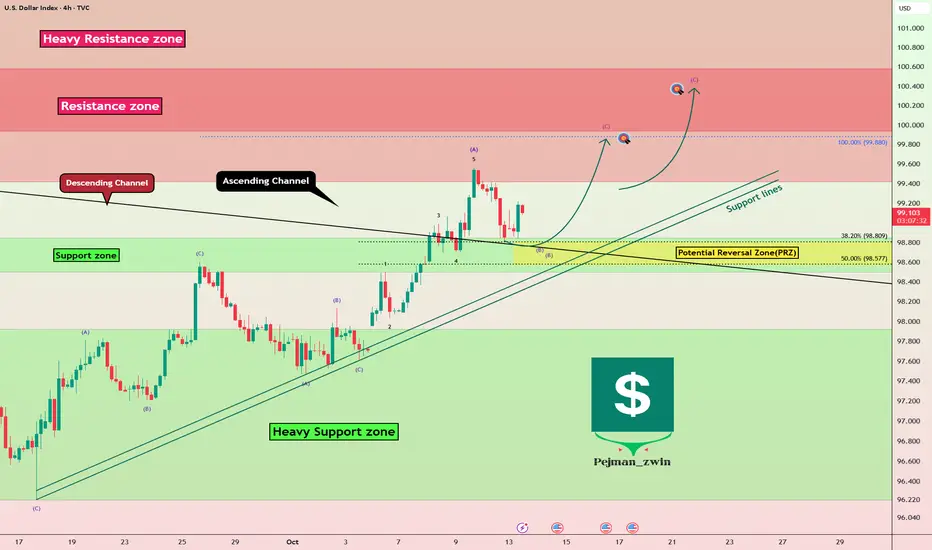
DXY H4 CHARTWe are looking price making a rally targeting the marked supply area of the LTF price structure. It is important to note the many retail traders are coming into the market at this current price area which is late according our strategy.
this rally in price will have a huge impact to the drop of the
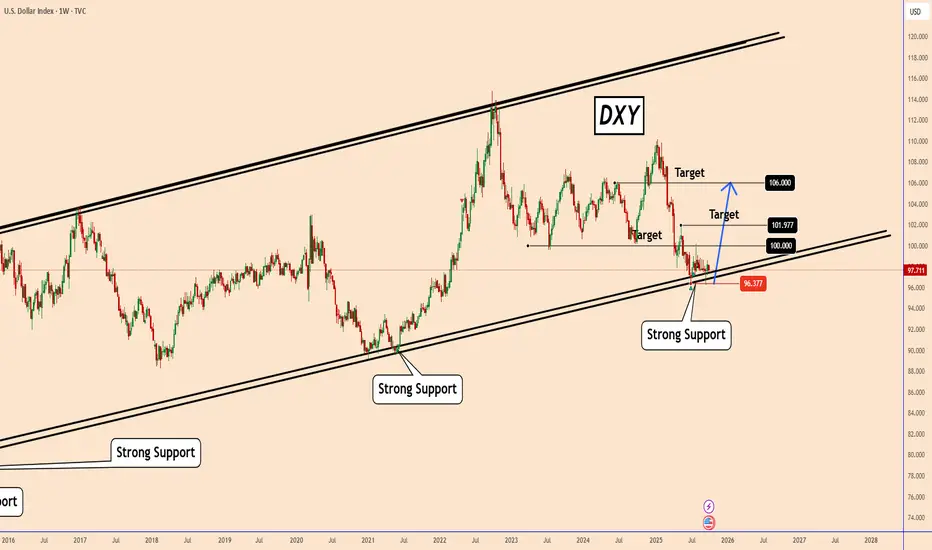
DXY (US Dollar Index): Seen in a Weekly Chart PerspectiveDXY (US Dollar Index): Seen in a Weekly Chart Perspective
The chart shows DXY is sitting on a long-term ascending support line that has held multiple times since 2015. Price recently tested this support again near 96.37, making it a key level.
Price is around 97.70, close to support. This zone is
See all ideas
Summarizing what the indicators are suggesting.
Oscillators
Neutral
SellBuy
Strong sellStrong buy
Strong sellSellNeutralBuyStrong buy
Oscillators
Neutral
SellBuy
Strong sellStrong buy
Strong sellSellNeutralBuyStrong buy
Summary
Neutral
SellBuy
Strong sellStrong buy
Strong sellSellNeutralBuyStrong buy
Summary
Neutral
SellBuy
Strong sellStrong buy
Strong sellSellNeutralBuyStrong buy
Summary
Neutral
SellBuy
Strong sellStrong buy
Strong sellSellNeutralBuyStrong buy
Moving Averages
Neutral
SellBuy
Strong sellStrong buy
Strong sellSellNeutralBuyStrong buy
Moving Averages
Neutral
SellBuy
Strong sellStrong buy
Strong sellSellNeutralBuyStrong buy
Displays a symbol's price movements over previous years to identify recurring trends.
Frequently Asked Questions
The current value of U.S. Dollar Index is 98.926 USD — it has risen by 0.10% in the past 24 hours. Track the index more closely on the U.S. Dollar Index chart.
U.S. Dollar Index reached its highest quote on Feb 25, 1985 — 164.720 USD. See more data on the U.S. Dollar Index chart.
The lowest ever quote of U.S. Dollar Index is 70.698 USD. It was reached on Mar 17, 2008. See more data on the U.S. Dollar Index chart.
U.S. Dollar Index value has increased by 1.28% in the past week, since last month it has shown a 1.87% increase, and over the year it's decreased by −4.15%. Keep track of all changes on the U.S. Dollar Index chart.
U.S. Dollar Index is just a number that lets you track performance of the instruments comprising the index, so you can't invest in it directly. But you can buy U.S. Dollar Index futures or funds or invest in its components.