DXY - will we see a bullish divergence?Hello, dear traders. We can observe an interesting situation on the Dollar Index.
What we see:
1. An uptrend on the weekly timeframe.
2. The price is at the support level.
3. Over the 18 years of this trend, all impulses from the support level originated after MACD divergence. For divergence, we need at least two troughs, but now we are seeing only one.
Therefore, I expect another decline in the Dollar Index with an update of the low on closed weekly candles. After that, for a reversal according to my author's FRL concept, it is necessary to form a multi-day reversal pattern. At the moment, the neck level is at 100.200, as this is where the last impulse of the last downtrend originated. If the price does indeed update the low and form a divergence, the neck level will be at 99.500.
How do you rate this idea and what are your thoughts on it?
Trade ideas

DXY FRGNT Daily Forecast - Q4 | W44 | D30| Y25 |📅 Q4 | W44 | D30| Y25 |
📊 DXY FRGNT Daily Forecast
🔍 Analysis Approach:
I’m applying Smart Money Concepts, focusing on:
Identifying Points of Interest on the Higher Time Frames (HTFs) 🕰️
Using those POIs to define a clear trading range 📐
Refining those zones on Lower Time Frames (LTFs) 🔎
Waiting for a Break of Structure (BoS) for confirmation ✅
This method allows me to stay precise, disciplined, and aligned with the market narrative, rather than chasing price.
💡 My Motto:
"Capital management, discipline, and consistency in your trading edge."
A positive risk-to-reward ratio, paired with a high win rate, is the backbone of any solid trading plan 📈🔐
⚠️ Losses?
They’re part of the mathematical game of trading 🎲
They don’t define you — they’re necessary, they happen, and we move forward 📊➡️
🙏 I appreciate you taking the time to review my Daily Forecast.
Stay sharp, stay consistent, and protect your capital
— FRNGT 🚀
TVC:DXY


DOLLAR INDEX (DXY): Consolidation Ahead of FOMC
Dollar Index weakens ahead of FED rate decision today.
The market formed a symmetrical triangle pattern on a daily.
A breakout of one of its boundaries after an interest rate decision
announcement will accurately indicate a future direction of the market.
❤️Please, support my work with like, thank you!❤️
I am part of Trade Nation's Influencer program and receive a monthly fee for using their TradingView charts in my analysis.

DXY Daily Outlook — Bullish Order Flow Toward Equal HighsHello traders 👋
On the DXY daily chart, we can clearly see that price showed a strong bullish reaction after grabbing liquidity below 96.37, initiating a bullish order flow that, in my view, is still in progress.
The equal highs above the current price act as a potential draw on liquidity and serve as my first bullish target.
However, keep an eye on the trendline liquidity forming below the current price — there’s a possibility that price may sweep this liquidity before continuing higher.
Overall, my bias remains bullish for now.
💌It is my honor to share your comments with me💌
🔎 DYOR
💡Wait for the update!

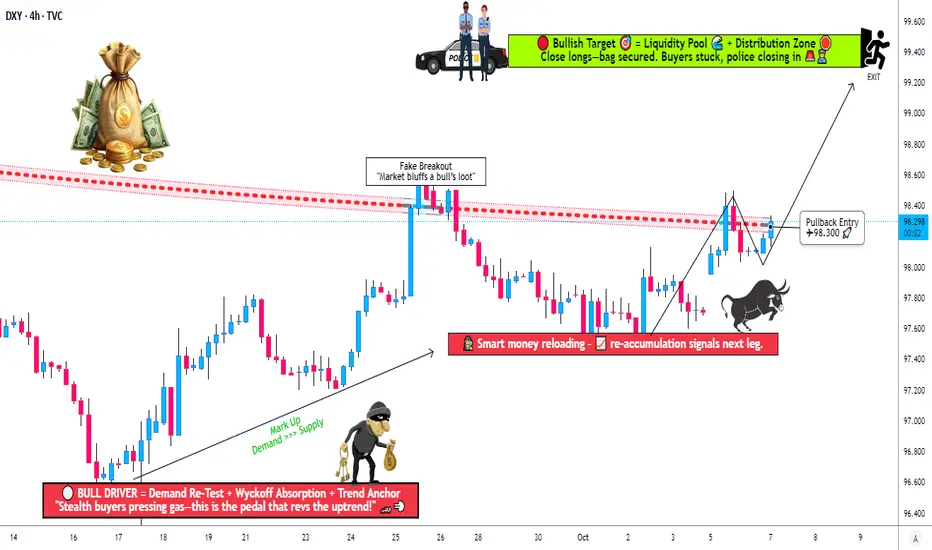
DXY Breakout Confirmed — How Far Can Bulls Run?💰 Thief’s Heist: DXY Bull Raid in Progress ⚡ Layered Entry Strategy!
📈 Setup Summary
Asset: DXY Dollar Index (Cash)
📊 Bias / Plan: BULLISH — 0.786 Triangular Moving Average was breached by buyers → trend confirmation in progress 🚀
🎯 Thief’s Game Plan (Swing / Day Trade)
🕵️ Entry Plan — “Layered Thief Style”:
💎 Any price level entry is valid — flexibility is the Thief’s advantage!
🔹 Sample Limit Layers:
• 97.800
• 98.000
• 98.200
(💡 You can increase or reduce layers based on your own style — stack smartly!)
🧨 Stop Loss (Thief SL):
⚠️ 97.400 → This is the “Thief SL Zone”
👉 But you’re the mastermind — set your own SL if you prefer!
💰 Target Zone (TP):
🚧 Police Barricade at ~99.400 — strong resistance area + oversold trap likely
💨 Thieves escape with bags before the trap closes!
⚙️ Take profit partially or fully at your own comfort — be swift, be smart 🦅
🧩 Market Insight & Technical Reasoning
✅ 786 Triangular MA breach confirms bullish structure
✅ DXY strength often follows Treasury Yield push 📈
✅ Strong USD = Weak Gold & EUR/USD usually
✅ Oversold readings hint buyers ready to counter attack
🔗 Correlation Watchlist (Related Pairs)
Keep an eye on these for confirmation 🔍
💶 FX:EURUSD → usually inverse to DXY
💷 FX:GBPUSD → tracks EUR/USD correlation
💴 FX:USDJPY → directly correlates with DXY
🥇 Gold ( OANDA:XAUUSD ) → moves opposite to DXY
💵 TVC:US10Y Yields → rising yields = bullish DXY
💡 Key Tip:
When EUR/USD & GBP/USD drop sharply + yields rise → DXY often continues its rally 🧭
⚠️ Notes & Thief Disclaimers
👑 Dear Ladies & Gentlemen (Thief OGs):
I’m not recommending my SL or TP — make your own risk rules 💼
You can make money, take money, or just watch the play unfold 🎭
This is a “Thief Style” strategy, shared for fun & educational inspiration only 🧠
Always manage risk & protect capital first — thieves survive by escaping, not over-staying 💨
✨ “If you find value in my analysis, a 👍 and 🚀 boost is much appreciated — it helps me share more setups with the community!”
Disclaimer: this is thief style trading strategy just for fun
#DXY #USDIndex #Dollar #Forex #LayeredEntry #SwingTrade #DayTrade #ThiefStrategy #TrendBreak #SmartMoney #TechnicalAnalysis #USD #TradingView #FXStrategy
DXY FRGNT Daily Forecast -Q4 | W44 | D31| Y25 |📅 Q4 | W44 | D31| Y25 |
📊 DXY FRGNT Daily Forecast
🔍 Analysis Approach:
I’m applying Smart Money Concepts, focusing on:
Identifying Points of Interest on the Higher Time Frames (HTFs) 🕰️
Using those POIs to define a clear trading range 📐
Refining those zones on Lower Time Frames (LTFs) 🔎
Waiting for a Break of Structure (BoS) for confirmation ✅
This method allows me to stay precise, disciplined, and aligned with the market narrative, rather than chasing price.
💡 My Motto:
"Capital management, discipline, and consistency in your trading edge."
A positive risk-to-reward ratio, paired with a high win rate, is the backbone of any solid trading plan 📈🔐
⚠️ Losses?
They’re part of the mathematical game of trading 🎲
They don’t define you — they’re necessary, they happen, and we move forward 📊➡️
🙏 I appreciate you taking the time to review my Daily Forecast.
Stay sharp, stay consistent, and protect your capital
— FRNGT 🚀
TVC:DXY

DOLLAR INDEX (DXY): More Growth Ahead
A quick follow-up for the yesterday's idea for Dollar Index.
The market successfully violated a resistance line of a symmetrical triangle
pattern on a daily time frame.
We see its retest this morning.
A confirmed bullish CHoCH on an hourly time frame gives us a strong
intraday bullish confirmation.
There is a high chance that the Index will continue rising.
Goal - 99.35
❤️Please, support my work with like, thank you!❤️
I am part of Trade Nation's Influencer program and receive a monthly fee for using their TradingView charts in my analysis.

DXY Breakout Beyond 98.6 — Fed Cuts 25bps, New Structural Terrai🧭 Context
The U.S. Dollar Index (DXY) has pushed above 98.6 for the first time , powered by heavy institutional volume and a fresh wave of macro catalysts.
The Federal Reserve delivered a 25 bps rate cut, bringing the federal funds target range to 4.75 – 5.00 % — its first reduction since the easing cycle began in September.
Chair Jerome Powell reiterated that further cuts will depend on data trajectory, particularly inflation and employment stability.
Bond markets reacted swiftly:
10-year Treasury yield: dipped from 4.18 % → 4.05 %.
S&P 500 futures: modestly higher (+0.3 %) as lower yields eased risk pressure.
Gold (XAU/USD): steady near $2 435 as traders weighed dollar strength against yield softness.
📊 Technical Frame
If close > 98.80: confirms bullish structural regime — fresh momentum across USD pairs.
If re-enter < 98.60: false break → likely liquidity retest.
Volume expansion validates the move
Cross-asset implication: risk pairs (EUR/USD, XAU/USD, BTC/USD) now operate on new structural geometry.
🗓 Fundamental Pulse
✅ Today: FOMC Rate Decision (-25 bps)
🕓 Powell Presser: cautious tone, data-dependent policy
📅 Tomorrow: U.S. GDP (Q3 advance) + Unemployment Claims
📅 Friday: Core PCE — key Fed inflation gauge
Each print will shape the next confirmation wave of this breakout.
💭 Mindset
News creates noise. Structure creates order.
Volume shows intent, but confirmation proves it.
The disciplined trader waits for structure to speak before taking action.
— CORE5DAN
Institutional Logic. Modern Technology. Real Freedom.

Dxy Analysis Pre-FOMC 29-Oct-25The Dxy has been rejecting the 99 level since last week.
With the lack of economic data due to US Government Shutdown, the markets main focus now is on todays FOMC meeting.
25Bps is already priced in, so what will be more important is the tone and forward guidance we could get from Jerome Powell.
* If we see a surprising 50Bps cut, or the 25 bps cut with dovish tone: this could lead dollar index to break below 98.3 & test the 97.3 level. Even with potential to break lower into the 96 price level once again.
* 25bps with neutral tone: Since already priced in, and nothing new will be given to the markets, Dxy could be testing the 99 level, and keep trading in a consolidation range between the 98 and 99.
* No cut, or 25bps with hawkish tone: Dxy could break above the 99 price level, with next area of interest to test which is the 100 level.
Disclaimer: easyMarkets Account on TradingView allows you to combine easyMarkets industry leading conditions, regulated trading and tight fixed spreads with TradingView's powerful social network for traders, advanced charting and analytics. Access no slippage on limit orders, tight fixed spreads, negative balance protection, no hidden fees or commission, and seamless integration.
Any opinions, news, research, analyses, prices, other information, or links to third-party sites contained on this website are provided on an "as-is" basis, are intended only to be informative, is not an advice nor a recommendation, nor research, or a record of our trading prices, or an offer of, or solicitation for a transaction in any financial instrument and thus should not be treated as such. The information provided does not involve any specific investment objectives, financial situation and needs of any specific person who may receive it. Please be aware, that past performance is not a reliable indicator of future performance and/or results. Past Performance or Forward-looking scenarios based upon the reasonable beliefs of the third-party provider are not a guarantee of future performance. Actual results may differ materially from those anticipated in forward-looking or past performance statements. easyMarkets makes no representation or warranty and assumes no liability as to the accuracy or completeness of the information provided, nor any loss arising from any investment based on a recommendation, forecast or any information supplied by any third-party.
Risk Warning: 74% of retail investor accounts lose money when trading CFDs with this provider. You should consider whether you can afford to take the high risk of losing your money. Please refer to our full risk disclaimer on our website.

DXY BuysDollar bullish on weekly. Price has been correcting for a few weeks to the downside. Momentum is shifting to buys on higher time frame. Price is in key areas for buys. Manage Risk!

DXY Approaching 98.900 — Weak Labor Market Could Push Fed DovishHey Traders, in today’s trading session we’re monitoring DXY for a potential selling opportunity around the 98.900 zone.
The index continues to trade within a descending channel and is currently in a correction phase, approaching the upper boundary near 98.900, which aligns with channel resistance.
Fundamentals: Recent data continues to show signs of a weakening U.S. labor market, with job growth slowing and unemployment ticking higher. This softening backdrop increases pressure on the Federal Reserve to adopt a more dovish stance in upcoming meetings, potentially weighing further on the dollar.
Next move: Watching for bearish confirmations around the 98.900 zone — rejection here could resume the broader downtrend.
💬 What’s your outlook on the Fed’s next move? Drop your thoughts in the comments!

EU Session Low supportlineDXY is hitting resistance line within PL 99.00, entry was delayed a bit, compensated with flexed SL

DOVISH FED RATE THREAT-SELL TO BUYMONTHLY-Bullish respect candle
WEEKLY-bullish low probability leg/liquidity leg
Daily-Bullish orderflow with bullish context
H1 OB,ENTRY Time frame

DXY RISING TRENDLINE BELOW|LONG|
✅DXY Price is respecting the rising trendline, showing consistent higher lows. Expect bullish continuation toward the target zone after the retest, as price seeks to rebalance inefficiency left from prior impulsive moves. Time Frame 7H.
LONG🚀
✅Like and subscribe to never miss a new idea!✅

DXY Bullish move 99.00 (Readmore)...💹 #DXY Analysis (1H Timeframe) 💹
🟢 Bullish Momentum Building Up!
Price showing strong buying pressure from the key support zone at 99.00 📈
🎯 Technical Targets:
1️⃣ 99.300 – First target
2️⃣ 99.500 – Second target
📊 As long as price holds above 99.00, bullish bias remains intact.
#DXY #USDIndex #Forex #TechnicalAnalysis #PriceAction #TradingSetup 🚀

General Market OutlookHello, I want to talk about markets in general before the week start.
The Federal Reserve is trying to navigate with limited data. Recently, after Governor Waller used ADP data without authorization, the Fed lost access to ADP’s high-frequency employment data as well.
CPI and core CPI both came in at 3%, slightly below market expectations but in line with Cleveland Fed and Bloomberg models. With inflation not overheating, there is little reason for the Fed to delay rate cuts in its remaining two meetings this year, though these cuts are likely already priced in. The real focus will be on what FED will do in 2026.
This week brings meetings from the Fed, ECB, BOJ, and BOC, while the Trump–Xi talks will take center stage. For me, the most important event will be the US–China negotiations. China holds a structural advantage: its exports have remained resilient despite US tariffs, supported by rising trade with South America, Africa, the EU, and South Asia. Meanwhile, the US remains heavily dependent on China for rare earths, a situation unlikely to change soon. However, China’s top priority remains its economy, which should keep the door open for compromise and negotiations.
Also, keep an eye on the shutdown situation and upcoming earnings reports.
US bond yield is falling, now a battle around 4% is ongoing for 10-y yield. If it bounced from 3.85% trendline dollar might try to recover, but so far I don't see any reason for a dollar jump, rather the tight range between the trendline from 2011 and 100 resistance likely to continue.
EURUSD is trying to recover with slighlty bullish trend but this trend could turn into flag formation easily if dollar index to make a move towards 100. I expect EURUSD to continue recover with strong data from EU and weaker data from US. If shutdown extends further, both stock market and dollar might turn bearish.
There’s nothing new to add for USDJPY beyond the previous analysis. If the base case scenario unfolds, it will support the dollar index retesting its trendline in the coming weeks.
Nasdaq is still trending high with insane amount of AI investments and better than expected earnings. High valuations, shutdown and China fears are not in the spotlight yet. As long as Nasdaq trend channel continues, no reason to back out bullishness, but careful if it break because corrections often came very hard.
Crypto market is yet to recover after the massive sudden crash. Bitcoin is less effected, but still has a problem. If 114k regained, maybe signs of recovery will be more clear. But the danger is not over yet.
My base case for gold to hold above 4000 and recover towards 4250. 4160 is a key resistance this week. I expect gold is getting to a long term peak, likely to hit before the year end but still has some way to go. I will write about Silver's long term cycle in a couple of days so stay tuned for that.

Forex Traders Focus on Central Bank DecisionsForex Traders Focus on Central Bank Decisions
As expected, the Federal Reserve yesterday cut the Federal Funds Rate from 4.25% to 4.00%, while Jerome Powell’s remarks reduced the likelihood of further rate cuts. Meanwhile, decisions by other key central banks are also influencing the currency markets, according to Forex Factory:
→ The Bank of Canada lowered its policy rate from 2.50% to 2.25%, in line with market expectations. Its official statement highlighted risks of slower GDP growth, “continued weakness in the economy”, and concerns over U.S. trade relations and tariffs.
→ The Bank of Japan (BoJ) kept interest rates unchanged but signalled readiness to raise borrowing costs if economic conditions allow. This has shifted traders’ focus towards a possible rate hike as early as December.
→ The European Central Bank (ECB) is expected to leave its key rate steady, with the decision due at 16:15 GMT+3 today.
→ Next week, both the Reserve Bank of Australia and the Bank of England are scheduled to announce their policy decisions.
Against this backdrop, attention is increasingly turning to the Dollar Index (DXY) chart today.
Technical Analysis of the DXY Chart
On 19 September, we conducted a key analysis of the DXY chart, noting that:
→ The long-term downward channel (shown in red) remains relevant, divided into quarters by the intermediate QL and QH lines.
→ The index had rebounded from the QL line (marked by an arrow).
→ A bullish scenario was emerging.
Following that rebound, the price began to form an upward trajectory, reaching the upper boundary of the channel by 10 October — which, as anticipated, acted as strong resistance.
Currently, the DXY chart displays a narrowing triangle pattern, where:
→ The resistance is defined by the upper edge of the long-term descending channel that has contained the index’s 2025 movements.
→ The short-term upward channel from the September low remains intact.
This formation may reflect both the current balance of the U.S. dollar against a basket of major currencies and the uncertainty among analysts about its future direction.
Given the combination of central bank decisions, the U.S. government shutdown, geopolitical risks, and trade tensions, a breakout from this triangle could mark the start of a major trend lasting several weeks or even months.
Yesterday’s Fed decision strengthened the dollar, breaking through a local Bullish Flag pattern (shown in blue) and increasing the likelihood of further upward momentum.
This article represents the opinion of the Companies operating under the FXOpen brand only. It is not to be construed as an offer, solicitation, or recommendation with respect to products and services provided by the Companies operating under the FXOpen brand, nor is it to be considered financial advice.

DXY Bullish outlookdxy h4 making higher highs and higher lows .
Price traded into and respected the daily bullish OB + FVG + IFVG
Targeting big figure 100.000

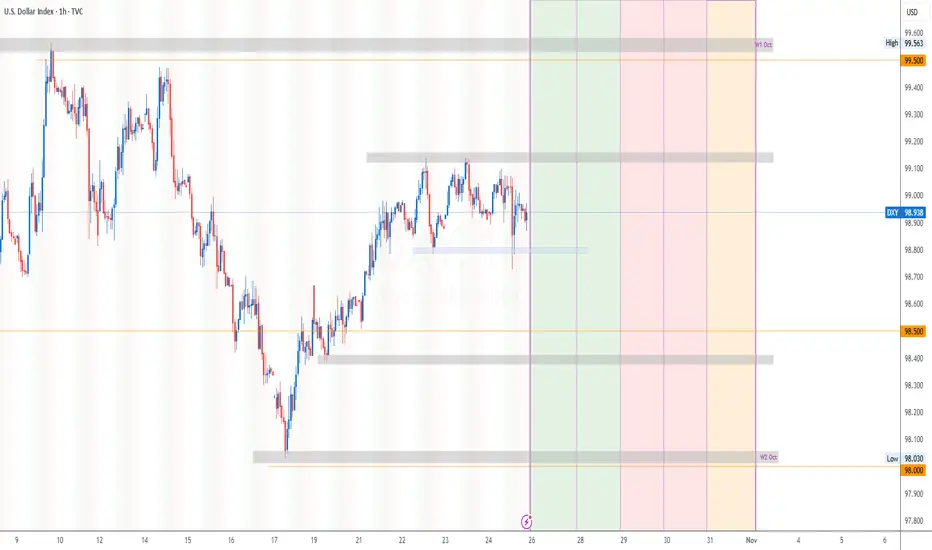
DXY key levels to look out for this week (WC 26/10)DXY key levels for the following week ahead.
Key fundementals this week includes FOMC on Wednesday highlighted in red, and Euro main refinancing Rate on Thursday 1315.
Looking at the 4hTF, we are currently ranging at this moment between 98.80 support and 99.10 Wednesdays HL.
DXY FRGNT Daily Forecast -Q4 | W44 | D29| Y25 |📅 Q4 | W44 | D29| Y25 |
📊 DXY FRGNT Daily Forecast
🔍 Analysis Approach:
I’m applying Smart Money Concepts, focusing on:
Identifying Points of Interest on the Higher Time Frames (HTFs) 🕰️
Using those POIs to define a clear trading range 📐
Refining those zones on Lower Time Frames (LTFs) 🔎
Waiting for a Break of Structure (BoS) for confirmation ✅
This method allows me to stay precise, disciplined, and aligned with the market narrative, rather than chasing price.
💡 My Motto:
"Capital management, discipline, and consistency in your trading edge."
A positive risk-to-reward ratio, paired with a high win rate, is the backbone of any solid trading plan 📈🔐
⚠️ Losses?
They’re part of the mathematical game of trading 🎲
They don’t define you — they’re necessary, they happen, and we move forward 📊➡️
🙏 I appreciate you taking the time to review my Daily Forecast.
Stay sharp, stay consistent, and protect your capital
— FRNGT 🚀
TVC:DXY

U.S. Dollar Index | Countertrend Break Aligning Toward ExpansionThe Market Flow | October 26, 2025
Technical Overview
Monthly:
• The bearish countertrend from the 108.50 pivot remains active but is slowing after completing a 138.2% Fibonacci projection.
• Price structure is consolidating above the 95.99 breakout base, showing early signs of phase rotation.
• A monthly close above 100.80 would confirm a higher timeframe structural shift.
Weekly:
• The down impulse reached the 138.2% target near 95.99 and turned higher into corrective structure.
• The active weekly pivot at 98.54 defines current bias.
• The correction phase persists toward the 38.2% retracement at 101.43 , with 106.64 as weekly expansion resistance.
• Structure favors continuation within a developing countertrend recovery channel.
Daily:
• The daily trend remains bullish above 98.54 , with higher lows intact.
• Price currently trades within the 61.8% Fibonacci retracement zone (98.75–98.85) , overlapping with the H4 expansion base — a structural sweet spot of alignment between the daily and H4 expansion phases.
• A sustained move above the green countertrend line confirms continuation toward 99.97 → 100.81 → 101.43 .
• The active daily pivot at 98.12 defines primary invalidation for the short-term bullish structure.
H4:
• Consolidation within the 61.8% Fibonacci zone supports accumulation before potential expansion.
• A confirmed H4 close above 99.25 (EXP) initiates the expansion phase toward 99.97 → 100.81 → 101.43 → 101.94 .
• Failure to hold 98.12 (D Pivot) neutralizes the short-term phase alignment and reopens 97.70 .
Trade Structure & Levels
• Bias: Long above 97.70
• Trigger = H4 > 99.25 → clean H4 breakdown (EXP line)
• Primary Invalidation = 98.12 (D Pivot)
• Secondary Invalidation = 98.54 (W Pivot)
• Path → 99.97 → 100.81 → 101.43
• Phase: Countertrend Break → Expansion Setup (Daily–H4 Confluence Zone)
Risk & Event Context
• U.S. macro data (PCE inflation, Treasury auctions, and Fed commentary) may drive volatility near key resistance zones.
• Momentum confirmation above 99.25 aligns all active timeframes in expansion phase.
Conclusion
DXY sits within a confluence of daily and H4 61.8% target Fibonacci zone — a structural sweet spot supporting continuation of the expansion phase. A H4 break above 99.25 would validate alignment across both timeframes, targeting the 100–101.40 zone.

DXYBearish momentum expected as we on a strong supply zone and the next move would be our strong demand zone. Just price action as cot report is not out for two weeks now.
