Nobody saw that comingIn the coming months, I expect the following catalysts
1. Oil coming down, already there are discussions about removing Russia from OPEC
2. 10 Yr coming down, currently forming an H&S
3. FED adopt a more conservative strategy for interest rates going into 2023
4. Massive short squeeze on tech, High short interest rate there!
5. Rotation from oil to tech
45% are comparing this to .com and the other 45% to 08. Guess what the market likes to do...
This is not investment advice, do your own research!!!
Look First / Then Leap
Trade ideas

Daily Market Update for 5/31Summary: The sentiment was mixed on the last day of trading for the month of May with some warning that the current rally will be short-lived. The shifting sentiment caused indexes to chop up and down throughout the day.
Notes
Ideas always welcome in the comments. Errors will be amended as comments on TradingView or corrected inline in my blog.
-=x=-=x=-=x=-=x=-=x=-=x=-=x=-
Tuesday, May 31, 2022
Facts: -0.41%, Volume higher, Closing Range: 56%, Body: 23% Red
Good: Higher high, higher low
Bad: Couldn't hold onto gain, decline on higher volume
Highs/Lows: Higher high, Higher low
Candle: Thin red body in top half of candle
Advance/Decline: 0.55, almost two declining for every advancing stock
Indexes: SPX (-0.63%), DJI (-0.67%), RUT (-1.26%), VIX (+1.83%)
Sector List: Consumer Discretionary (XLY +0.51%) and Communications (XLC -0.07%) at the top. Energy (XLE -1.50%) and Materials (XLB -1.52%) at the bottom.
Expectation:
-=x=-=x=-=x=-=x=-=x=-=x=-=x=-
Market Overview
The sentiment was mixed on the last day of trading for the month of May with some warning that the current rally will be short-lived The shifting sentiment caused indexes to chop up and down throughout the day.
The Nasdaq ended the day with a -0.41% decline. A dip in the opening minutes created a long lower wick, after which the index rallied to find a higher high than the previous day. Three late afternoon reversals resulted in a short upper wick and a thin red body in the upper half of the candle. The closing range of 56% isn't bad but nearly two stocks declined for every advancing stock and volume was much higher than the previous day.
Small caps were the most volatile today, with the Russell 2000 (RUT) declining by -1.26%. The S&P 500 (SPX) declined by -0.63% and the Dow Jones Industrial Average (DJI) declined by -0.67%. The VIX Volatility Index gained by +1.83%.
Only one of the eleven S&P 500 sectors gained. Consumer Discretionary (XLY +0.51%) was helped higher by better than expected Consumer Confidence. At the bottom of the sector list were Energy (XLE -1.50%) and Materials (XLB -1.52%).
Consumer Confidence was lower than the previous month but higher than the forecast. It came in at 106.4 compared to an expectation of 103.9. The Chicago Purchasing Managers Index for May was also higher than expected at 60.3 compared to the forecast of 55.0.
The US Dollar Index (DXY) rose by +0.41%. The 30y and 10y Treasury Yields rose while the 2y Treasury Yield declined. High Yield (HYG) and Investment Grade (LQD) Corporate Bond prices declined after sharply rising for several days. Brent Oil topped 115 again over the weekend, ending today at 115.74.
The put/call ratio (PCCE) rose to 0.816. The CNN Fear & Greed index remained in Extreme Fear but is moving toward Neutral.
Of the big six mega-caps, Amazon (AMZN) and Alphabet (GOOGL) ended the day with gains, holding onto a +4.40% and +1.10% advanced, respectively. Apple (AAPL) had the biggest decline of the six, losing -0.53% today.
Amazon was the top overall mega-cap as well, followed by Alibaba (BABA) which gained +2.83%. At the bottom of the mega-cap list was Eli Lilly which fell by -3.10%.
The top seven stocks in the Daily Update Growth List were all Chinese companies. Ehang Holdings (EH) led the gains with a +5.44% advance, getting a boost from their earnings release in the morning. At the bottom of the list was Snap Inc. (SNAP), which declined by -9.44%.
-=x=-=x=-=x=-=x=-=x=-=x=-=x=-
Looking ahead
The ISM Manufacturing Employment and Purchasing Manager Index data for May will be delivered tomorrow after the market opens. We will also get the JOLTs Job Openings report for April.
Two FOMC Members (Williams and Bullard) are scheduled to speak ahead of Beige Books being published in the afternoon. Williams tends to be on the more dovish side of the group while Bullard tends to be on the hawkish side.
Hewlett Packard (HPE), MongoDB (MDB), NetApp (NTAP), Chewy (CHWY), and GameStop (GME) are among the earnings reports for Wednesday.
-=x=-=x=-=x=-=x=-=x=-=x=-=x=-
Trends, Support, and Resistance
In the morning dip, the index did get support at the 21d EMA.
If the index returns to the five-day trend line, that would mean a big +3.68% gain for Wednesday.
A more likely advance would be the one-day trend line which meets up with the trend line from the 5/20 low. That would result in a +1.70% gain.
-=x=-=x=-=x=-=x=-=x=-=x=-=x=-
Wrap-up
We have a mix of sentiment in the market right now with some seeing a bullish turn for the better while others remain bearish and see a very short timeline for the current rally. The key will be whether the indexes can hold support levels and whether leading stocks can break out and hold onto gains.
Stay healthy and trade safe!

Daily Market Update for 5/27Summary: Investors continued to pile in as analysts see the Fed at its peak hawkish level and expect less aggressive moves later in the year.
Notes
Ideas always welcome in the comments. Errors will be amended as comments on TradingView or corrected inline in my blog.
-=x=-=x=-=x=-=x=-=x=-=x=-=x=-
Friday, May 27, 2022
Facts: +3.33%, Volume higher, Closing Range: 100%, Body: 95% Green
Good: 100% closing range, higher volume on green day
Bad: Nothing
Highs/Lows: Higher high, Higher low
Candle: Gap up at open, mostly green body, no upper wick
Advance/Decline: 2.87, almost three advancing stocks for every declining stock
Indexes: SPX (+2.47%), DJI (+1.76%), RUT (+2.70%), VIX (-6.47%)
Sector List: Consumer Discretionary (XLY +3.43%) and Technology (XLK +3.38%) at the top. Utilities (XLU +1.56%) and Consumer Staples (XLP +1.16%) at the bottom.
-=x=-=x=-=x=-=x=-=x=-=x=-=x=-
Market Overview
Investors continued to pile in as analysts see the Fed at its peak hawkish level and expect less aggressive moves later in the year.
The Nasdaq gained +3.33% and closed its first green week since March. Volume was higher than the previous day as the index opened with a gap up and closed with a 100% closing range. The 95% green body has a small lower wick that formed just after opening and then the index moves steadily upward the rest of the day. There were almost three advancing stocks for every declining stock.
The Russell 2000 (RUT) climbed by +2.70%. The S&P 500 (SPX) advanced +2.47%. The Dow Jones Industrial Average (DJI) gained +1.76%. The VIX Volatility Index fell by -6.47%.
All eleven S&P 500 (SPX) sectors gained. Growth sectors led the charge upward. Consumer Discretionary (XLY +3.43%) and Technology (XLK +3.38%) were the best two sectors. Utilities (XLU +1.56%) and Consumer Staples (XLP +1.16%) were at the bottom of the sector list.
Personal Spending was higher than expected while PCE Price Index data was on par with the forecast. However, Michigan Consumer Expectations and Sentiment for May were lower than expected.
The US Dollar (DXY) index continued its retreat, lowering by -0.12% on Friday. The 30y and 10y Treasury Yields declined while the 2y yield rose. High Yield (HYG) and Investment Grade Corporate Bond prices continued to climb. The gap between high yield corporate bonds and short-term treasury bonds narrowed sharply after widening throughout May.
The put/call ratio (PCCE) declined to 0.706. The CNN Fear & Greed index is moving toward Neutral but is still in Extreme Fear.
The big six mega-caps all had spectacular days. Tesla (TSLA) led the pack for another day, gaining +7.33%. Microsoft (MSFT) and Apple (AAPL) were able to close above their 21d EMA lines. Meta (FB) had the smallest gain but still advanced +1.83% to close just below its 21d EMA.
Tesla was the top overall mega-cap as well. Alibaba (BABA) gave back some of the huge gains it had on Thursday, declining by -1.13% and ending up at the bottom of the mega-cap list.
Zscaler (ZS) popped to the top of the Daily Update Growth List after beating earnings and revenue estimates. There were only two declining stocks on the list. Workday (WDAY) missed estimates in its earnings release and closed down by -5.57%.
-=x=-=x=-=x=-=x=-=x=-=x=-=x=-
Looking ahead
Markets are closed in the US on Monday for the Memorial Day holiday.
The Chicago PMI for May will arrive on Tuesday morning followed by the CB Consumer Confidence number for May.
Salesforce.com (CRM), HP Inc (HPQ), StoneCo (STNE), Digital Turbine (APPS), and Ehang (EH) will report earnings on Tuesday.
-=x=-=x=-=x=-=x=-=x=-=x=-=x=-
Trends, Support, and Resistance
The index closed above the 21d EMA for the first time since April.
If the one-day trend line continues, we can expect a +1.02% advance on Tuesday.
If the index slows and returns to the five-day trend line or the trend line from the 5/20 low, that would mean a -0.08% decline. Not too bad.
-=x=-=x=-=x=-=x=-=x=-=x=-=x=-
Wrap-up
There are several things that are looking very good. The NAAIM money manager exposure index dropped below 40 last week while the CNN Fear & Greed index moved into Extreme Greed. Both often signal a near-term bottom is here. Then the Fed's meeting minutes this week confirmed that the Fed will frontload interest rate hikes and be less aggressive in the fall.
That brought optimism for growth back into the market, evidenced by broad gains across equities and a sudden advance in corporate bond prices relative to treasuries. We finally had a positive week after a very long weekly losing streak. Let's see if optimism and confidence continue to grow and whether investors move off the sidelines and get back in the game.
Stay healthy and trade safe!

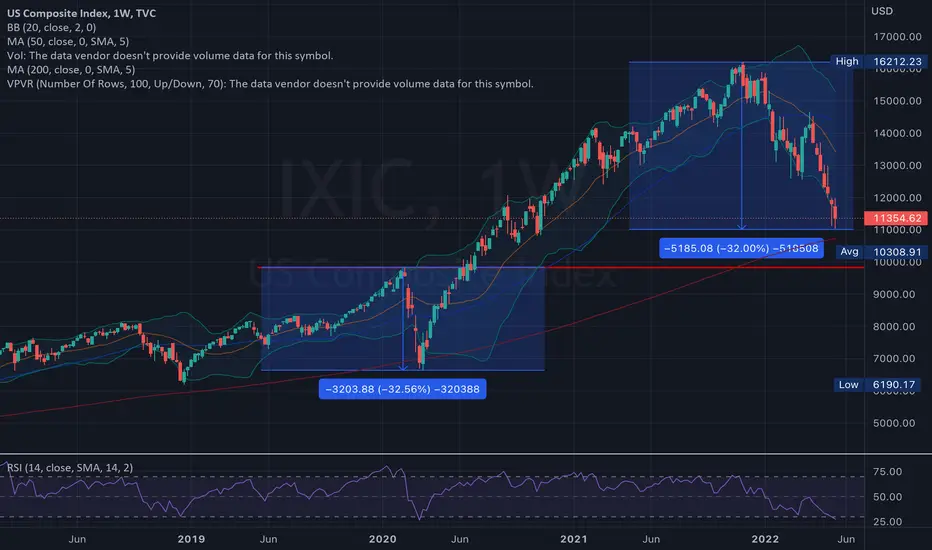
1972-2022 Comparison of Nasdaq and GSPC Indexes.This chart shows the monthly Nasdaq and S and P 500 going back to the early 70's, a little after the Nasdaq index first started (which I believe was 1971). I should note that it's a monthly chart, again, so it's SMA's are monthly based, and I use logarithmic scale for long term charts. Log. is not really for short term so much. I like to look at very long term charts periodically, and freshly analyze them. I believe it's important to study longer time frames especially if you're a day trader like me. I get consumed by the short term movements, and believe you need a full history of anything to truly understand it.
It's fairly easy to see that the Nasdaq moves further and faster than the GSPC. The Nasdaq has tripled the long performance of the GSPC since 1975, and when it corrects, expect that to be more pronounced as well. I like to look at Fibonacci Retracements simply because other people look at them, and they're probably programmed into the big quant trading companies algorithms as well. Almost everyone looks at Fib. retracements whether they admit it or not. Of course, you can't trade directly at these levels as if they are a "golden mean". In the stock market if you meet one person who trades off of some indicator, you can bet others do to, no matter how crazy you think it is. Even if you don't agree with it; the sum total of all points of view of those trading, equate to the current price. I know what I'm thinking, it's the average of everyone's thinking, that I can't figure out. Of course, something like 80 percent of the price action is said to be the result of automated, algorithmic trading. So, I'm taking classes on computer programming, algorithmic trading, data structures, etc. Which leads me into some notations I have on the chart.
I have a big orange arrow pointing to October of 1987 when new computer trading systems got everyone in trouble. I've placed red arrows at points on the Rate of Change indicator where the ROC begins to diverge with price action. It isn't 100 percent, but if this divergence begins to occur be prepared for downside which could move extremely fast. We had a Rate of Change price divergence starting in 12/20/21 and look what's happened since then. Also the Rate of Change is moving down now, and it's very low already, about 20 below the Zero line. This indicator alone makes me believe that there will be more short side price action to come. The Nasdaq went from a low of 1265, roughly, in March of 2009 to a high of 16,212 in November of last year. That's not supposed to happen. There are people who are 31 years old right now, and there hasn't been a real bear market since they became legal adults. I generally live by not having a directional bias in the market, I just follow price action, and I don't believe much in holding positions overnight. I am just cautioning people who have a long bias after 13 years of a generally bullish market, that we have some very unique market condition coming into play, and learning a more price action based strategy, if they haven't is somewhat warranted. We have a few, MASSIVE, market caps holding indexes up which are skewing the outlook more positive than it should be. We have economic experts that are about 150 years old, and they've never seen anything like this. I loved the idea of Cryptocurrency, but I tend to agree with Buffet on that one. Crypto doesn't have value at it's core, it wasn't worth anything when the idea started. Normally, when a company goes public they have some core value. They produce something, or create a new technology that has value. I love that it trades 24/7 basically, I love that you can use it on the dark web, I love that politicians don't get rich from it, I loved that computer guys could make money mining it in the beginning. Soon you're going to need your own power plant and cpu company to mine it.
I ramble too much maybe, without getting to the point. The point is from 2009 to our 2021 index high, the recent Nasdaq low was about a 35% retracement of that gain, and statistically that's just not enough given the decade long upside performance of it. We had a decade run that came close to the Nasdaq gains in the 90's tech bubble. The tech bubble was around 1500% in a decade, we were close to 1300% in a decade (those numbers are give or take a little obviously). The tech bubble bottom 34 months later with a 84% retracement of it's decade long gain. We're currently only 6 months away from our high in November, and only saw a roughly 35% retracement. No one knows what the market will do, but if you believe we've seen the bottom you have to explain away numbers like that. My friend thinks it's un-American to be short a position. Remember that these quant. trading companies have MIT students developing algorithms to beat you out of your money. Competition is the American way.

Daily Market Update for 5/26Summary: Indexes rose higher on Thursday, led by retail after several companies rose their guidance for the near. That came on top of easing concerns over an over-aggressive Fed.
Notes
Ideas always welcome in the comments. Errors will be amended as comments on TradingView or corrected inline in my blog.
-=x=-=x=-=x=-=x=-=x=-=x=-=x=-
Thursday, May 26, 2022
Facts: +2.68%, Volume lower, Closing Range: 86%, Body: 85% Green
Good: Higher high, low and close on better volume. Strong A/D ratio.
Bad: Nothing
Highs/Lows: Higher high, Higher low
Candle: Mostly green body with a small upper wick
Advance/Decline: 2.07, two advancing for every declining stock
Indexes: SPX (+1.99%), DJI (+1.61%), RUT (+2.17%), VIX (-3.07%)
Sector List: Consumer Discretionary (XLY +4.90%) and Communications (XLC +2.43%) at the top. Utilities (XLU +0.28%) and Real Estate (XLRE -0.11%) at the bottom.
-=x=-=x=-=x=-=x=-=x=-=x=-=x=-
Market Overview
Indexes rose higher on Thursday, led by retail after several companies rose their guidance for the near. That came on top of easing concerns over an over-aggressive Fed.
The Nasdaq closed up by +2.68% on higher volume than the previous day. The 85% green body sits above a barely visible lower wick, resulting in an 86% closing range. The small upper wick formed as a flurry of buying subsided mid-day. Still, bulls held prices higher thru the rest of the day and there were two advancing stocks for every declining stock.
The Russell 2000 (RUT) was the next best index, advancing by +2.17% today. The S&P 500 (SPX) gained +1.99% and the Dow Jones Industrial Average (DJI) climbed +1.61%. The VIX Volatility index fell by -3.07%.
Ten of the eleven S&P 500 sectors gained today. Consumer Discretionary (XLY +4.90%) led thanks to the positive news from retail giants. Communications (XLC +2.43%) was the second-best, followed by Technology (XLK +2.40%). Utilities (XLU +0.28%) and Real Estate (XLRE -0.11%) were at the bottom of the list.
Initial Jobless Claims were lower than expected, coming in at 210,000 compared to a forecast of 215,000. That was a positive, but Pending Home Sales for April were lower than the forecast, dropping by -3.9% month-over-month compared to the forecast of -2.0%.
The big news was upgraded annual guidance from Macy's, Dollar General, and Dollar Tree during their earnings reports in the morning. That sent consumer discretionary stocks soaring. The positive sentiment came on top of relief that the Fed would front-load interest rate hikes in summer and cool off in fall.
The US Dollar Index (DXY) fell by -0.31%. US 30y and 10y Treasury Yields were higher while the 2y yield was lower. High Yield (HYG) Corporate Bond prices have increased sharply over the last three days. Investment Grade (LQD) Corporate Bond prices rose slightly today after a sharp increase yesterday. The spread between corporate junk bonds and short-term treasuries tightened significantly.
The put/call ratio (PCCE) rose to 0.818. The CNN Fear & Greed index moved toward Neutral but remained well in the Extreme Fear zone. The NAAIM Money Manager Exposure index rose to 33.19 after dipping to 19.51 last week. A value lower than 20 often signals at least a short-term bottom in the market.
All big-six mega-caps gained today. Tesla (TSLA) led the way with a +7.43% advance. Microsoft (MSFT) had the smallest gain but still climbed +1.29% on top of a good uptrend the last three days.
Alibaba (BABA) was the top mega-cap for the day, soaring by +14.79% today. Only six mega-caps declined. Merck (MRK) was at the bottom of the mega-cap list with a -1.54% decline.
Fastly (FSLY) topped the Daily Update Growth List (behind Alibaba which is also on the list). Fastly gained +10.85%. Snowflake (SNOW) was at the bottom of the list, declining by -4.50%.
-=x=-=x=-=x=-=x=-=x=-=x=-=x=-
Looking ahead
Tomorrow will bring the PCE Price Index data, another measure of inflation. Investors will be looking for any signal of a top for inflation. We will also get Person Spending and Retail Inventories for April. After the market opens, the Michigan Consumer Sentiment and Expectations data for May will be released.
Pinduoduo (PDD), Big Lots (BIG), and Up Fintech (TIGR) are among some of the earnings reports for tomorrow.
-=x=-=x=-=x=-=x=-=x=-=x=-=x=-
Trends, Support, and Resistance
The index made a move back toward the 21d EMA but fell short of crossing the line.
If the one-day trend continues, that could mean a +1.96% gain for Friday and a move back above the key moving average line.
If the index returns to the five-day trend line, that would mean a -0.22% decline. Given the follow-thru day today, I'm also moving the longer-term trend line to the 5/20 bottom.
-=x=-=x=-=x=-=x=-=x=-=x=-=x=-
Wrap-up
Today's move was very positive for investors. We had a solid move higher on better volume than the previous day. The gains were shared broadly across the market. The next test is for the index to close above the 21d EMA, followed by taking out a few support/resistance areas. Caution is still warranted until more charts of our favorite stocks begin to show health signals.
Stay healthy and trade safe!

NASDAQ Composite - Macro prevision structure. This prevision, englobes the narrative of the bubble of all times, greed and fear possible example at it's maximum. He or she who get's preparation shall be rewarded. The person who remains too cocky and unprepared, shall sadly get left behind. The bubble of all times, consists in a mimic of the 1929's boom and bust bubble, but in a similar but huger way. If you're part of the 99% of the people who is blinded by the darkness, ignore this. If you got inspired and got some extra vision, I hope you added some value. Thanks for the reading! Inspire yourself and build your future. See you!

Looks like the end of NASDAQ FallNASDAQ have retraced 50% and has taken support from there, also its at the lower part of Parallel channel.
Expecting a strong pullback from and trend reversal from here on.
It would also mean a pullback for IT/Tech stocks across the world which are suffering from last several months.
Verdict: Seems like a good time to go long on IT stocks.

Nasdaq Trend down on way!Nasdaq the main technologies index apart from being a leading indicator about stock market overall is showing weakness since start of month and I can't see any change in main trend direction. For moment its Sell or neutro however for conservativies investors I'd suggest get into cash until trend changes!

Tech possibly on reboundThe Nasdaq .IXIC has been growing increasingly RSI Divergent which could see the tech sector rebound. If the neckline of the double bottom is crossed around 12000 near term gains can take the index to an inverse Head and Shoulders pattern (green path).
On the other hand if the resistance is strong at the neckline, the descending triangle pattern could play out, but with less intensity as it seems to be reaching the apex.

Daily Market Update for 5/24Summary: Snap Inc. sent an ominous signal to the market by reducing guidance, causing tech and growth stocks to sell off heavily in the morning before recovering some of the losses.
Notes
Ideas always welcome in the comments. Errors will be amended as comments on TradingView or corrected inline in my blog.
-=x=-=x=-=x=-=x=-=x=-=x=-=x=-
Tuesday, May 24, 2022
Facts: -2.35%, Volume lower, Closing Range: 66%, Body: 24% Red
Good: Good closing range over long lower wick
Bad: Lower high, lower low, higher volume on decline
Highs/Lows: Lower high, Lower low
Candle: Thin red body in upper part of candle, longer lower wick
Advance/Decline: 0.3, More than three declining stocks for every advancing stock
Indexes: SPX (-0.81%), DJI (+0.15%), RUT (-1.56%), VIX (+3.41%)
Sector List: Utilities (XLU +2.00%) and Consumer Staples (XLP +1.64%) at the top. Consumer Discretionary (XLY -2.57%) and Communications (XLC -3.55%) at the bottom.
-=x=-=x=-=x=-=x=-=x=-=x=-=x=-
Market Overview
Snap Inc. sent an ominous signal to the market by reducing guidance, causing tech and growth stocks to sell off heavily in the morning before recovering some of the losses.
The Nasdaq fell by -2.35% on higher volume than the previous day. The long lower wick was created at open as key economic metrics missed the forecast. However, the index recovered some of the loss and closed with a 66% closing range. The 24% red body sits at the top of the candle. There were more than three declining stocks for every advancing stock.
The Dow Jones Industrial Average (DJI) was able to finish the day with a gain, advancing +0.15%. The S&P 500 (SPX) declined by -0.81%. The Russell 2000 (RUT) declined by -1.56%. The VIX Volatility Index increased by +3.41%.
Five of the eleven S&P 500 sectors gained, led by defensive sectors. Utilities (XLU +2.00%) and Consumer Staples (XLP +1.64%) were at the top of the list. Consumer Discretionary (XLY -2.57%) and Communications (XLC -3.55%) were at the bottom, with the former being impacted by Snap's news.
Manufacturing PMI data for May met the forecast of 57.5 but the Services PMI fell short, coming in at 53.5 compared to the forecast of 5.2. The PMI data is a signal of economic activity within these two sectors.
New Home Sales for April also came in lower than expected. There were only 591,000 new home sales compared to the forecast of 750,000. The previous month was 709,000. The new number shows a significant slowdown.
API Weekly Crude Oil Stock was higher than expected.
The US Dollar Index (DXY) continued to decline, dropping by -0.32% today. US 30y, 10y, and 2y yields were all lower. High Yield (HYG) and Investment Grade (LQD) Corporate Bond prices were higher, tracking with treasury prices.
The put/call ratio (PCCE) rose to 0.903. The CNN Fear & Greed Index remained in the Extreme Fear range.
All of the big six mega-caps declined, with Facebook (FB) dropping the most, losing -7.62% today. Microsoft (MSFT) held up the best, declining only -0.40%.
Verizon (VZ) was the top mega-cap for the day, gaining +2.03%. Consumer Staples and Health mega-caps dominated the rest of the top ten. Facebook was at the bottom of the list, followed by Tesla (TSLA) which fell by -6.93%.
There was only one gainer in the Daily Update Growth List. Zoom Video (ZM) climbed by +5.61% as its earnings report showed continued growth despite the winding down of the pandemic. After Zoom Video, all the stocks on the growth list fell by more than 2%. Five stocks on the list fell more than 10%, led by Snap Inc (SNAP) which dropped by a huge -43.08%.
-=x=-=x=-=x=-=x=-=x=-=x=-=x=-
Looking ahead
Wednesday will kick off with the Core Durable Goods Orders data for April. After the market opens we will get the Crude Oil Inventories.
The FOMC Meeting Minutes from the early May meeting will be available in the afternoon.
Nvidia (NVDA), Trip.com (TCOM), and Box Inc (BOX) are a few of the earnings reports for Wednesday. I mistakenly
-=x=-=x=-=x=-=x=-=x=-=x=-=x=-
Trends, Support, and Resistance
The Nasdaq continued its downtrend but held above Friday's low.
After the dip in the morning, the index trended higher the rest of the day. If the one-day trend line continues into Wednesday, we can expect a +0.69% gain.
The five-day trend line points to a -1.07% decline.
If the index returns to the trend line from the 3/29 high, that would mean a -2.56% decline.
-=x=-=x=-=x=-=x=-=x=-=x=-=x=-
Wrap-up
Snap's message of lower guidance due to economic disruptions drove even more fear among investors in tech and growth stocks, resulting in today's sell-off. The bleeding continues, and the only question is when will it stop. Perhaps we will continue to bounce around at this level, or maybe we will move lower.
If we can start to see indications of a top to inflation, that will help build more support for gains. Inflation needs to come under control without massive interest rate hikes that will further slow down growth.
Stay healthy and trade safe!

Daily Market Update for 5/23Summary: Stocks rallied on Monday thanks to a stronger Euro after the European Central Bank said rate hikes would come later this year.
Notes
I've been traveling for the past two weeks and have not been able to write the Daily Market Update. I'm back at home and will continue covering the markets as often as I can.
Ideas always welcome in the comments. Errors will be amended as comments on TradingView or corrected inline in my blog.
-=x=-=x=-=x=-=x=-=x=-=x=-=x=-
Monday, May 23, 2022
Facts: +1.59%, Volume lower, Closing Range: 93%, Body: 56% Green
Good: High closing range
Bad: Lower volume on gain, lower high than previous day
Highs/Lows: Lower high, Higher low
Candle: Inside day, upper half green body, lower half wick
Advance/Decline: 1.07, about the same number of advancing and declining stocks
Indexes: SPX (+1.86%), DJI (+1.98%), RUT (+1.10%), VIX (-3.23%)
Sector List: Financials (XLF +3.25%) and Energy (XLE +2.64%) at the top. Health (XLV +0.88%) and Consumer Discretionary (XLY +0.75%) at the bottom.
-=x=-=x=-=x=-=x=-=x=-=x=-=x=-
Market Overview
Stocks rallied on Monday thanks to a stronger Euro after the European Central Bank said rate hikes would come later this year.
The Nasdaq rose by +1.59% for the day, but it was not enough to reach the previous day's high. The inside day came with lower volume, but the closing range of 93% and 56% green body in the upper half of the candle is positive. There was a nearly equal number of advancing and declining stocks.
The Dow Jones Industrial Average (DJI) outperformed the other indexes, gaining by +1.98% while the S&P 500 (SPX) advanced by +1.86%. The Russel 2000 (RUT) climbed by +1.10%. The VIX Volatility Index declined by -3.23% but remained elevated as it has been since the beginning of May.
All eleven S&P 500 sectors gained. Financials (XLF +3.25%) and Energy (XLE +2.64%) were the best two sectors for today. Health (XLV +0.88%) and Consumer Discretionary (XLY +0.75%) were at the bottom of the sector list.
The US Dollar Index (DXY) dropped by -0.91% and is down 2.5% from its peak in early May. US 30y, 10y, and 2y Treasury Yields all rose. High Yield (HYG) Corporate Bond prices moved higher while Investment Grade (LQD) Corporate Bond prices declined. Copper and Aluminum Futures continued to rise.
The put/call ratio (PCCE) dropped to 0.829. The CNN Fear & Greed index is in the Extreme Fear range.
Five of the big six mega-caps advanced. Amazon (AMZN) was the only one to decline but fell just -0.03%. Apple (AAPL) had the biggest gain, advancing +4.01%, followed by Microsoft which moved up by +3.20%. All six have work to do before getting back to their key moving average lines.
Financial stocks topped the broader mega-cap list. JP Morgan (JPM) and Bank of America (BAC) were the top gainers, advancing +6.19% and +5.94% respectively. Broadcom (AVGO) was at the bottom of the list, declining by -3.10%. There were only four mega-caps that declined.
The Daily Update Growth List had some gainers, but overall more than half of the list declined. DoorDash (DASH) topped the list with a +2.39% gain. Peloton (PTON) had the biggest loss, declining by -6.13%.
-=x=-=x=-=x=-=x=-=x=-=x=-=x=-
Looking ahead
Purchasing Manager Index data for May will be available after the market opens tomorrow. That includes Manufacturing, Services, and Composite measurements. We will also get New Home Sales data for April.
Nvidia (NVDA), Trip.com (TCOM), and Box Inc (BOX) are a few of the earnings reports for Tuesday.
-=x=-=x=-=x=-=x=-=x=-=x=-=x=-
Trends, Support, and Resistance
Although the day ended with positive gains, the lower high means the index is still in a down trend.
If the one-day trend continues, that would mean a +1.33% gain for Tuesday.
If the index returns to the five-day trend line and or the trend line from the 3/29 high, that would result in a -3.86% decline.
-=x=-=x=-=x=-=x=-=x=-=x=-=x=-
Wrap-up
It's been a wild few weeks. Part of me is happy I was on break and didn't report daily. Part of me thinks there was much to learn from the market data and could have benefited.
Let's hope for some new highs throughout this week and some gains on higher volume, shared broadly across the market.
Stay healthy and trade safe!

time for reversal?nasdaq looking ripe for a bounce now. last bear market of march 2020 showed a 32% drop, we're currently at that level now. rsi ~27 is also around the same level as march 2020. let's see if a reversal is in the works
Nasdaq Support HoldsThis is a follow up to my 05/14/22 post "Nasdaq Bottoms at Important Support" .
Point & Figure charts objectively define support/resistance. They can also help to filter out false breakouts.
On 05/12/22 IXIC made a bottom in its decline from the all-time high made in November 2021.
On 05/20/22 IXIC went marginally below its 05/12/22. Could this be the start of a new down phase? Unlikely, because
there was no break below the Point & Figure support.
There's a high probability that IXIC could have a multi-week rally at least up to the important resistance area illustrated
on the chart.
Mark

NASDAQNASDAQ
Falling wedge
Double Bottom
Lower channel
Opinion: Bullish short term buy within a bear market. Looking for a move up from here to the 12,700 - 13,000 area.
Nasdaq Extremely OversoldThis is a side-by-side comparison of the Nasdaq daily chart from March 2009 with today (May 2022). The charts are looking very similar to one another. The heatmap on the daily chart has not been this cold since the bottom of the Great Recession. The daily plot is nearing a record low. While this daily chart cannot make long term predictions, it suggests that we are at a bottom right now and the Nasdaq is about to move back up for the coming weeks to months.

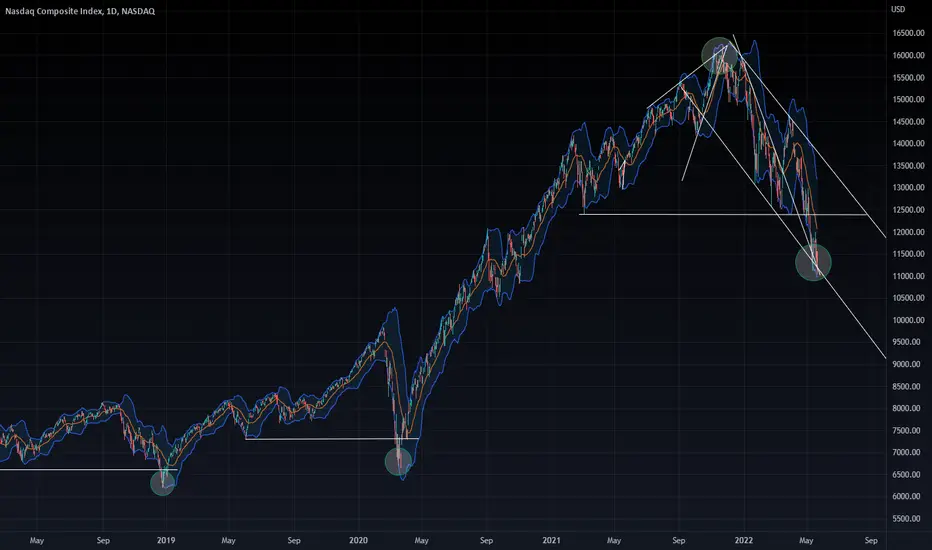
Nasdaq Composite Overview for OtosanThis long term trend for Nasdaq is consistent through it's history. This line has acted as the bottom for both the 1990, 2000 and 2020 crashes. The only time Nasdaq went below the line was the 2008 financial crisis. From 2008-2017 the line acted as resistance (top).
Here are the two scenarios (Long Term - Years)
Bullish: Just like the 3 major crashes - Nasdaq will test this support which shows to be around $10,000. This would be the ultimate time to buy and statistically is the more likely option. In this scenario NASDAQ will pass it's prior high in 2024 or before (50% return).
Bearish: If the $10,000 line is broken, there is no trendline and will be near impossible to predict a bottom. If we use 2007-2008 as an example, the market first dropped 20% initially (July 2007 - March 2008) and almost touched the line - the line then failed to support later that year in August. Once this line breaks after a second test or third test, all major investors dump shares as the bottom can no longer be predicted. This is why the market lost 40% from August 2008 - Feb 2009 (or a total of roughly 52% between 2007-2009). Once this happens, people should only reinvest once an uptrend starts to form. To translate this to today's market, the NASDAQ would have lost 30%+ from the tops to reach the $10,000-10,500 line, and would likely have a sharper decline to follow if the trend is broken.
Summary
Ultimately the tradeoff is either a 50% return in less than 4 years followed by a likely bull run. From strictly a statistic likely hood this is the more likely scenario. However, if NASDAQ breaks the support line, the most commonly used tool to predict bottoms (Fibonacci), the low is estimated to be around $2,875 or an additional 70% drop from $10,000 (80% drop from market high). This may seem exaggerated, but the same tool would have predicted a drop of price of the 2007-2009 bottom at $1,550 which is actually higher than the actual low of around $1,350.
Personal Conclusion
Strictly looking at chart analysis, the upside is good with the market returning to it's prior high within 4 years. However, as the recent gains were extremely fast and the following downturn was very sharp, there is also a potential of one of the greatest losses in value historically. Now if we look at the current timing and global political climate, from rising interest, supply chain disruptions to a war in Europe the risks are significantly higher than the past recessions of breaking the support line. Some of these factors can be countered by investing in companies that may counter the market for a more balanced portfolio. In short, the first priority would be to set aside enough cash (factoring for long term inflation) for the next 10-20 years outside of investment assets so that even if there is a major downturn or further inflation, you can live comfortably and stress free.

Comparing the Nasdaq, S&P, and the M2 money supplyThe current drawdown in the stock market may not appear like much when looking at a monthly chart, however when comparing to the money supply it tells a different story. From the peak of the dot com bubble the entire market is still down significantly when adjusted for all the money printing the fed has done.

Nasdaq Composite Index divided by M1 and M2 money supply The current drawdown in the Nasdaq may not appear like much when looking at a monthly chart for example, however when comparing to the money supply it tells a different story. Compared to M2 we are at the same level seen in early 2020, however compared to M1 we are at levels not seen since 1991.

NASDAQ: normalization outlook, zoomed outHi,
In my previous post about NASDAQ I shared my points why I removed my share holdings in October 2021, and what targets I'm looking at before taking US tech positions again (not sooner than H2 2022).
Here's a zoomed out view, with some important long-term averages and a trend line I'm looking at. I'm not sure about Target 3, but that level is also possible to reach. My best bet would be that it will reach to target 2.
The previous explanation.
Be safe out there.
Cheers,
Antonio

NASDAQ - LongThe index has most probably completed either the whole or the first phase of a correction. A daily close above 12275/570 is needed to give more credit for a recovery towards 13020 and 13640.Only a daily close above 15115 would eliminate additional losses for now and open the door to new highs.
On the other hand, a daily close below 11015 would revive a downward extension to 10125 and 9580.
We recommend building small long positions at market with a stop loss at 11020.

NASDAQ Corrective WaveNasdaq is currently on corrective WAVE 3 on it's way to finish WAVE 4.
Looks like it's making a Zig Zag ABC correction and if it's true, then we could see a rebound from the "BLUE zone" to close several gap there before continue it's journey to WAVE 5.
Last correction area is the "YELLOW line".
Wave 4 invalid if price's touching the "RED line".

Nasdaq will drop more U.S. NASDAQ has lost its 200 days SMA.
according its price action , I think the correction will be finished when it drops at least more than 18% to reach its 200 weeks SMA , or it will be in a squeezing range situation for a long time , then 200 weeks SMA will come up to the price pattern.
in this moment , I will be cash or invest very tiny.

NASDAQ INDEX TREND AND WAVE ANALYSISBe sure to stick to Stop Lost and TAkE Profit. This is an idea and not a bargain offer
This is just idea, not trading advice, use at own risk.
reasons:
It is recommended to buy in this price limit
It is mandatory to pay attention to the stop loss and the target marked on the chart
Do not be greedy and adhere to the specified principles. I hope you will be profitable
Note that there is no 100% analysis and it is possible to stop flirting
This is a personal analysis and you should not enter into a transaction without review
If you know this, make a purchase
Be sure to adhere to the principles of capital management and do not invest more than 2% of your capital in each transaction.
High-risk individuals can enter a maximum of 5% of risk capital in this transaction by accepting risk-taking.
This analysis has been analyzed with the classic Elliott topics and neo wave style. Also, the principles of price action have been used.
