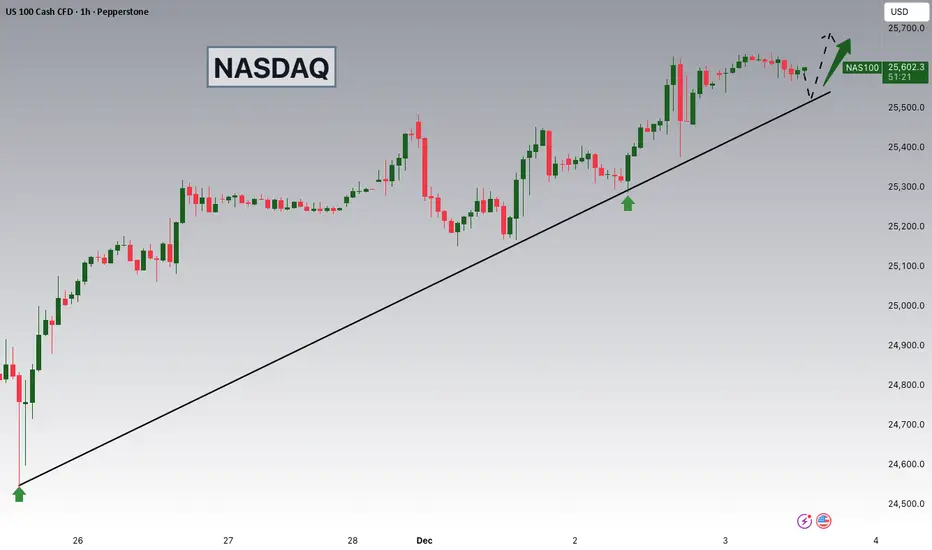
NASDAQ Potential UpsidesHey Traders, in today's trading session we are monitoring NAS100 for a buying opportunity around 25,520 zone, NASDAQ is trading in an uptrend and currently is in a correction phase in which it is approaching the trend at 25,520 support and resistance area.
Trade safe, Joe.
Related indices
Tech bubble burst?The Head and Shoulders (H&S) pattern is a classic reversal formation, typically found after a mature uptrend. It represents a gradual loss of buying pressure and a transition toward a potential downward move.
The H&S pattern often signals the exhaustion of bullish momentum, a shift in control toward

USNAS100 consolidating within a bearish trendThe USNAS100 is currently consolidating within a bearish trend. Wall Street’s main indexes are expected to open lower on Monday as investors move to the sidelines ahead of key economic data and a closely watched speech from Federal Reserve Chair Jerome Powell. Markets are looking for clues regarding

NASDAQ Santa Rally already underway.Nasdaq (NDX) has made a strong V-shaped recovery on its 1D MA100, as projected on our previous analysis and is extending the uptrend above the 4H MA200 (orange trend-line).
The rally may need a relief pull-back towards its 4H MA50 (blue trend-line) but technically, the seasonal end-of-the-year 'San

US100: Nasdaq 100 Maintains Bullish Structure Into Fed WeekUS100: Nasdaq 100 Maintains Bullish Structure Into Fed Week
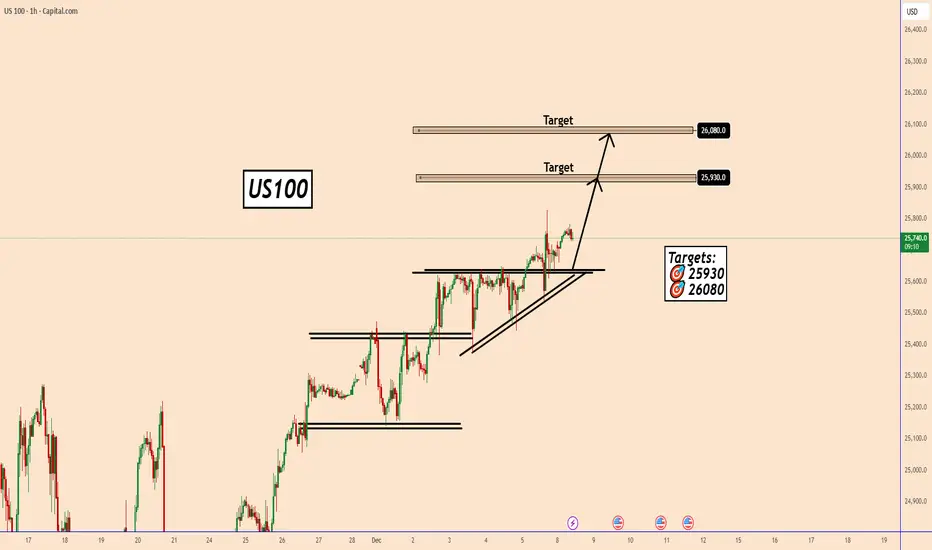
US100 remains in a bullish structure for now. The price has broken out of the triangle pattern, signaling an increase in bullish momentum.
With market optimism still high regarding a potential FED rate cut, the probability of further up
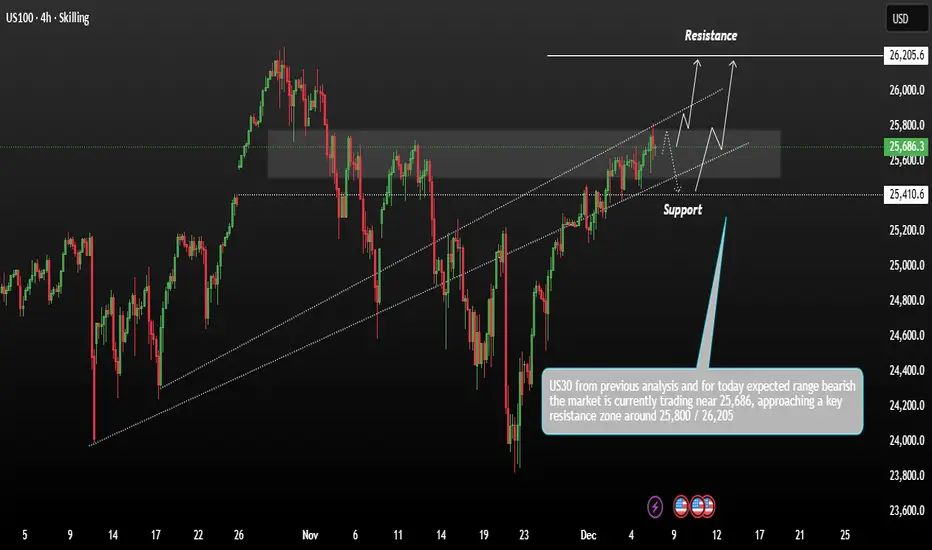
USNAS100 Consolidation Positive Holds Strong range momentumUS100 shows price action moving within a rising channel after recovering from previous lows. The market is currently trading near 25,686, approaching a key resistance zone around 25,800 – 26,205. This area has been marked as the upper boundary where price may face rejection or potentially break out.
Nasdaq - The final blow-off top!⚰️Nasdaq ( TVC:NDQ ) can rally a final +25%:
🔎Analysis summary:
Just this month, we witnessed quite some volatility on the Nasdaq with a correction of about -10%. However, bulls immediately stepped in and clearly pushed price higher. Since there is still bullish pressure, a final blow-off top

USNAS100 | Momentum Builds Above Key PivotUSNAS100 – Technical Overview
USNAS100 is showing signs of stability above the pivot line at 25730.
As long as the price holds above this level, bullish momentum is expected to continue toward 25880 and 25980, with potential extension toward 26200.
However, a 1H or 4H candle close below 25730 will

US100 / NASDAQ TodayNasdaq 100 (NDX) Analysis - December 3, 2024
Based on today's market data, here's a comprehensive analysis of the Nasdaq 100:
Today's Performance
The Nasdaq 100 is currently trading around 25,513 points. The index closed at 25,555.86, gaining 213.01 points (+0.84%) as of 5:16 PM EST on December 2.
T

NAS 100Am bullish until the target high is swept. I'll drop any lowertimeframe buys when I spot one.

See all ideas
Displays a symbol's price movements over previous years to identify recurring trends.