NAS100 Buy Entry’s Clean, R:R 2.00 — Setup Locked & Loaded!Hey traders,
Here’s my NAS100 setup based on the 1-hour chart:
🟢 Buy Entry: 23998.77
🔴 Stop Loss: 23884.81
🎯 TP1: 24045.42
🎯 TP2: 24097.67
🎯 TP3: 24225.56
Risk/Reward Ratio: 2.00
Every like you drop is pure fuel for me to keep sharing these setups.
Big thanks to everyone standing by
Related indices

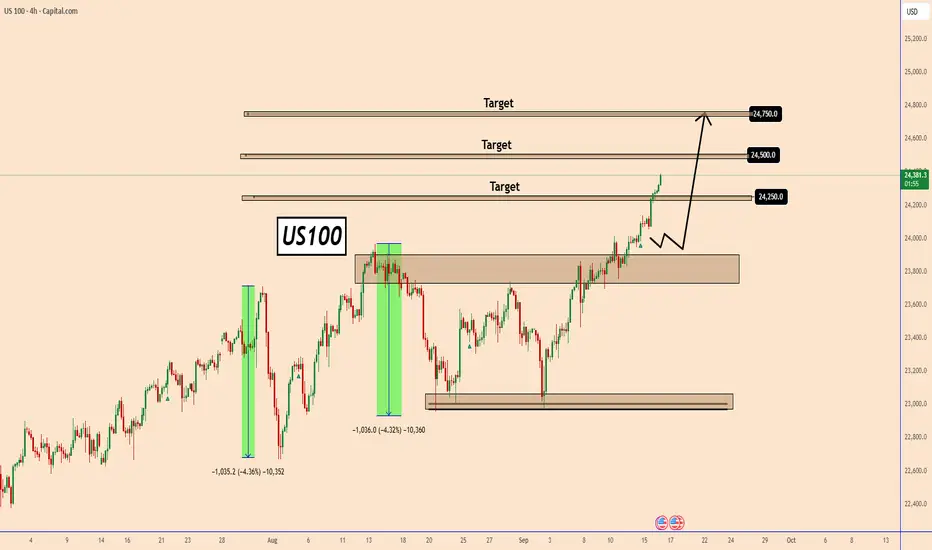
US100 Rally Supported by Fed Expectations and Cooling InflationUS100 Rally Supported by Fed Expectations and Cooling Inflation
From our last analysis, indices have continued to rise. The US100 already hit the first target and is now close to the second one.
With the market expecting multiple Fed rate cuts this year, bullish momentum stays strong and shows no
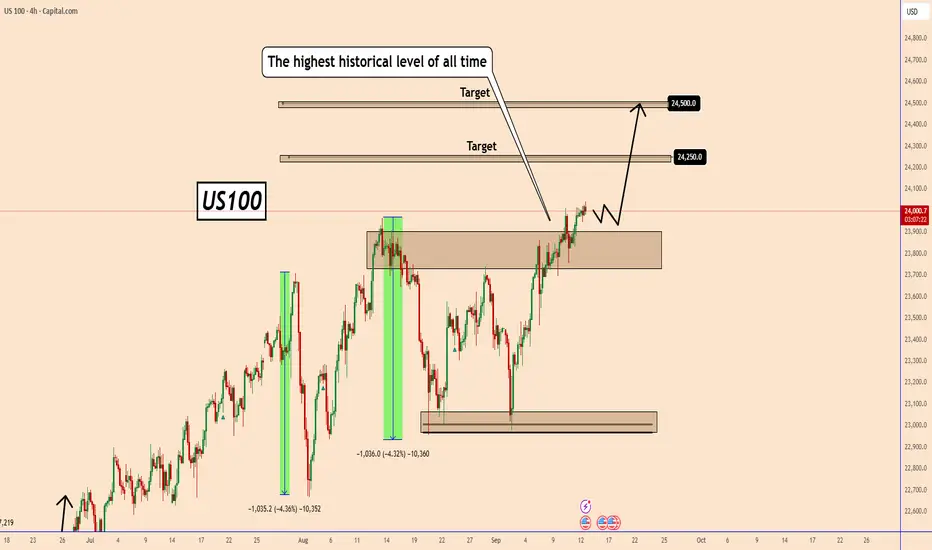
US100 Hits All-Time HighUS100 Hits All-Time High
Yesterday, US100 reached a new record high at 24040, confirming the strength of its bullish trend.
With U.S. inflation cooling, the market is now expecting the Federal Reserve to cut interest rates, possibly starting this cycle and continuing in the months ahead.
Lower r
NAS100 HL's to HH's...Guaranteed 1While the market continues to make HL's to HH's...I am particularly cautious to enter new buys especially since we are currently trading at HH's and one of the first rules in trading is that you buy low and sell high.
With that in mind, I have given you a history of the market movements that landed

FOMC has cleared liquidity levels around this technical rangeNews Drivers do not overpower technicals, the fundamentally driven movements are just banging around into huge money pending orders. No way around these mechanics.
That what we saw today, and what will continue to happen forever and ever 💎 Not saying it will always be a ricochet like today, but the

NASDAQ Approaching a critical +1 year Resistance.Nasdaq (NDX) is close to hitting our 24500 bullish target, which as we explained on our previous analysis represents a +6.78% rise, the technical Bullish Leg of the Channel Up that started back in mid-May.
This pattern is however headed towards a +1 year Resistance level, the Higher Highs trend-lin

Liquidity Voids: Where Price Runs Through Empty Space█ Liquidity Voids: Where Price Runs Through Empty Space
Big moves don’t just “happen”, they happen because either buyers or sellers step aside and let price run.
A liquidity void is what’s left behind when that happens: an area on the chart where price traded with very little volume, leaving a ‘

NAS still charging HighsEverything explained in video, please let me know if I may have missed any details!

Short term idea for NAS100Simplicity is the best, I am using any complicated way of trade. Just draw some lines and do the trade.

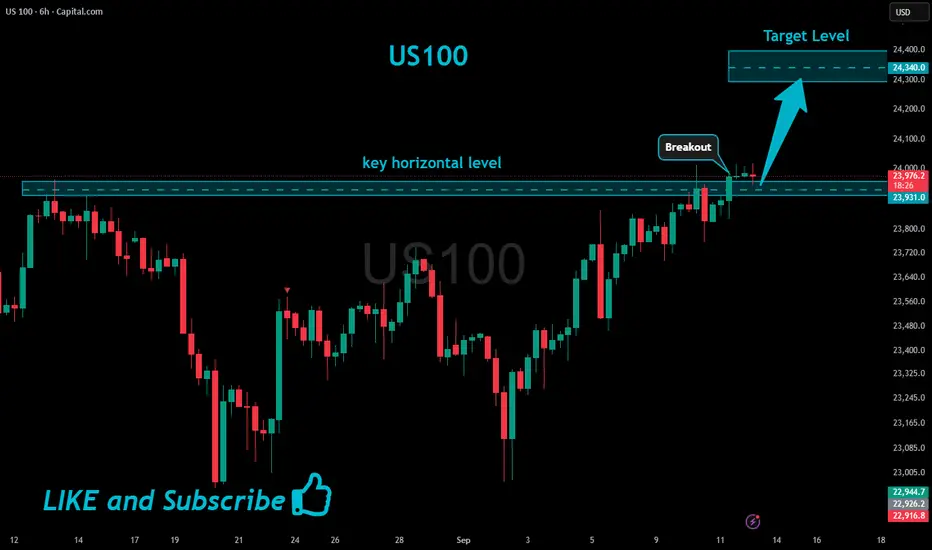
US100 Will Keep Growing!
HI,Traders !
#US100 is trading in an
Uptrend and the index broke
The key horizontal level
Around 23931.0 and the
Breakout is confirmed so
We are bullish biased
And we will be expecting a
Further bullish move up !
Comment and subscribe to help us grow !
See all ideas
Displays a symbol's price movements over previous years to identify recurring trends.