US100 Price Update – Clean & Clear ExplanationUS100 is moving within a broad ascending channel, defined by a long-term diagonal support line that has guided the market’s bullish momentum since late November. Multiple interaction points along this trendline show it has historically acted as a reliable dynamic support zone.
Several shaded horizo
Related indices
NAS 100Am bullish until the target high is swept. I'll drop any lowertimeframe buys when I spot one.

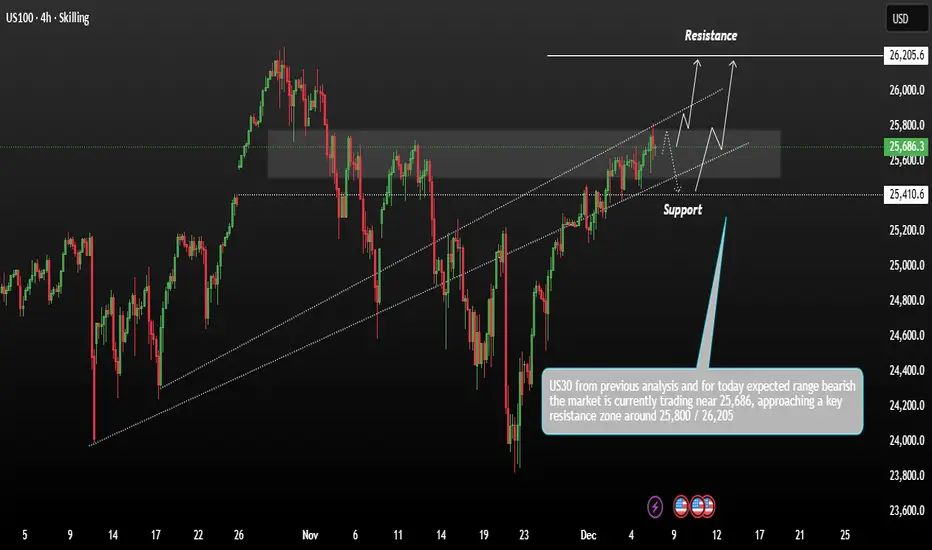
USNAS100 Consolidation Positive Holds Strong range momentumUS100 shows price action moving within a rising channel after recovering from previous lows. The market is currently trading near 25,686, approaching a key resistance zone around 25,800 – 26,205. This area has been marked as the upper boundary where price may face rejection or potentially break out.
Major correctionI'm targetting a drop to 11 000 around Aug to Dec next year and back to more reasonable valuations than currently. This would also arrive at the very long term lower trend line on the log chart. The area around 11 000 looks to me like it need retesting. And it would need to be in this sort of time f

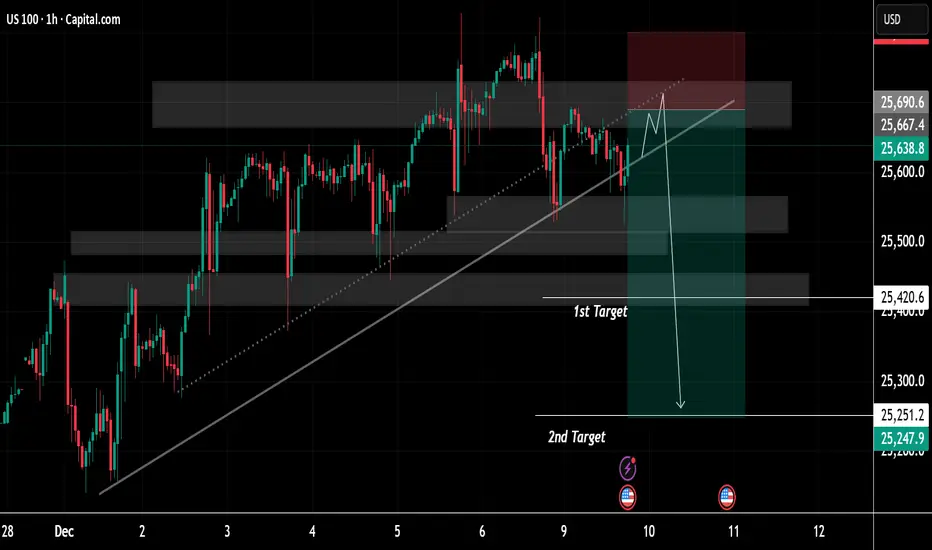
Market Hunter: NASDAQ-NAS100 Sell OpportunityMy friends, Good morning!☀️
For US100-NAS100, I will open a SELL position between 24,988 and 25,243, targeting 23,843.📊
My friends, I share these analyses thanks to every single like I receive from you.
Your likes increase my motivation and make me want to support you in this way.🙏
I sinc

US100: Nasdaq 100 Maintains Bullish Structure Into Fed WeekUS100: Nasdaq 100 Maintains Bullish Structure Into Fed Week
US100 remains in a bullish structure for now. The price has broken out of the triangle pattern, signaling an increase in bullish momentum.
With market optimism still high regarding a potential FED rate cut, the probability of further up
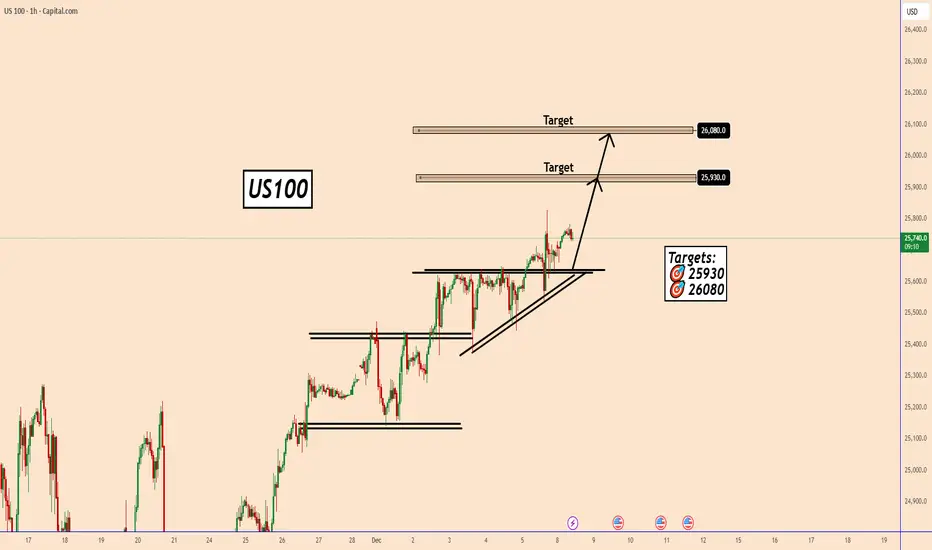
USNAS100 | Momentum Builds Above Key PivotUSNAS100 – Technical Overview
USNAS100 is showing signs of stability above the pivot line at 25730.
As long as the price holds above this level, bullish momentum is expected to continue toward 25880 and 25980, with potential extension toward 26200.
However, a 1H or 4H candle close below 25730 will

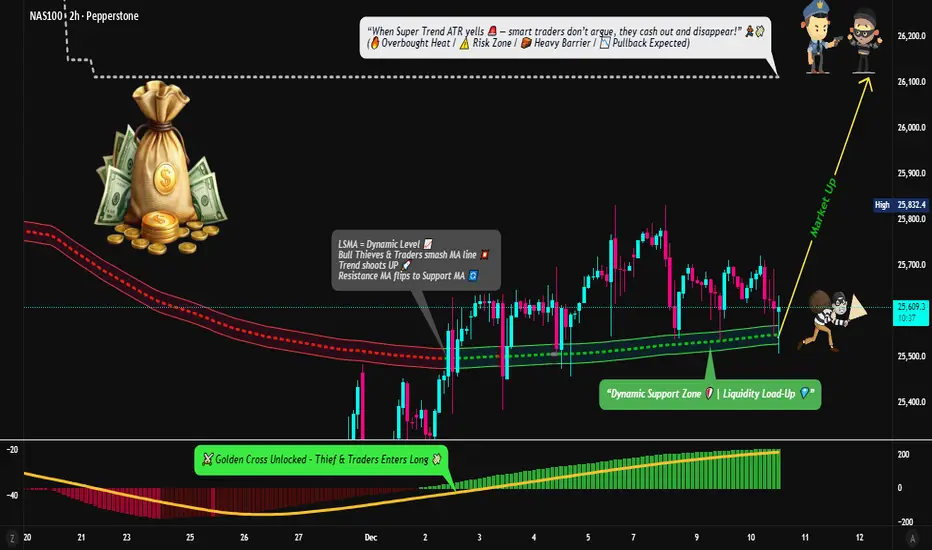
NASDAQ100 Strong Bullish Momentum — Clean Entry & Exit Blueprint⚡ THIEF STRATEGY ALERT: Golden Cross Breakout Setup
📈 TRADE PLAN OVERVIEW
Asset: NAS100 (NASDAQ 100 Index)
Timeframe: Day/Swing Trade
Market Bias: 🟢 BULLISH (Moving Average Breakout + MACD Golden Cross Confirmed)
Strategy Type: Layered Entry Approach (Multi-Level Limit Orders)
🎯 ENTRY STRATEGY - "
Nasdaq - The final blow-off top!⚰️Nasdaq ( TVC:NDQ ) can rally a final +25%:
🔎Analysis summary:
Just this month, we witnessed quite some volatility on the Nasdaq with a correction of about -10%. However, bulls immediately stepped in and clearly pushed price higher. Since there is still bullish pressure, a final blow-off top

NASDAQ SHORT VERY BEARISHTri-star doji printed, a rare and strong reversal pattern - extremely bearish.

See all ideas
Displays a symbol's price movements over previous years to identify recurring trends.