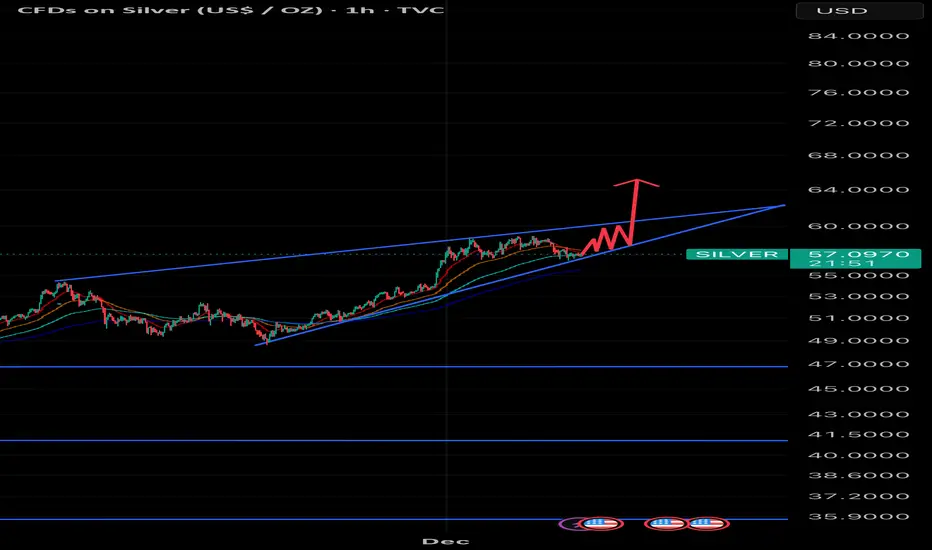
SILVER - The ATH Retest Opportunity!!!🚀Silver has officially broken above its all-time high - a major milestone for the metal. But nothing moves in a straight line, and healthy trends always correct before continuing higher.
📉Price is now on its way to retest the previous ATH zone in red, which aligns perfectly with the rising trendli

Silver (XAGUSD) Next Selling Move AnalysisWhat the chart shows
Resistance zone: Around 59.300 – 59.500
Support zone: Around 57.800 – 58.000
Price is currently near 58.94 (according to the screenshot).
The drawn prediction suggests a push up toward resistance, then rejection, then a drop back to support.
Short Idea
The safer short is

XAG/USD: Major Resistance Cleared, What Comes Next?🥈 XAG/USD — SILVER VS U.S. DOLLAR
Metals Market • Swing / Day Trade Opportunity Guide 🧭📈
⚙️ Market Outlook — Bullish Confirmation
Silver has broken through a major resistance zone, shifting momentum firmly into bullish territory.
This breakout signals the presence of strong buyers stepping in, maki

SILVER Is Very Bearish! Sell!
Please, check our technical outlook for SILVER.
Time Frame: 1h
Current Trend: Bearish
Sentiment: Overbought (based on 7-period RSI)
Forecast: Bearish
The price is testing a key resistance 5,871.4.
Taking into consideration the current market trend & overbought RSI, chances will be high to see a

Short silver, triple top pattern.Silver is trading at triple top. Has a high chance to return to support at 57. Good feeling about this trade. RRR is at about 1.5

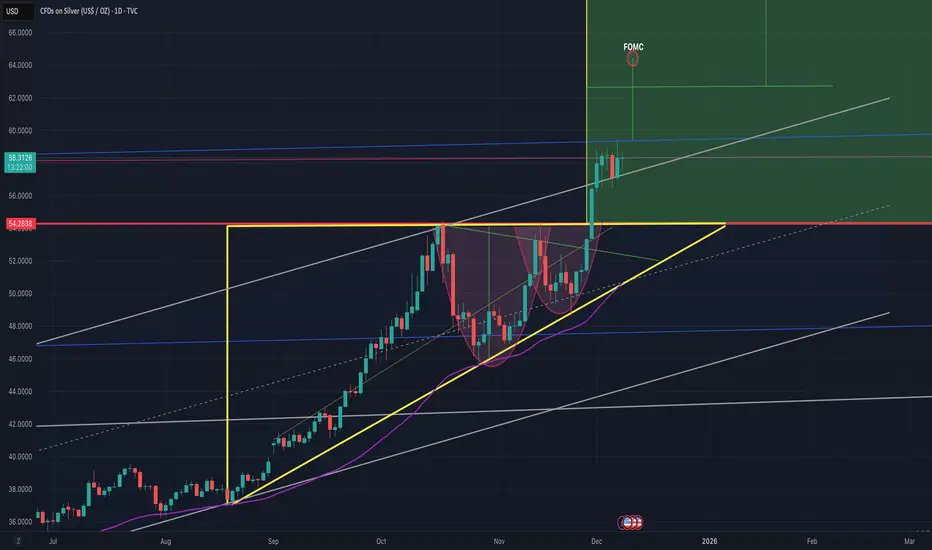
Rising Channel / Ascending TriangleLooks like this could be a good set up for silver right now for ATH. Looking for 65 once fomo starts after break out above 60 levels.
SILVER BEST PLACE TO BUY FROM|LONG
SILVER SIGNAL
Trade Direction: long
Entry Level: 5,701.3
Target Level: 5,814.5
Stop Loss: 5,626.2
RISK PROFILE
Risk level: medium
Suggested risk: 1%
Timeframe: 1h
Disclosure: I am part of Trade Nation's Influencer program and receive a monthly fee for using their TradingView charts in my analys

Silver $62 within 1-2 weeksSilver $62 within 1-2 weeks, or even days. Potential once in every 45 yrs epic price spike to $100 before New year 2026.
I'm long since $32 :)

XAGUSD--LONG--Long bias
--entry and tp levels are as shown on the chart
--Also check below 12M chart I published before. (I added down below)

See all ideas
Summarizing what the indicators are suggesting.
Oscillators
Neutral
SellBuy
Strong sellStrong buy
Strong sellSellNeutralBuyStrong buy
Oscillators
Neutral
SellBuy
Strong sellStrong buy
Strong sellSellNeutralBuyStrong buy
Summary
Neutral
SellBuy
Strong sellStrong buy
Strong sellSellNeutralBuyStrong buy
Summary
Neutral
SellBuy
Strong sellStrong buy
Strong sellSellNeutralBuyStrong buy
Summary
Neutral
SellBuy
Strong sellStrong buy
Strong sellSellNeutralBuyStrong buy
Moving Averages
Neutral
SellBuy
Strong sellStrong buy
Strong sellSellNeutralBuyStrong buy
Moving Averages
Neutral
SellBuy
Strong sellStrong buy
Strong sellSellNeutralBuyStrong buy
Displays a symbol's price movements over previous years to identify recurring trends.