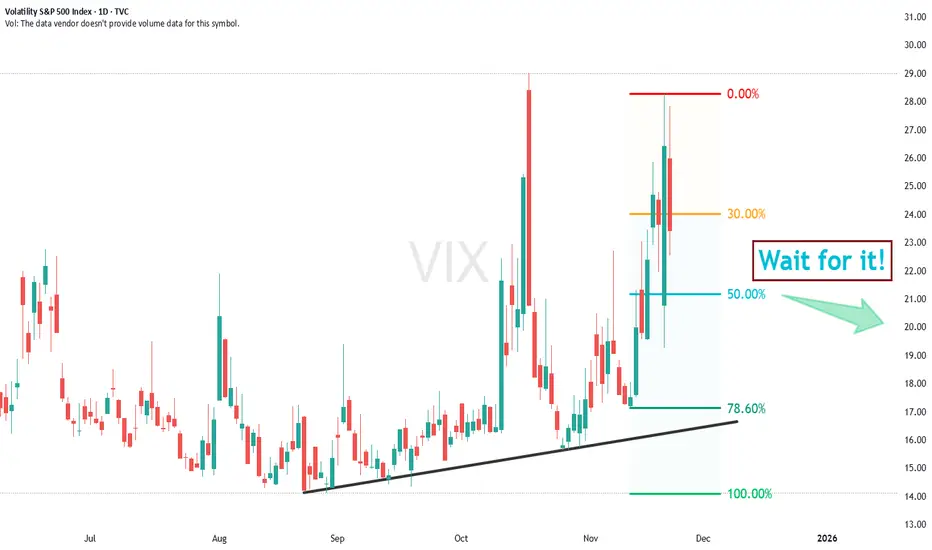
VIX mid-term TAI've been watching VIX closely since September, and the accumulation has been growing since then and it's not stopped yet, it looks like it set double top and currently is cooling down but the indicators are still very strong and they don't get that strong that often on daily time frame, the VIX may
About Volatility S&P 500 Index
VIX is the trademarked ticker symbol for the CBOE Volatility Index, a popular measure of the implied market volatility of S&P 500 index options. The VIX index has been calculated by the Chicago Board Options Exchange (CBOE) since 1993.
It is often referred to as the fear index or the fear gauge. The VIX projects a range of the expected stock market volatility over the next 30-day period. It is used by traders, institutional investors, and hedge fund managers to diversify portfolios and correlate returns.
It is often referred to as the fear index or the fear gauge. The VIX projects a range of the expected stock market volatility over the next 30-day period. It is used by traders, institutional investors, and hedge fund managers to diversify portfolios and correlate returns.
Related indices

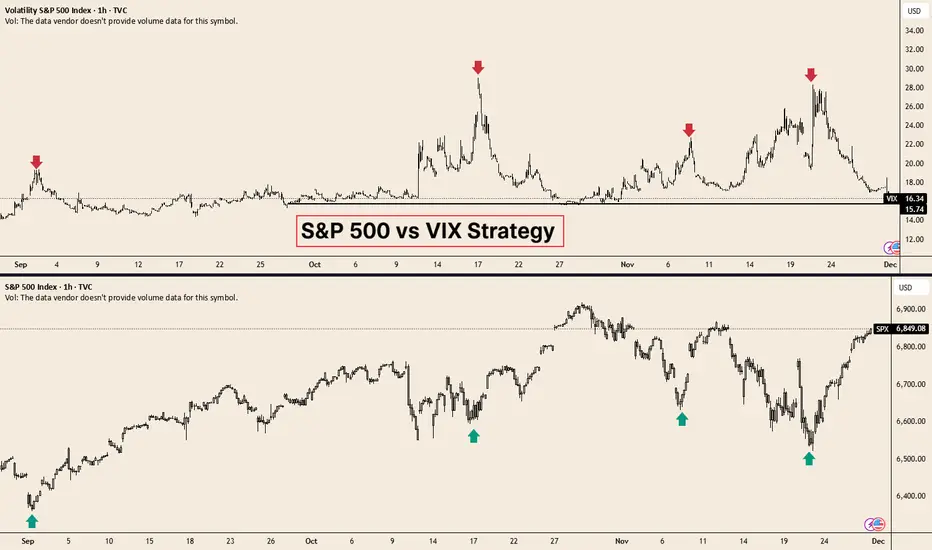
VIX don't lieA persistently upward trending VIX is nothing to ignore if your portfolio is heavily bullish this indication is screaming at you that the bottom of the market has not been found. At a MINIMUM, traders, not to mention investors would be wise to wait until the VIX closes below 20.
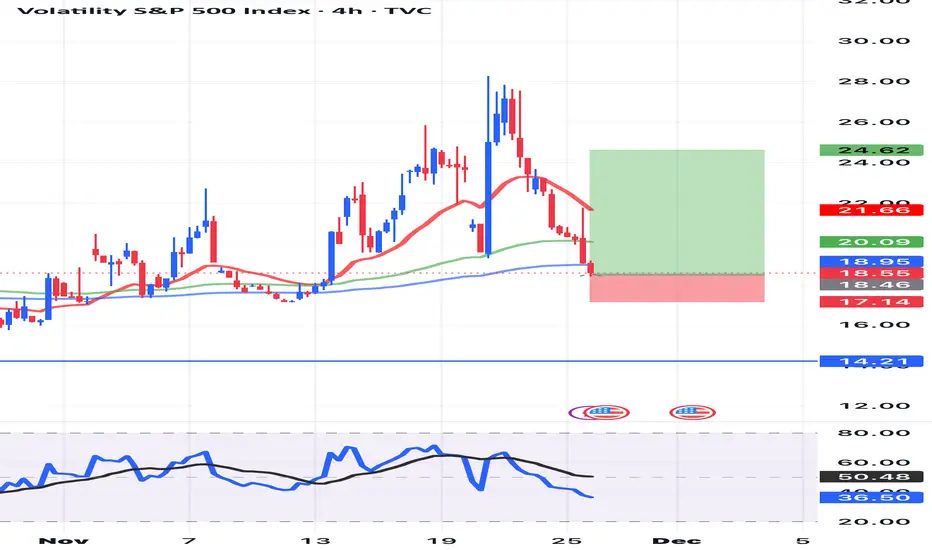
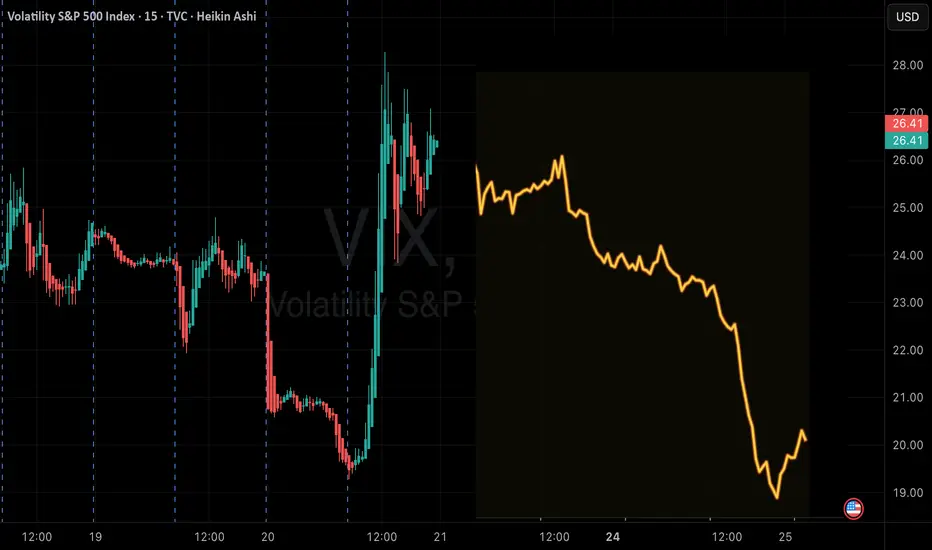
QuantSignals V3: VIX Bear Put Alert – Big Volatility Play Ahead!VIX (QuantSignals Katy 1M | 2025-11-24)
Direction: BUY CALL
Confidence: 75%
Current Price: $21.27
Entry: $21.27
Target: $23.14 (+8.8% from entry)
Stop Loss: $20.95 (–1.5% from entry)
Expected Move: +11.01%
30min Target: $22.07 (+3.77%)
Trend: BULLISH
Volatility: 130.8%
📈 Technical Overview
Strong

VIXHow to become successful in forex and stock trading: 1.Master fundamentals and technical analysis. 2,Build and follow a solid trading plan. 3.Apply strict risk management (1–2% rule). 4.Stay disciplined—control fear and greed. 5.Record and analyze every trade. 6.Focus on high-quality setups only. 7.
volatility clustering"high volatility is often followed by high volatility (and low by low) rather than being randomly distributed"
Markets move in cycles. Using this principle you could some times predict outcomes (regime changes).

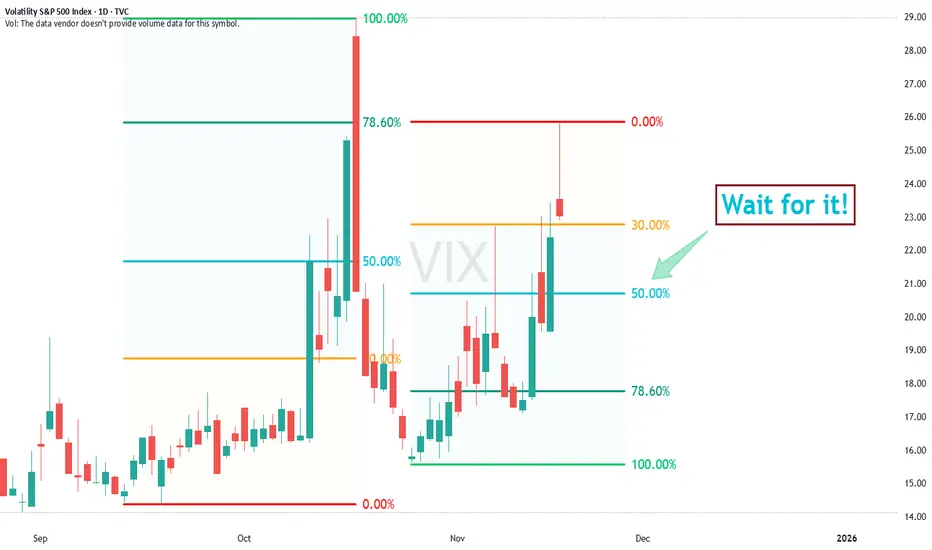
The VIX is Very ExpensiveVolatility has to dampen greatly for the institutional money to feel safe enough to get back into buying mode. Usually, a 50% retracement from recent highs marks a good signal for re-entry into the markets. We are clearly not their yet, but by the end of the week, we could be.
Fear is in the airWhat happens when the VIX monthly 8-21 and 34-50 EMAs cross over to the upside, individually and collectively? Occurrences of selling become more frequent and potent. TVC:VIX AMEX:SPY SP:SPX NASDAQ:NDX NASDAQ:QQQ COINBASE:BTCUSD

Why Every Investor Should Track the VIXThe VIX measures the market’s expectation of 30-day volatility using SPX option prices.
Because it reflects real-time hedging demand and fear levels, it tends to move violently during stress periods and collapse when investors become complacent.
This behaviour makes the VIX one of the most effective
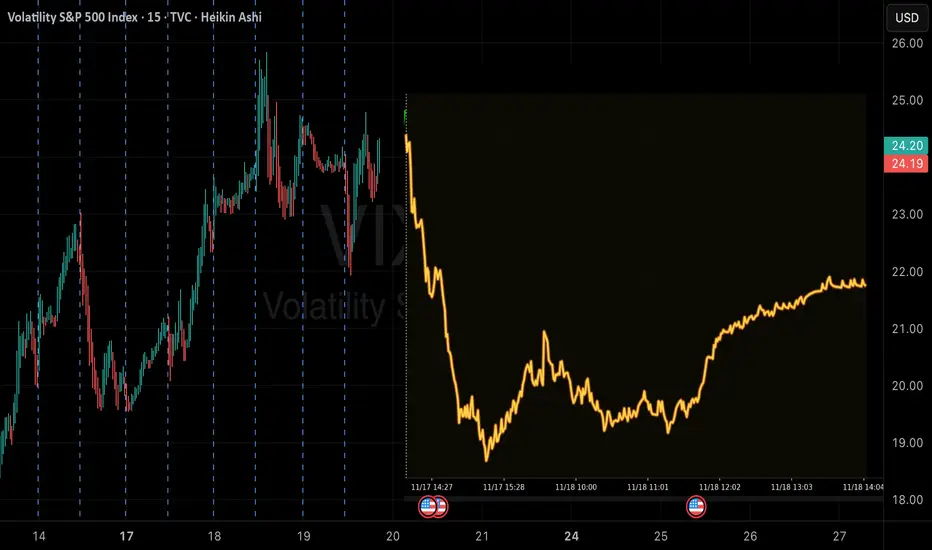
QuantSignals V3: VIX Poised for Potential Pullback – Handle WithVIX Weekly | QuantSignals V3 | 2025-11-20
Direction: PUT (Bearish)
Confidence: 58%
Expiry: 2025-11-28 (8 days)
Strike Focus: $23.00
Weekly Momentum: BEARISH (-1.17%)
Flow Intel: Neutral
Entry Price: Market (illiquid options)
Target 1: Price-dependent
Target 2: Price-dependent
Stop Loss: $2
QuantSignals V3: High-Confidence VIX DowntrendVIX QuantSignals Katy 1M Prediction (2025-11-19)
Current Price: $22.40
Trend: Bearish
Confidence: 75%
Volatility: 94.1%
Final Prediction: $20.98 (-6.34%)
30-Min Target: $21.10 (-5.81%)
Trade Signal:
Direction: PUT
Entry: $22.40
Target: $21.26
Stop Loss: $22.74
Expected Move: -6.34%
Summ
See all ideas
Summarizing what the indicators are suggesting.
Oscillators
Neutral
SellBuy
Strong sellStrong buy
Strong sellSellNeutralBuyStrong buy
Oscillators
Neutral
SellBuy
Strong sellStrong buy
Strong sellSellNeutralBuyStrong buy
Summary
Neutral
SellBuy
Strong sellStrong buy
Strong sellSellNeutralBuyStrong buy
Summary
Neutral
SellBuy
Strong sellStrong buy
Strong sellSellNeutralBuyStrong buy
Summary
Neutral
SellBuy
Strong sellStrong buy
Strong sellSellNeutralBuyStrong buy
Moving Averages
Neutral
SellBuy
Strong sellStrong buy
Strong sellSellNeutralBuyStrong buy
Moving Averages
Neutral
SellBuy
Strong sellStrong buy
Strong sellSellNeutralBuyStrong buy
Displays a symbol's price movements over previous years to identify recurring trends.
Frequently Asked Questions
The current value of Volatility S&P 500 Index is 16.34 USD — it has fallen by −5.11% in the past 24 hours. Track the index more closely on the Volatility S&P 500 Index chart.
Volatility S&P 500 Index reached its highest quote on Oct 23, 2008 — 96.40 USD. See more data on the Volatility S&P 500 Index chart.
The lowest ever quote of Volatility S&P 500 Index is 8.56 USD. It was reached on Nov 24, 2017. See more data on the Volatility S&P 500 Index chart.
Volatility S&P 500 Index value has decreased by −37.08% in the past week, the last month showed zero change in price, and over the year it's increased by 16.13%. Keep track of all changes on the Volatility S&P 500 Index chart.
Volatility S&P 500 Index is just a number that lets you track performance of the instruments comprising the index, so you can't invest in it directly. But you can buy Volatility S&P 500 Index futures or funds or invest in its components.