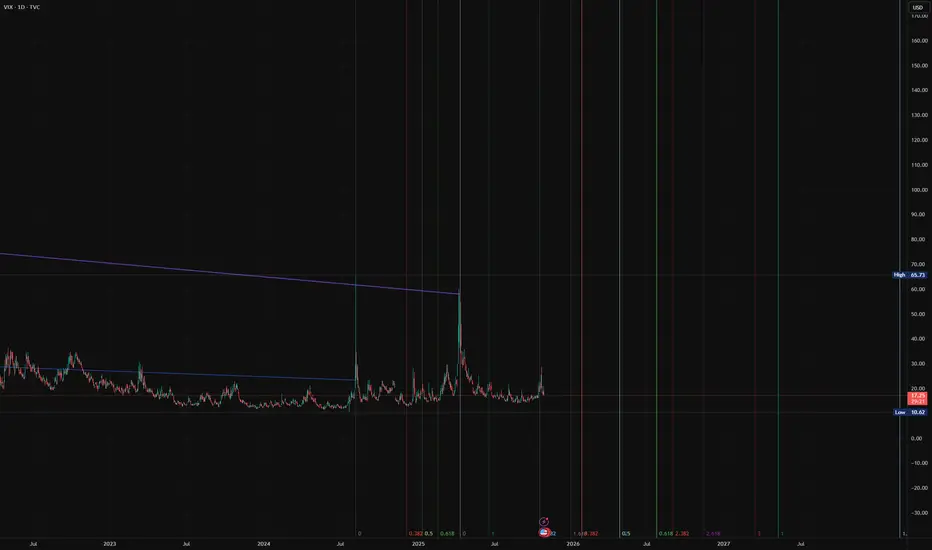
A scary fractal from 2020 Price is seeming to repeat what it did just before the covid crash. Seems like another massive VIX spike is coming soon.
Trade ideas

VIX Breakout Potential as Volatility Remains Elevated Current Price: $17.44
Direction: LONG
Targets:
- T1 = $19.75
- T2 = $21.50
Stop Levels:
- S1 = $16.50
- S2 = $15.75
**Wisdom of Professional Traders:**
This analysis synthesizes insights from thousands of professional traders who emphasize vigilance in volatility-based trades. Seasoned traders recognize VIX as a leading indicator of market sentiment, often reflecting investor fear or optimism. With the current market climate hinting at potential instability, the aggregated wisdom suggests keeping a close eye on VIX. By listening to market professionals, the underlying dynamics become clearer, helping to pinpoint actionable entry and exit points within the evolving cycles of volatility.
**Key Insights:**
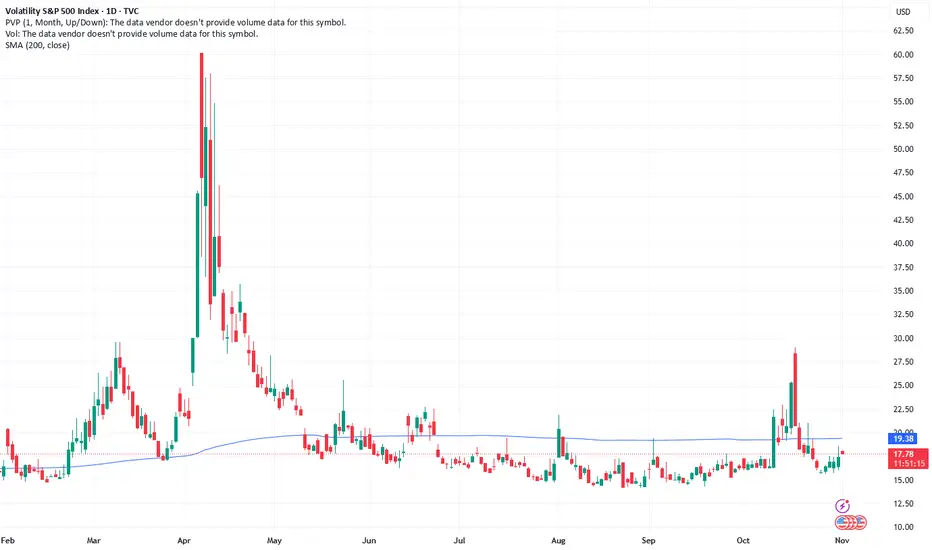
The VIX, also known as the fear gauge, has historically surged when market uncertainty spikes. Currently priced at $17.44, it remains well below this year’s volatility highs but is showing signs of a gradual uptrend driven by geopolitical concerns, upcoming earnings season fluctuations, and year-end portfolio rebalancing activities. Most traders agree that sub-$20 levels for VIX in such an environment represent an attractive entry zone for long-side exposure due to its asymmetric upside risks.
Seasonality is another factor influencing the potential for a breakout. Historical data suggests that heading into November and December, volatility tends to rise due to tax-loss harvesting season, economic data releases, and liquidity squeezes in global equity markets. Professional traders are also paying close attention to how rising bond yields might act as a catalyst for equity sell-offs, increasing demand for VIX derivatives and pushing the index higher.
**Recent Performance:**
Over the past month, the VIX has been trapped in the $16-$18 range, showing resilience against downside pressures. Despite its relative stability, recent wide-ranging moves in equities indicate that complacency may soon give way to rapid changes. Additionally, shifts in macroeconomic policy and bond market instability are subtly pushing volatility into an upward trajectory. There’s also technical evidence of reduced selling pressure, with VIX holding firm above its 50-day moving average for consecutive sessions.
**Expert Analysis:**
Technical analysts are highlighting a developing wedge pattern forming on the daily VIX chart, indicating a brewing breakout opportunity. RSI levels show the index still has plenty of room to run before hitting overbought territory. Experts believe this positions VIX for a move higher as macroeconomic uncertainties heat up. On the fundamental side, market professionals remain cautious about geopolitical instability and U.S. economic data releases in the weeks ahead, pointing to the resulting anticipated market volatility elevating VIX values.
Further sentiment insights reveal that institutional traders are ramping up their VIX exposure through options. The observed increase in demand for call options and a steepening VIX futures curve provides additional confirmation that a higher volatility regime could be on the horizon.
**News Impact:**
Recent data surprising both to the upside and downside—alongside hawkish commentary from central bank officials—has rattled global equities. Moreover, geopolitical escalations in Eastern Europe and the Middle East continue weighing heavily on investor sentiment. Combined, these factors create an environment conducive to elevated volatility, giving the VIX room to break out of its current consolidation range. The upcoming U.S. economic announcements regarding unemployment and CPI figures may exacerbate uncertainty even further, extending support for the volatility index.
**Trading Recommendation:**
Taking a long position in VIX offers a compelling opportunity for traders to hedge equity exposure or capitalize on rising volatility as uncertainty brews in broader markets. At $17.44, its current price lies in a historically attractive zone for long plays with measured risk. With strong seasonal trends, global political concerns, and technical indications pointing to a potential breakout, targeting $19.75 and $21.50 in the near term is aligned with trading wisdom. Traders should monitor stop-loss levels closely given the interdependent dynamics between equities and the VIX.
Do you want to save hours every week? Register for the free weekly update in your language!
Market is awfully bullishThe market in general is very bullish with many indices moving up higher and higher, but the price of gold has also been moving up higher which historically this doesn't end well. This could also mean that many allocation models have funds and liquidity being put into them. The bullish momentum can still continue but this is mainly year end flows following bullish sentiment into record highs along with the recent fed rate cut.

VIXTrading forex based on strong fundamentals is beneficial because it allows investors to make informed decisions grounded in real economic data rather than speculation. By analyzing key indicators like interest rates, inflation, GDP growth, employment, and geopolitical stability, a trader can anticipate currency movements driven by macroeconomic forces. This approach helps identify long-term trends and reduces emotional or impulsive trading, offering more consistent and sustainable profits. In essence, good fundamentals turn forex trading from a gamble into a strategic investment rooted in economic reality.

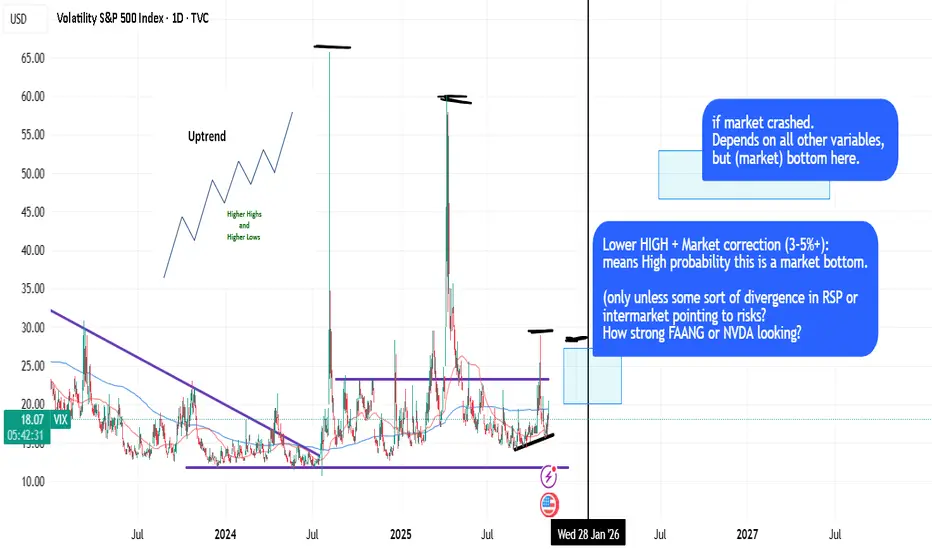
Using HLOW/LHIGH (Dow) + LOGIC to pinpoint probabilities.DOW Theory is the king of the stock market (Higher Lows, Lower Highs, uptrending, etc.) and it's quite basic concept to apply with logic.
Sometimes you can time the market (based on 50dma/200dma crosses, price extensions) and LHIGH dynamics and logic -> to pinpoint probabilities. Like, look at VIX dynamics during 2023/2024.
in short: DOW + LOGIC = PROBABILITY.
VIX breakout ? (aka SPY breakdown ?)Observations (not recommendations):
- Market looks toppish here
- everyone in "wait and see" mode, but wait what to the upside ?
- flip-side: any negative news could trigger next hiccup.
- VIX just touched support and bounced up.
Actions:
- Bought some VXX and TAIL on short leashes (tight stops). Any tweet or news could derail this!
VIX shortsVix shorts setting SPX and Nas for longs
It needs to close the Gap created
I want to see a correction

VIX is telling you.....It's sometimes really simple.
And simple is powerfull.
When the VIX. just like a stock,
creates higher lows after higher lows
for at certain amount of X time/months,
sooner or later we get the explosion of the VIX.
Looking at a currently very overpriced stockmarket
right now, you don't need to be an expert to see what coming.
I didn't say exactly WHEN, but you KNOW it's coming.
It's only a question of time.
And that some event will become the needle that pricks the bubble.
Don't say you didn't see this coming, after is has happened.
They said the same back in 2009.
#VIX
#bearmarket


VIX set for downside as equity markets maintain stability Current Price: $16.37
Direction: SHORT
Targets:
- T1 = $15.75
- T2 = $14.50
Stop Levels:
- S1 = $17.60
- S2 = $18.50
**Wisdom of Professional Traders:**
This analysis draws on the expertise of thousands of market participants who closely watch the Cboe Volatility Index (VIX) for key signals regarding market sentiment and risk appetite. Shorting the VIX is often viewed as an opportunity to capitalize on periods of calm market conditions amidst bullish equity trends. Professional traders leverage volatility measures to assess the risk/reward dynamics of short-term movements, making collective intelligence critical for identifying high-probability setups when the VIX is range-bound or near its lower key levels.
**Key Insights:**
The VIX, nicknamed the "fear gauge," represents 30-day forward expectations of S&P 500 volatility and is historically inversely correlated with equity market performance. As the S&P 500 continues its bullish trajectory in 2025, supported by strong economic growth and robust corporate earnings for Q3, the VIX has remained suppressed around current levels. The lack of major macroeconomic shocks, coupled with stable monetary policy signaled by recent Federal Reserve meetings, provides a strong case for muted volatility through the rest of the fourth quarter. October is historically prone to heightened volatility due to earnings releases and fund rotation; however, this year, October's relative calm suggests a continued subdued trading environment for volatility instruments.
Renewed uncertainty from geopolitical shocks or unexpected inflation reports could challenge this thesis, yet positioning data shows institutional investors are heavily weighted toward risk-on equities, reducing the odds of significant VIX spikes. Traders are therefore leaning bearish on the VIX, as its behavior mirrors complacency among market participants and continues to reflect oversold conditions typical of low-stress environments.
**Recent Performance:**
The VIX has hovered between $15 and $18 over the past month, failing to break sustainably above resistance levels even amid short-term risk-off sentiment triggered by fleeting concerns about Fed policy adjustments and debt ceiling discussions earlier in October 2025. Recent weeks have seen no signs of significant volatility-driven market disruptions, with high levels of trading volumes in the S&P 500 and further narrowing of spreads in derivative contracts. On a year-to-date basis, the VIX has declined roughly 20%, further reinforcing expectations for a low-volatility regime into the end of 2025.
**Expert Analysis:**
Technically, the VIX is showing bearish signals on multiple fronts. The Relative Strength Index (RSI) remains below its neutral zone, indicating weak upward momentum and persistent seller pressure. Analysis of moving averages highlights a bearish consolidation pattern, with minimal support expected beyond the $15 level. VIX futures contracts also reflect lower implied volatility premiums, creating favorable conditions for short sellers. Options analysts further note reduced hedging activities among institutional investors, which typically signals lower expectations for abrupt market shakeups. Experts agree that the absence of significant economic or geopolitical risks, alongside broad equity market resilience, creates an ideal window for downside volatility trades in Q4 2025.
**News Impact:**
Positive developments in corporate Q3 2025 earnings have boosted equity sentiment and suppressed volatility expectations. Major S&P 500 components have outperformed analyst forecasts, reducing concerns about revenue growth in a higher-rate environment. Meanwhile, Federal Reserve commentary during their October meeting reinforced dovish signals, suggesting interest rates are unlikely to be adjusted significantly through December 2025. Global geopolitical tensions remain low, providing further relief to markets and suppressing implied volatility pricing through the remainder of the fiscal year.
**Trading Recommendation:**
Short the VIX at $16.37 as the index continues to languish near key support levels, reflecting a lack of strong upward catalysts. With markets sustaining stability and corporate earnings driving positive sentiment, opportunities to benefit from lower volatility are abundant. Place stop-loss levels conservatively at $17.60 or $18.50, ensuring proper risk management in case of unexpected news shocks. Target downside moves toward $15.75 and $14.50 as profit-taking benchmarks, taking advantage of current market complacency to lock in gains. Traders should stay disciplined and review macroeconomic updates regularly, leveraging flexibility as conditions warrant adjustments to positions.
Do you want to save hours every week? register for the free weekly update in your language!
VIX fib based time extension on past high vol patterns.This is a rough estimate, but it looks about the same as all of the previous times. The chart is public so feel free to copy and publish. You have my full permission. Here's a link - sharing is on, and most layers are hidden (and on BTCUSD since that's usually what I trade)
VIX will spike soon with Gold / Silver crashingThis am Gold and Silver have been coming down hard, and will likely keep tanking as supply cannot be met breaking trust in the supply chain. It's happened every other time.
Maybe nothing, but VIX is very nicely positioned now. May use UVIX as a proxy.
Best of luck!

the dead cat bounce in stocks?This channel is not providing individualized trading or investment advice, nor is it a banking service, brokerage service, trading service, investment service or money management service

VIX OCT 2025The VIX has rebounded sharply from the 18–20 support zone, showing clear institutional absorption. Price is now approaching a key weekly resistance at 30–35, which also aligns with a gap that could act as a short-term magnet.
If volatility expands further, the next upside targets are 35 (gap fill) and 50 (historical 2017 tariff zone).
If rejected at current resistance, downside support levels remain at 20 and 15–18.
#VIX #globaltrade #investment #investing #stockmarket #wealth #realestate #markets #economy #finance #money #forex #trading #price #business #currency #blockchain #crypto #cryptocurrency #airdrop #btc #ethereum #ico #altcoin #cryptonews #Bitcoin #ipo

Fear is Rising in the MarketVIX (Volatility aka Fear Index) rose more than 25.5% since last week
However, S&P is just down around 2.0% from its all time high (6764.5)
Are markets preparing for a crash????

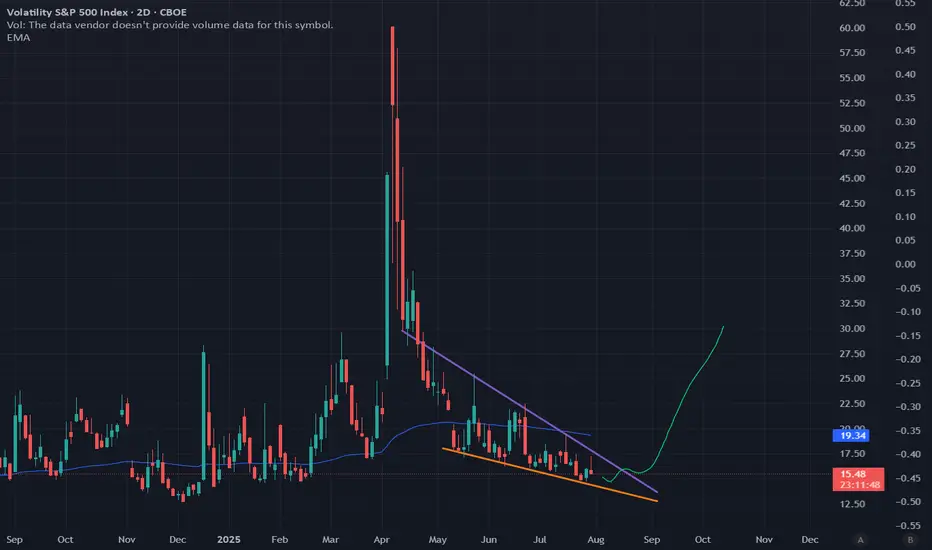
Unprecedented VOL suppression will lead to VIX October explosionAccording to my discussions with ChatGPT and analyzing various metrics we are currently in one of the longest periods, if not *the longest* period, of Vol suppression in the entire history of volatility.
Zooming out and looking at the current chart pattern VIX is very clearly in a falling wedge, which means its falling days are numbered.
Once you see a daily close breach of the upper boundary of the upper wedge channel, I would consider buying some VIX 30 calls for Oct 22 expiration.
Once VIX pierces 25, take profit and close the option.
Good luck and happy trading!

VIX The Calm Before the Next Wave of Volatility! Recession RisksAfter last week’s sharp selloff across equities and crypto, followed by a swift recovery on Monday, many traders are once again lulled into a sense of comfort. But beneath the surface, volatility is quietly building — and the VIX is starting to tell the story.
From Panic to Complacency — Too Fast
Friday’s market crash revealed how fragile sentiment still is. We saw broad-based liquidations, risk-off flows, and a short spike in volatility as traders scrambled for protection. Then, as if nothing happened, Monday brought a sharp rebound — driven by short-covering, dip-buying algos, and a belief that the correction was “overdone.”
Geopolitical Flashpoints: U.S.-China Tensions
The ongoing conflict between the U.S. and China over critical metals exports has intensified. China controls a large portion of rare earth metals, essential for electronics, batteries, and defense technology. Recent U.S. threats to impose sanctions or tariffs on key exports, coupled with potential Chinese retaliatory measures, have created uncertainty for supply chains.
Markets hate uncertainty. Every news cycle mentioning trade escalation acts like a volatility catalyst, as investors hedge against unexpected economic shocks. This alone can drive the VIX higher, even if the S&P 500 has short-term rallies.
Trump Tariff Threats and Market Psychology
Adding fuel to the fire, former President Trump has repeatedly hinted at renewed tariff measures. While the headlines may seem political theater, history shows that even the anticipation of tariffs can disrupt equities and spark short-term volatility spikes.
Friday’s selloff can be partially attributed to traders pricing in these geopolitical and policy risks, which are not reflected in earnings reports or fundamentals — making hedging through VIX-linked products increasingly attractive.
Earnings and Economic Signals
Beyond geopolitics, the earnings season will likely reveal weak spots across sectors. Companies exposed to global supply chains, tech hardware, and industrials may report margins under pressure. This combination — disappointing earnings and global trade uncertainty — often precedes volatility expansions.
Historical patterns show that VIX rises ahead of earnings dispersion and macro shocks, as investors scramble for protection against downside surprises.
Potential upside target: 25+ if earnings disappoint and SPX breaks below $6000
Calling Donald's bluff , hahahaIs it coincidence or a shrewd political strategy of Trump to repeat what he had previously used in April this year on the stock market ?
Back then, nobody knows what cards was on his sleeve and the Fear index shot up to a high of 60. The stock market had a mini crash on 4/4/25 and took a few days to recover, ie 9/4/25.
Much like the far away thundering claps that sends chills down one spine and look for shelter to hide, there was but little rain effect. This time, the game is similar and the big boys responded quickly, having studied his track records.
Too many retail investors were still mourning their losses or had already sold off, hopefully with profits or those who leveraged a lot and bought at high were the scapegoats!
Within a day, the stock market recovers! OMG , this is so incredible and how manipulative a market can be! And compare the 60 points VIX in April against the 20+ points this time, the fear was still there but probably not so great huh?
China, did they fall for his trick ? Obviously not ! They went ahead to impose export tariffs on some other sectors! And well, Trump did tweet that all is fine and he will be meeting President Xi soon! How fickle minded or shrewd he is , haha.
Three things I have learnt thus far :
1. IF you have itchy fingers and want to punt, please use a small % of your capital to bet on the stocks/ETF/crypto/currency you want. AND put a stop loss and profit target to it. Just treat it as lottery.
2. NEVER go on margin trading - never mind how lucky or good others show off their portfolio on social media winning 678 figures.
3. ALWAYS invest in fundamentally good companies and when Trump gives you a present like this - share prices drop 5-8%, it is a screaming buy/accumulation on those counters! This is far more important than item 1 (imagine you bet too much here and lost )as you need to stand by capital !
The bull market continues ............things are again back to normal ..........until............
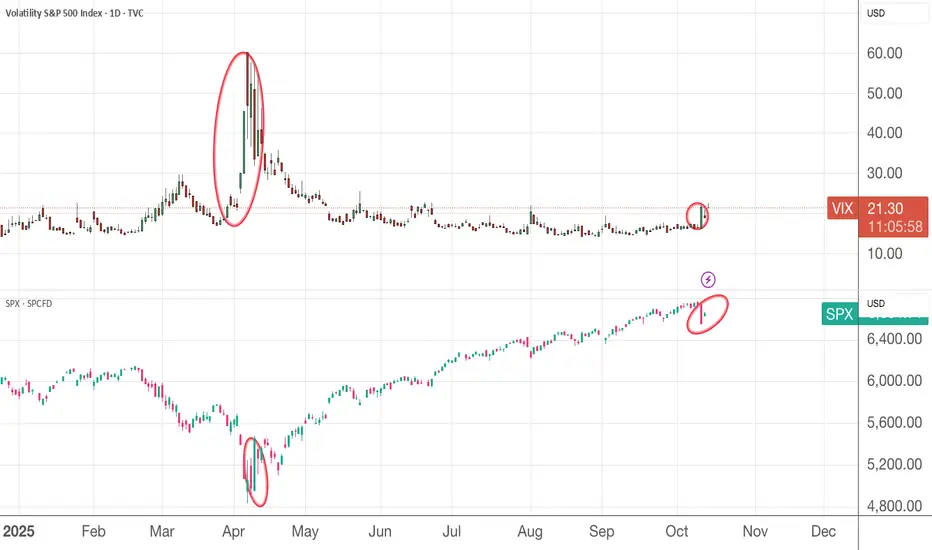
VIX 15-Minute Outlook — Market Fear Expands Ahead of Oct. 13Last week’s market crash wasn’t just a sell-off — it was a volatility awakening.
The VIX (Volatility Index) surged more than 31% on Friday, closing near 21.65, its highest level in months. What triggered this spike wasn’t purely technical — it was a perfect storm of policy shock, stretched positioning, and emotional reaction from traders caught off guard.
What Happened Last Week
Midday Friday, news broke that the U.S. administration was preparing to impose a 100% tariff on Chinese imports, reigniting fears of a trade war.
The market, which had been complacent and heavily long, immediately flipped into panic mode. SPY sold off sharply, and the VIX — often called the “fear gauge” — exploded upward from 17 to 22+ in just hours.
On the 15-minute VIX chart, we saw a clean Change of Character (CHoCH) around the 17.2 zone, signaling the end of calm conditions. Moments later, volatility confirmed a Break of Structure (BOS) above 21.5, marking the start of a new volatility regime — fear officially entered the market.
Smart Money had already positioned early, accumulating volatility exposure (buying protection) before the spike. Once the news hit, that protection paid off while late buyers rushed to hedge losses. It was classic volatility expansion — fast, aggressive, and emotional.
Current Technical Picture
The short-term trend on the 15-minute chart remains bullish for volatility.
VIX is respecting its ascending structure with clear higher highs and higher lows. The MACD still leans positive, though momentum has cooled slightly after the initial surge. The Stoch RSI has reset near 25–30, suggesting volatility could reload for another push higher if fear doesn’t fade at Monday’s open.
The key battleground now sits between 20.6 and 22.2. Holding above 20.6 keeps volatility structurally strong. A breakout above 22.2 could trigger another fear wave, potentially sending VIX toward 23.5 or even 25+.
If volatility compresses and dips under 18.5, it signals that the market is calming — possibly the start of a short-term relief rally in SPY.
What to Expect This Week
Heading into Monday, Oct. 13, traders should prepare for a tug-of-war between fear and relief.
Volatility rarely moves in one straight line — after a massive breakout, a short-term pullback is normal. However, as long as VIX stays above the 20 zone, the market remains vulnerable to more sharp swings.
If there’s no new positive headline over the weekend, expect continued caution at the open. Futures could gap down slightly before stabilizing. If VIX holds above 21 and starts rising again, that would signal institutions are still hedging — which means SPY could retest last week’s lows around 650 or lower.
If VIX fades back toward 18–19 early in the session, that would support a relief bounce across equities, especially in oversold tech names.
My Outlook
VIX has clearly entered a bullish volatility phase, driven by a mix of policy risk and trapped long positioning. The fear trade is now dominant, and volatility is unlikely to vanish overnight.
The market’s emotional reset last week is similar to what we see before deeper corrections — strong panic, a short-lived bounce, then a retest of the lows.
Unless we see a sharp drop in volatility back under 18, I expect continued choppiness, fast reversals, and wide ranges early in the week. For SPY traders, treat every bounce as a potential short setup until VIX confirms it has cooled off.
The focus Monday should be on whether VIX stays above 20.6. That level is the new fear threshold — as long as it holds, volatility remains in control, and equities will stay fragile.
Key VIX Levels to Watch:
Resistance: 22.2 → 23.5 → 25.4
Support: 20.6 → 18.5 → 17.2
My Bias:
Bullish on volatility (bearish for SPY) as long as VIX remains above 20.6. Expect intraday whipsaws but overall risk-off tone if no positive catalyst emerges.
Disclaimer: This analysis is for educational purposes only and not financial advice. Always do your own research and trade responsibly.

VIX vs BrentAs long a crude oil price has a large impact on inflation rates, it is relevant to measure against VIX index which measeures market volatility at SP500. Last years this index is no longer measuring stock status but big 5 or 7 tech companies. Anyway there is still a strong relation between this two values

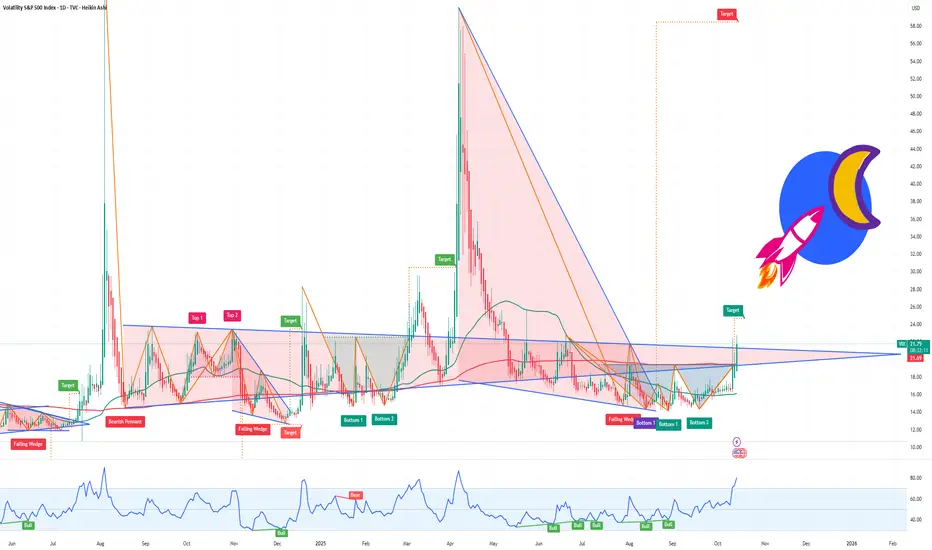
VIX seems ready to take offIt seems a regular pattern where TVC:VIX breaks the descending trendline and explodes to the upside.
