#UMA 200 % PUMP Loading#UMA 200 % PUMP Loading..
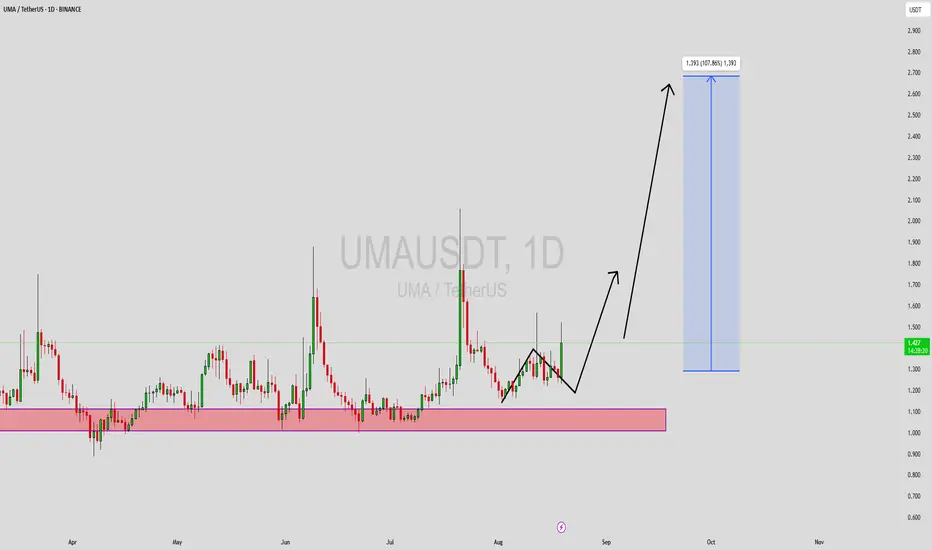
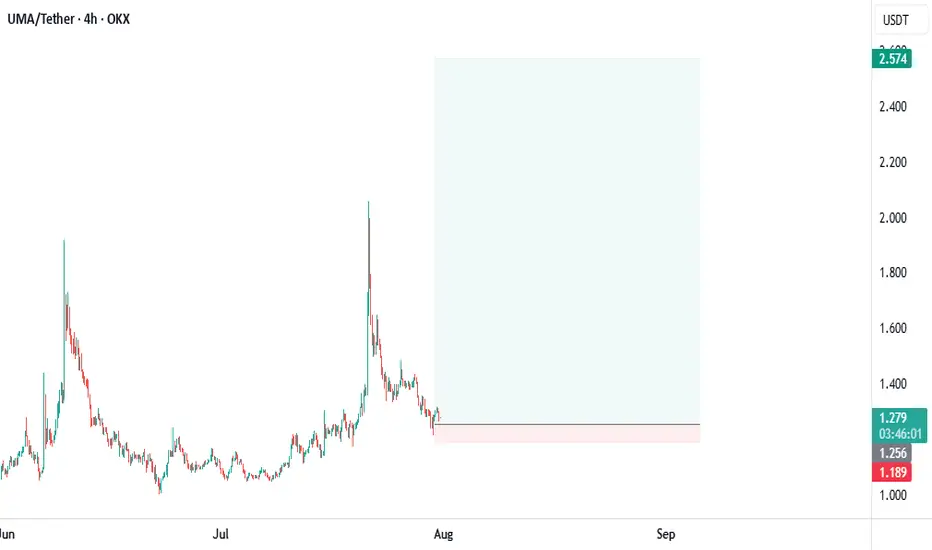
After falling to the buying zone, UMA could see an upside momentum of more than 200 %. Now, all coins will have some upside movement, but it will be temporary. I will keep providing all updates here.

UMAUSDT Forming Bullish WaveUMAUSDT is currently demonstrating a bullish wave pattern, signaling strong upward momentum and trend continuation. This wave formation suggests that the coin has entered a healthy impulsive phase, where higher highs and higher lows are forming consistently. The recent price action shows accumulatio

UMAUSDT — Major Battle at Demand Zone, Waiting for Breakout?🔎 Overview
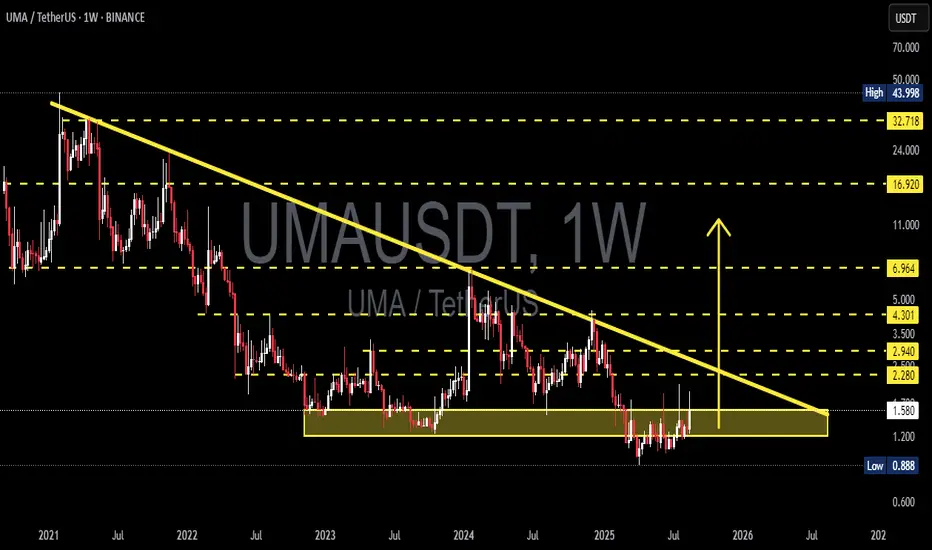
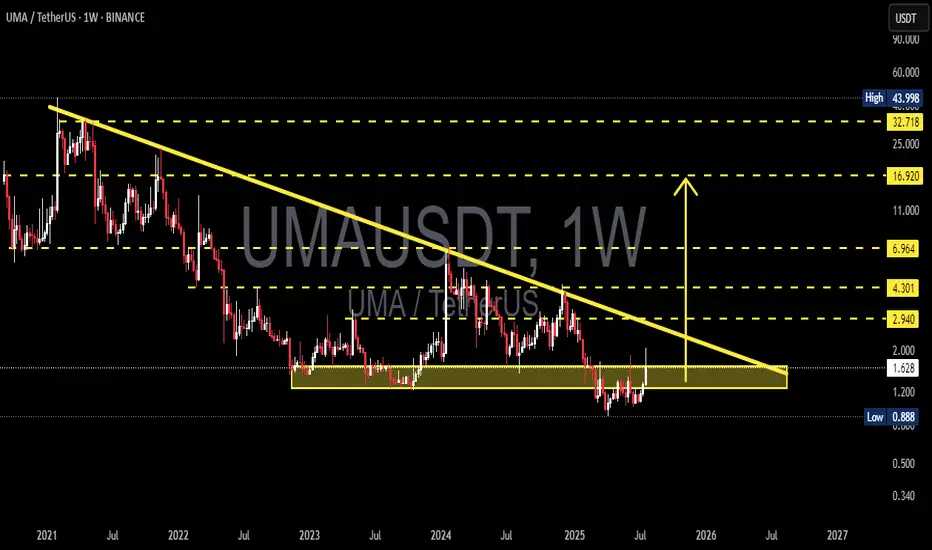
The weekly chart of UMA/USDT is showing a very interesting setup:
Since 2021, price action has been consistently forming lower highs, capped by a long-term descending trendline (yellow line).
On the other side, buyers continue to defend the strong demand zone at 1.20 – 1.70 (yellow box
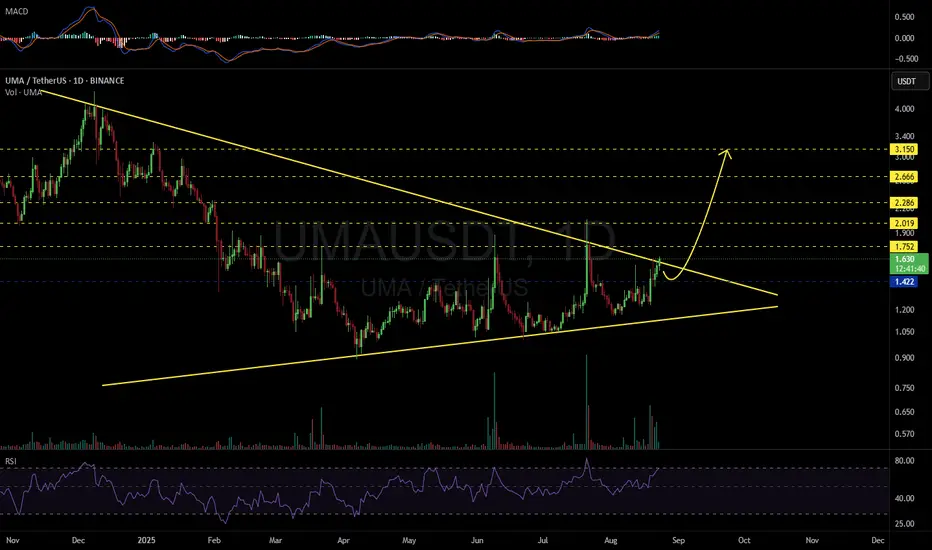
UMAUSDT 1D#UMA is moving inside a symmetrical triangle on the daily chart and is on the verge of breaking out above it. Consider buying at the current price and near the support level of $1.422.
If the breakout is confirmed, the potential targets are:
🎯 $1.752
🎯 $2.019
🎯 $2.286
🎯 $2.666
🎯 $3.150
⚠️ As alwa
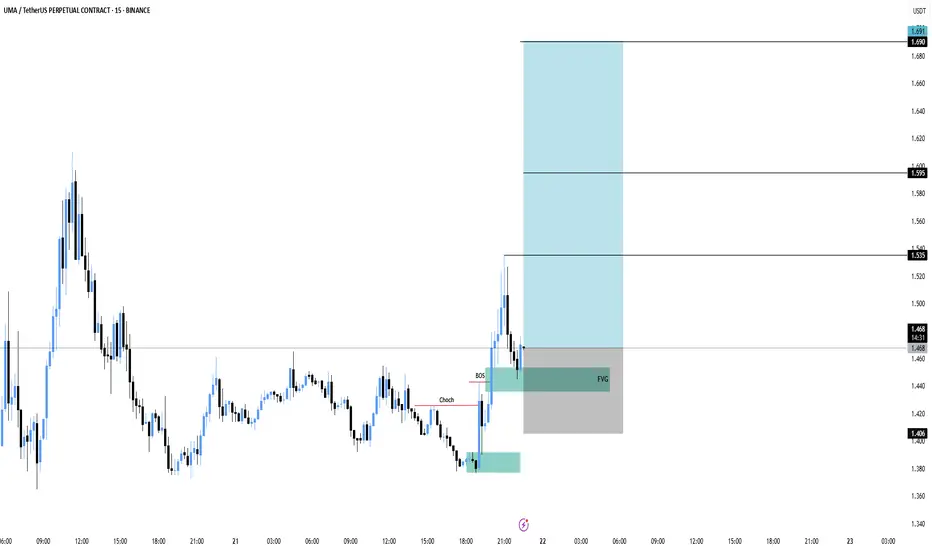
UMA Loading a Big Move – Don’t Miss This Setup!UMA has shown a clear change of character with a bullish break of structure. Price is now retesting the fair value gap (FVG) area, setting up for a possible continuation move upward.
Entry: 1.47
Stoploss: 1.406
Targets:
1.535
1.595
1.691
If buyers defend the FVG zone, UMA could rally toward hig
UMAUSDT Forming Bullish WaveUMAUSDT is currently demonstrating a bullish wave pattern, signaling strong upward momentum and trend continuation. This wave formation suggests that the coin has entered a healthy impulsive phase, where higher highs and higher lows are forming consistently. The recent price action shows accumulatio

UMAUSDT Forming Bullish WaveUMAUSDT is exhibiting a strong bullish wave pattern, signaling a powerful upward momentum that could drive the price significantly higher in the coming sessions. This pattern often indicates a healthy continuation of trend following a consolidation or corrective phase. The current structure suggests
#UMA is 102% ready for the pump#UMA is 102% ready for the pump..
Hold Tight And Enjoy Ride.
!! Om Nmah Shiavye !!
$ Namaste $
UMA/USDT Weekly Analysis – At the Edge of Compression?📉 Chart Overview:
UMA/USDT has been in a long-term downtrend since its peak in 2021. For nearly three years, price action has been trapped within a descending triangle pattern, forming consistent lower highs while holding a strong horizontal support zone around $0.88 – $1.20.
Over the last two yea
UMA · $6.65 Easy Target · Much Higher Possible Late 2025 · 1220%$6.65 is actually a very easy and conservative target. We tend to cap profits potential when we approach the market using leverage. When doing spot, we get all the targets all the way to a new all-time high—price discovery—and beyond.
Here we have a very strong bullish chart setup. Consider this. W

See all ideas
Summarizing what the indicators are suggesting.
Oscillators
Neutral
SellBuy
Strong sellStrong buy
Strong sellSellNeutralBuyStrong buy
Oscillators
Neutral
SellBuy
Strong sellStrong buy
Strong sellSellNeutralBuyStrong buy
Summary
Neutral
SellBuy
Strong sellStrong buy
Strong sellSellNeutralBuyStrong buy
Summary
Neutral
SellBuy
Strong sellStrong buy
Strong sellSellNeutralBuyStrong buy
Summary
Neutral
SellBuy
Strong sellStrong buy
Strong sellSellNeutralBuyStrong buy
Moving Averages
Neutral
SellBuy
Strong sellStrong buy
Strong sellSellNeutralBuyStrong buy
Moving Averages
Neutral
SellBuy
Strong sellStrong buy
Strong sellSellNeutralBuyStrong buy
Displays a symbol's price movements over previous years to identify recurring trends.