UNIUSDT Can it fly?Hello Dears 👋
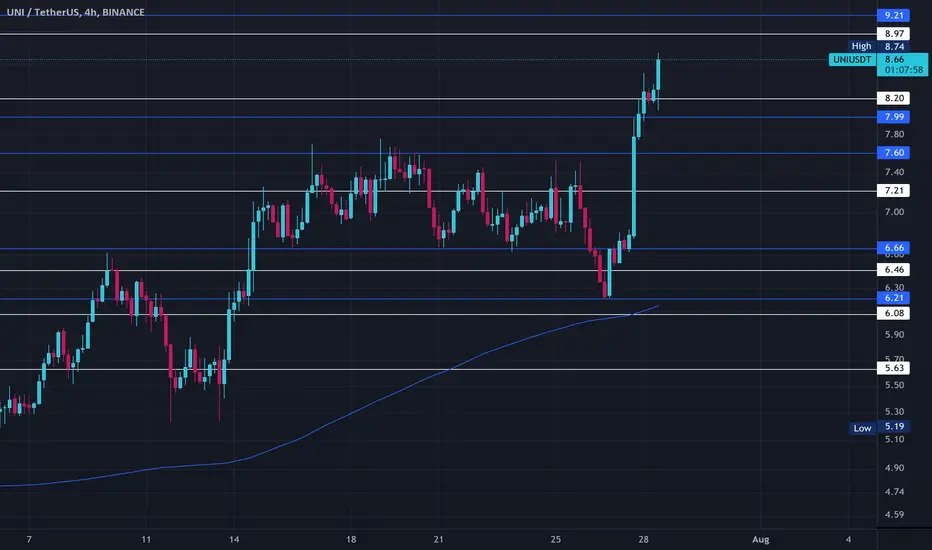
Some indicators indicate the upward trend of Uniswap, considering that the flag pattern chart has also been formed, I hope we will see a good upward trend in the coming hours.
Please write me your comments
thanks
UNIUSDT.3L trade ideas


Clean bullish Wolfe Wave on $UNI.Missed out on the perfect entry on $UNI, but I will start accumulating now (even if we dip a little bit considering Bitcoin has a tendency to misbehave while ranging). Targeting around $8 as a target. Could be worth keeping some for after $8 if the market sentiment turned bullish in general.

UPDATE: UNI UP 83% after bullish signal - Ready for more 🚀UNI pumped 83% after the bullish Supertrend Ninja - Clean signal (green vertical line on the background).
UNI broke out of the bullish Zone of the Ichimoku Cloud , which is bullish . The RSI is in the bullish zone at 69. If we take a look at the Average Directional Index ( ADX DI) its bullish . The +DI (Green Line) is above the -DI (Red Line). Although the green line is pointing downwards. The Trend Strength is still strong. Since the ADX (Orange Line) is above its 9 Period EMA (Black Line).
Currently UNI is also above its Bollinger Bands Upper Band, Band Basis 20 Period SMA . A retrace within the Bollinger Band and the ADX pointing downwards, means a retrace is more likely. Note: UNI also hit the resistance (grey block).
Waiting patiently on a bullish Supertrend Ninja signal served me well.
Thank you for reading.
Namasté 🙏
Disclaimer: Ideas are for entertainment purposes only. Not financial advice. Your own due diligence is highly advised before entering trades. Past performance is no guarantee of future returns.
What Indicators Do I Use:
In the chart I am using the "Supertrend Ninja - Clean", which is a trend-following indicator (Green and red vertical lines on the background). When the background of the candlestick closes green (vertical line). It indicates a possible bullish (up)trend. And red for downtrends.

Week 07 | UNIUSDT | Short Position | H1 | 29-07-2022UNIUSDT has made AB=CD bearish harmonic pattern after the retracement from 0.618 fib level. There is strong resitance as well. Bearish inside bar shows that bullish trend has been finished but for confirmation we will wait for the higher low to break. So taking a short position at this level.

UNI long profit. forecast !UNI was pushed up a lot, the ascending channel was broken, I think we will test it in the near future and fly further!
In order not to miss a buy signal, subscribe and stay tuned for new ideas. Every day I post 10 profitable ideas a day.

UNIThe price is trying to break through the 200 EMA for the first time since November 2021. If successful, the price will rise to $12. The bearish scenario will lower the price to the lower border of the channel or to 100 EMA

UNIUSDTiam watching this one for 2 days it broke all resistance the next target for me is 9 but if in daily timeframe break the sma 200 we can see much more uptrend .
UNIUSD ❕ decreased volatilityThe volatility at the price peak began to decrease.
UNI entered overbought zone (4H TF)
TD Sequential formed a reversal signal downwards (4H and 30m TFs)
Price formed a bearish divergence with RSI and trading volumes on the 1H Timeframe.
BB indicator is overbought (30m TFs)
I expect that the asset will start a correction only after fixing under the support level.


UNIUSDT | TESTING RESISTANCEUNIUSDT has been in bullish trend after breaking out falling resistance. The price has retraced to 0.5 fib level. While the same zone is also a horizontal resistance area. The bullish momentum may halt here. The bears may took control from here.
While bullish momentum will be now only above break and sustain above resistance zone.
Trade your levels accordingly.

UNIUSDT 3D A unicorn appears on the Uniswap chartToday, let's take a look at the UNIUSDT trading pair on the 3-day time frame.
In general, the classic scheme, as for most altcoins - the price has been in a falling channel for more than a year.
But on the UNIUSD chart we see some cunningly hidden power of buyers, it seems to us that something interesting is being prepared around Uniswap.
Maybe some strong fundamental news is on the way?) Share, please, in the comments, because we don't follow such.
In general, the following route looks realistic for the coming month:
- correction in the area of 6 dollars (retest level that did not let up for a long time)
- fixing UNI price in the upper part of the global descending channel.
- rapid growth in the region of $12-13, and this is modest x2)
_______________________________
Since 2016 , we have been analyzing and trading the cryptocurrency market.
We transform our knowledge, trading moods and experience into ideas. Each "like under the idea" boosts the level of our happiness by 0.05%. If we help you to be calmer and richer — help us to be happier :)

UNIThe price may continue its impulse growth to the upper border of the rising wedge, after which the correction will begin

UNIUSDTPERPAfter the failure of the support zone in this currency, a pullback and price drop is expected, and it seems to be an attractive position for a sell position.

UNIThe price fell to the lower border of the wedge and 100 EMA. In case of a breakdown of the lower border, the price will fall by 200 EMA/MA. Possible scenarios of price movement are indicated

UNI (bullish flag)UNI / USDT
This coin is one of most impressive coins during bear market and running over 50% in spot after we bought it
Currently it printed a bullflag which is a bullish continuation pattern : a break above this pattern may produce another bullish toward 9$-12$
The only concern these days is BTC , because altcoins wont do much when the king is in decline thanks to the bad international economic environment in background..etc
However we will monitor the price action at resistance if bullflag broken ,, the chance for next bullish wave is high
