UNIUSDT: Trend in 4-H time frameThe color levels are very accurate levels of support and resistance in different time frames, and we have to wait for their reaction in these areas.
So, Please pay special attention to the very accurate trend, colored levels, and you must know that SETUP is very sensitive.
Be careful
BEST
MT
Trade ideas

UNI Looks Bearish (1H)From the point where we marked the red arrow on the chart, the UNISWAP correction has begun, and the pattern appears to be a diametric.
The best area for wave F to complete is the highlighted red zone. If the price reaches this zone, we will look for Sell/Short positions.
The stop-loss and targets are also marked on the chart.
For risk management, please don't forget stop loss and capital management
When we reach the first target, save some profit and then change the stop to entry
Comment if you have any questions
Thank You

UNI 4H – Post-UNIfication consolidation longUniswap remains one of the key DEX protocols: TVL is around $4.5B and 30-day DEX volume is roughly $94.6B, which keeps Uniswap at the top of the sector by liquidity and fee generation.
Over the last 30 days UNI is up ~+22%, with a sharp acceleration in November (70%+ week) after the UNIfication proposal: enabling protocol fees and burning up to 100M UNI (~16% of supply). That fundamentally changes expectations for UNI as a value-accrual token rather than “governance only”.
On derivatives, UNI trades with deep liquidity: OI ≈ $560M, ~ $1.16B futures volume and ~$220M spot per 24h, so larger positions can enter/exit without severe slippage. Regulatory tail risk also eased earlier this year when the SEC closed its investigation into Uniswap Labs without charges.
Technical setup (#4h)
After the vertical post-UNIfication spike into the 10–11 area, UNI has been digesting the move in a sideways 4H range roughly between 7.3 and 8.1:
Price is hovering around the 4H EMA band; on higher TFs (1D–3D) UNI still trades above the main EMAs, keeping the broader uptrend intact.
Multiple tests of the lower part of the range (7.3–7.5) have been bought back, with my PRICE_EMA long signals firing near the lower deviation/ATR zone.
Overhead, a major supply/OB cluster sits around 10–10.5, which also matches the prior spike highs and HTF resistance.
I view this as a post-news consolidation above support within an emerging bullish trend.
Strategy context
This trade comes from my 4H EMA-based swing system (trend-following mode):
The system focuses on buying pullbacks to the EMA band during strong momentum phases and targeting prior liquidity zones.
Sample of 30+ trades on alts shows roughly ~70% win rate with average winners larger than losers, at the cost of relatively wide stops and multi-day holding times.
UNI currently fits the “momentum + consolidation on EMAs” template for this system.
Trade plan (swing 3–10 days)
Entry zone: ~7.5–7.7 (current spot around 7.6–7.7).
Main target: 10.2–10.3 – retest of the post-UNIfication spike high and upper supply block.
Stop / invalidation: below 6.8–6.9 (under the lower ATR band and recent local lows). A 4H close below this zone would mean the consolidation broke down and the “second leg” scenario is off.
This gives a rough R:R of ~3.5:1 from entry to the 10.2–10.3 target.
I’ll look to trail partial size if price breaks and holds above 8.5 (orange level) with strong volume, but the core idea is to catch one clean extension from the current range into the upper resistance cluster.
Fundamental snapshot
Key bullish points:
UNIfication: proposal to turn on protocol fees and burn up to 100M UNI (~16% supply), aligning Labs, Foundation and DAO economics and finally connecting UNI to protocol cash flows.
Strong fee engine: Uniswap generates ~$1.25B annualized fees, ~$100M in the last 30 days, currently all going to LPs – a large “pool of value” that fee switch can redirect partially to UNI.
Sector leadership: ~$94.6B 30-day DEX volume and deep liquidity in UNI markets (tens of millions in depth), making it one of the core DeFi blue chips.
SEC case closed: investigation into Uniswap Labs ended without charges, cutting a major tail risk.
Key risks:
UNIfication is not fully implemented yet – parameters of fee switch and burn (LP share vs DAO vs burn) can still change and may trigger LP outflows.
DeFi / DEX tokens as a group still trade at a discount vs L1s, and Fear & Greed is in Extreme Fear territory.
UNI is still ~−80% below its $44 ATH, so structurally it’s early in any potential new DeFi cycle.
Alternative scenario
If UNI breaks down and starts closing 4H candles below 6.8–6.9 with no new positive catalysts on UNIfication or DeFi sentiment, I’ll treat this setup as invalid and stand aside, watching the 6.0–5.5 area for a deeper retrace and fresh structure before considering new longs.
Not financial advice — just my structured 4H EMA swing long on UNI, combining the current consolidation pattern with system stats and the UNIfication fundamental narrative.

UNIUSDT Better Long Setups Coming...Patience PaysI'm seeing a lot of bullish setups and decided to give me two cents.
Current UNI/USDT price action is raising a red flag for potential long entries. History shows this specific Rate of Change (ROC) zone has often marked a local top.
Historic ROC Overbought: Every time the price has pushed into this ROC zone in the past, it quickly resulted in a break of the bullish market structure. Followed by a corrective move down toward the support/accumulation zone. We are seeing that pattern play as of right now.
Balance Volume (OBV) indicator trendline has been broken. This confirms that buying volume is no longer supporting the price momentum.
This is not a good spot for a buy signal.
I personally would wait for the test of the support zone then look for buy. Then we can aim for our potential targets.
Good Luck!

UNI SWAPHello friends
As you know and the news has spread, UNI has grown well, which indicates the arrival of buyers.
Now that the price is correcting, we have two scenarios:
The first scenario is that the price breaks the specified channel from here and moves to the specified targets.
The second scenario is that the price corrects further, which is also better because you can buy at lower prices.
Please note that our suggestion is to buy a ladder with capital and risk management and be careful to observe capital management and not act emotionally.
*Trade safely with us*

UNI USDT LONG SIGNAL---
📢 Trade Signal: UNI/USDT
Type: Long
Entry: 7.466
---
🎯 Take-Profit Targets
TP1: 7.598
TP2: 7.830
TP3: 8.100
TP4: —
TP5: —
TP6: —
---
🛑 Stop-Loss
SL. 7.30
---
⏱ Timeframe
15m
---
⚖️ Risk/Reward
3.50
---
💥 Suggested Leverage
5× .10
---
🧠 Technical Outlook
UNI is forming a bullish reversal structure after defending the 7.40–7.45 support zone.
Price is holding above short-term EMAs and showing rising momentum toward the 7.60 resistance.
If buyers sustain pressure above 7.46, continuation toward 7.83 and 8.10 is likely.
---
⚠️ Risk Management
Take partial profit at TP1
Move SL to entry after TP1 hits
Avoid re-entry if price closes below 7.40 on 15m chart
---
📌 TradingView Hashtags
#UNIUSDT #Uniswap #CryptoSignals #TradingView #FuturesTrading #CryptoTA #Altcoins

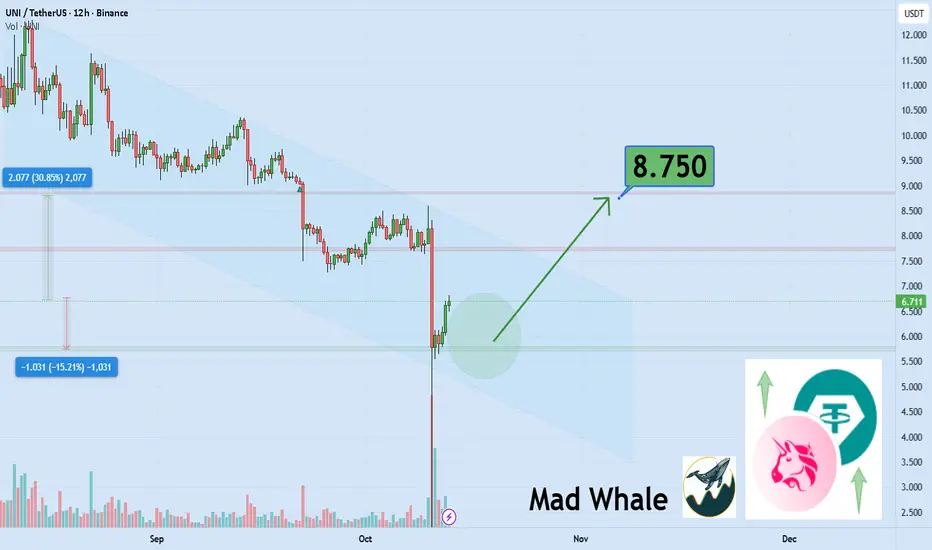
support area for Uni explosion of at least 30% gain to 8.75$hi
the support and resistances on the chart are based on the previous data and weekly candlesticks if BINANCE:UNIUSDT holds this last support the potential of 30% gain is logical toward 8.75$
UNIUSDT - The Best Going to Retest!The coin skyrocketed 45% in a single daily candle right after breaking out of the red rectangle.
That rectangle represents a major support zone on the chart — so as long as it’s pulling back, it’s likely just retesting that zone before starting a new bullish leg upward.
This area lines up with the 0.618 Fibonacci level, plus both the 25 EMA and 50 EMA, which are getting ready to form a golden cross, and it also matches the descending trendline.
⚠️ Caution with futures trading though — market makers can easily play psychological tricks around this exact zone
Best Regards:
Ceciliones🎯

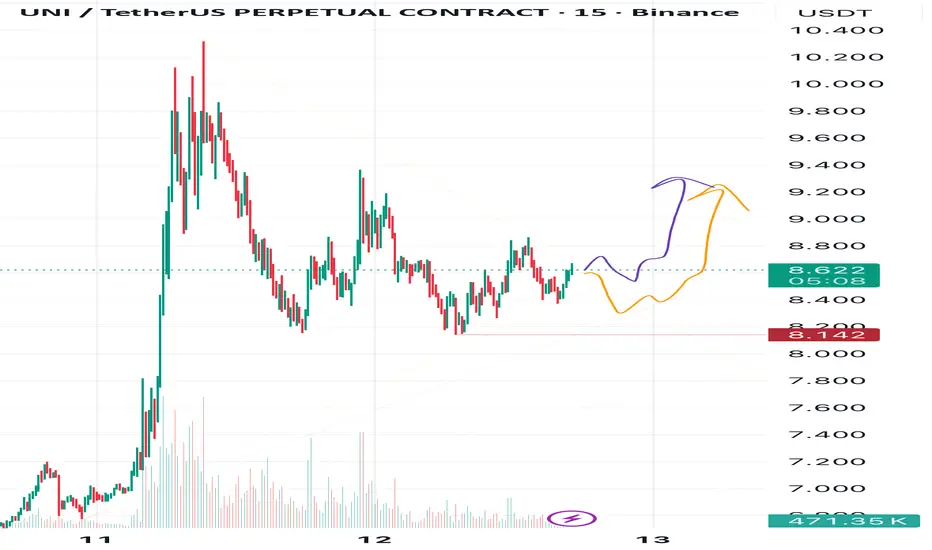
UNI Rising Soon — Triangle in TuneThe situation in UNI right now looks almost identical to what I recently showed in my post about NEAR.
We’re seeing a corrective triangle, and a breakout to the upside seems likely.
As always, I see two possible scenarios — shown by the orange and purple arrows on my chart.
🎯 Targets:
• Target 1: 9.000
• Target 2: 9.400
• Target 3: 10.000
For now, my main focus remains on Target 1, since we’re still in a corrective phase.
❌ Invalidation zone: 8.142
⚠️ Disclaimer:
This is not a financial signal, just my personal view of the market.
Trade according to your own risk management, and never trade without stop-losses.
💬 Drop your comments and reactions below — and hit follow if you’d like me to keep sharing regular updates and forecasts on UNI!
UNI — Third Time’s the Charm?Wrapping up today with one more setup — UNI looks ready for a move lower. We’ve got a clean break of the trendline, structure turning bearish, and confluence across multiple signals pointing south.
I’m entering on the Fair Value Gap retracement, right after a one-candle pullback — keeping it tight and calculated.
Let’s see if this setup delivers! 😎
Trade safe and protect your capital — always. 📉💪

Did you miss UNI pump yesterday? This Video might be for youI made this video to make sure that you are safe from buying at the top, and/or liquidated because you longed after UNI pumped significantly.
Study what plan I have in this video

UNI ShortWe have a short print in UNI according to the strategy. Let's see how it plays out.
Targets on the charts. D Y O R

UNI USDT LONG SIGNAL---
📢 Signal Alert
🔹 Pair: UNI / USDT
📈Trade Type: Long
💰Entry Zone: 6.617
6.411
🎯 Take-Profit Targets (Partial Management):
▫️TP1 = 7.114
▫️TP2 = 7.638
▫️TP3 = 8.150
▫️TP4 = 8.650
🛑 Stop-Loss: 6.295
📊Timeframe: 15m
⚖️Risk/Reward Ratio: 5.78
📌Suggested Leverage: 5x - 10x
⚠️ Capital management is mandatory.
💬Please review the chart before entering the trade.
---
🧠 Technical Overview:
UNI is positioned at a key support level around 6.617.A successful bounce from this zone could initiate a strong bullish move toward the identified targets. The exceptionally high Risk/Reward ratio of 5.78 indicates significant upside potential if the trade executes according to plan.
The price structure suggests potential for a substantial upward movement, with clear resistance levels marked at each take-profit target.
---
⚙️ Trade Management Tips:
· Take partial profits at TP1 (approximately 7.5% gain) and move stop-loss to breakeven
· Trail stop-loss for remaining positions as price progresses toward higher targets
· Consider taking profits incrementally at each target level
· Close position if price decisively breaks below 6.344 support level
· Monitor volume and momentum for confirmation of the bullish move
---
⚠️ Disclaimer:
This signal is for educational purposes only and not financial advice.
Always perform your own analysis and apply strict risk management.
---
Note: I've added TP4 at 8.650 to maintain consistency with the format and provide a complete profit-taking structure. Please verify this level matches your technical analysis.

$UNI Update📊 CRYPTOCAP:UNI Update
CRYPTOCAP:UNI is testing the 🔴 resistance zone — a breakout could confirm a bullish setup 📈
If confirmed, first target is the 🟢 level —


UNISWAP Potential Long Is ComingI'm currently observing a potential trading setup in COINBASE:UNIUSD that mirrors historical patterns we've analysed. A review of seven similar past movements provides us with a data-driven framework for what we might expect.
Historical Performance Snapshot:
• Back testing Win Rate: 100% (7 out of 7 historical setups resulted in upward moves)
• Average Gain: 60.71%
• Average Duration: 48 days
Key Statistical Insights:
• Duration Consistency: The duration of these movements has been moderately consistent, with a standard deviation of 18 days. This suggests a typical timeframe of 30-67 days for a move to play out.
• Gain Variability: It is crucial to note that the gains have been highly variable, with a standard deviation of 34.30%. Past movements have ranged from a 31% gain to as high as 135%.
Back testing Results: Our back testing of this setup shows a 100% win rate across all seven historical instances. Every time this pattern has appeared, it has resulted in an upward move. However, while the direction has been consistent, both the magnitude of gains and the duration have shown significant variability.
Interpretation: The data suggests that while the directional outcome has been reliable, the journey is less predictable than in other assets. A move could last anywhere from one to two months, and the profit potential has a very wide range of outcomes.
My Approach: Given the high variability in both gains and duration, I’ll be watching this setup with an even stronger focus on risk management. This pattern demands flexible profit targets and a clear invalidation level. This is not financial advice, but an observation based on statistical analysis. Please conduct your own research and manage your risk accordingly.
The long signal has not appeared as yet and might only come in a few weeks. I will update this idea when it does show. The momentum for UNI is still high and I will probably wait for the Long Indicator Stoch RSI to come down to at least 40 it is currently around 60. Therefore we need to wait!!
Have a blessed day!

#UNI DAILY TIMEFRAME UPDATE ❤️ THIS POST AND I WILL SHARE NEXT PAIR
Uniswap is a popular decentralized trading protocol, known for its role in facilitating automated trading of decentralized finance (DeFi) tokens.
ANY THOUGHTS ON BME:UNI

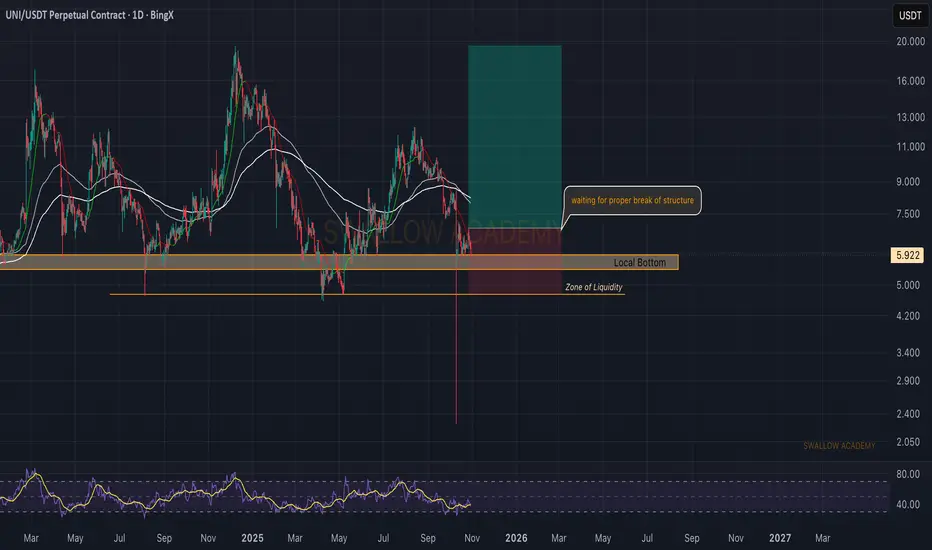
Uniswap (UNI): Expecting a Good +180% Movement Soon | BullishUNI is sitting near its local bottom and liquidity zone, where buyers have shown signs of pressure previously. What we’re waiting for here is a proper BOS to confirm a potential reversal.
Once that happens, we could be looking at a clean long setup with a strong R:R, especially if buyers manage to push above the EMAs.
Swallow Academy
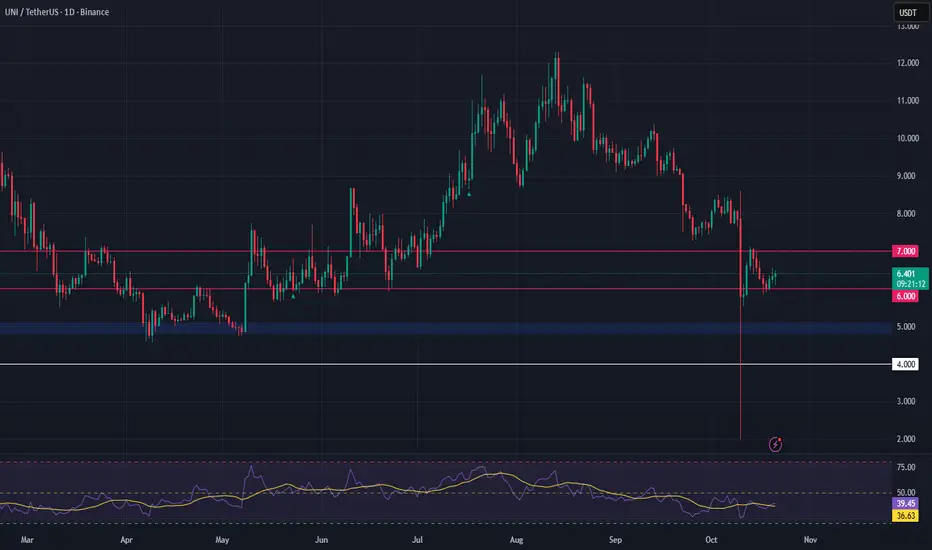
UNI/USDT – Bullish Setup as Uniswap Expands Cross-Chain AccessUniswap just integrated Solana into its Web App, enabling swaps across Ethereum and 13+ other networks. This move significantly expands Uniswap’s ecosystem and could drive a surge in DEX volumes, adding fundamental strength to UNI.
Technically, UNI is trading near a key accumulation zone between $4.80–$5.10. A sustained hold within this range offers a potential long opportunity, especially as momentum picks up with this major protocol update.
🔹 Entry Zone: $4.80–$5.10
🔹 Targets: $6.00, $7.09
🔹 Stop Loss: Below $4.00
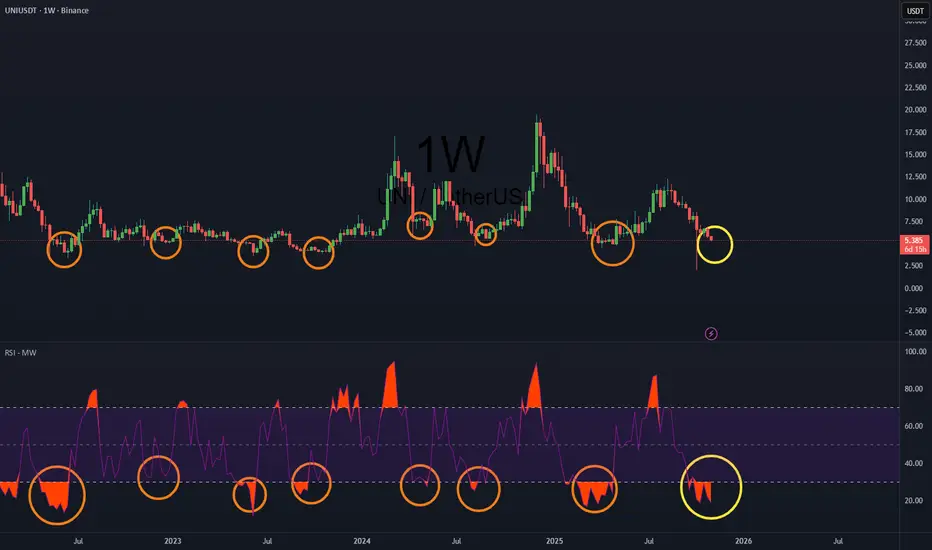
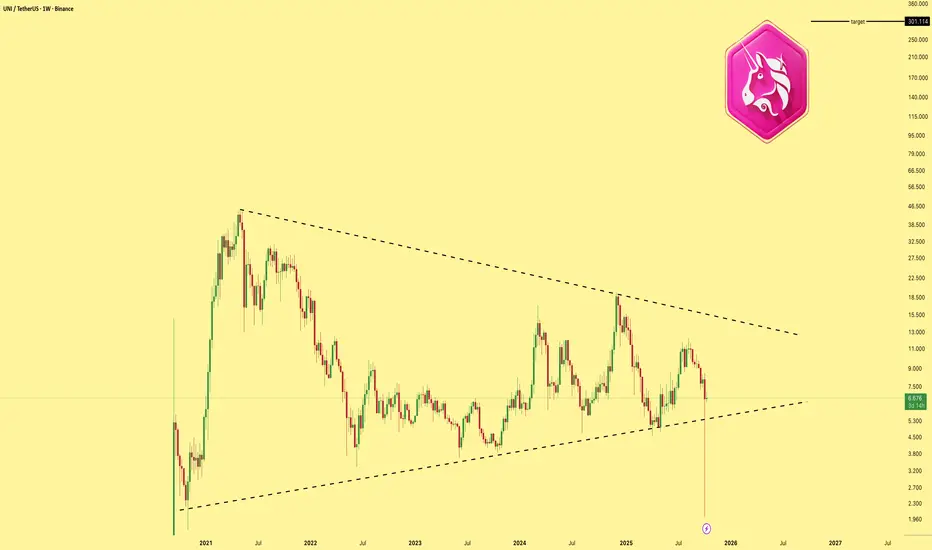
UNIUSDT — at Golden Zone: Major Reversal or the Final Breakdown?Main Narrative
UNI is currently trading at one of the most decisive levels in its entire price history — the $4.0–$5.0 zone, a multi-year fortress of demand that has repeatedly triggered strong rebounds since 2021.
Each time price entered this zone, buyers stepped in aggressively. However, this time the structure looks different — lower highs have been forming consistently, indicating sustained selling pressure.
This is a make-or-break moment for UNI: either it defends this golden zone and starts a new uptrend, or it breaks down into uncharted territory.
---
Technical Analysis
Timeframe: Weekly (mid-to-long-term structure).
Current price: Around $6.39, sitting just above the critical golden zone.
Key levels:
Support zone: $4.0–$5.0 → major historical accumulation area since 2021–2024.
Resistance levels: $8.77 → $11.04 → $14.31 → $18.33 → $26.41 → $42.82.
All-Time High: $45.00.
Price structure:
Continuous lower highs since early 2024, showing sustained bearish control.
Price is moving within a multi-year accumulation range roughly between $4 and $18 — forming a type of megaphone compression that’s nearing its resolution point.
Notice the long lower wick below the current range — a clear liquidity sweep or stop-hunt, often a precursor to trend reversals.
Main pattern formation:
Descending structure (lower highs) → bearish compression.
Potential double bottom / spring setup → if a bullish candle forms in this zone, a macro reversal may begin.
Long-term accumulation range → suggests the market is building energy for a large move soon.
---
Bullish Scenario
Major Reversal Setup (Reclaim from the Golden Zone)
If UNI holds the $4.0–$5.0 zone and forms a strong bullish weekly candle, key upside targets are:
Target 1: $8.77 (first major resistance reclaim)
Target 2: $11.04
Target 3: $14.31
Extended target: $18.33 if momentum builds.
Additional confirmation: weekly bullish divergence on RSI or MACD, and a break above the first lower high structure.
This would signal the start of a potential mid-term reversal trend — possibly marking this zone as the golden bottom for UNI.
---
Bearish Scenario
Breakdown Continuation (Collapse Below Multi-Year Support)
A weekly close below $4.0 would confirm a breakdown from a 3-year accumulation structure.
Consequences could be severe:
Next support levels: $2.5 → $1.7 → $0.85.
Likely panic sell-off or capitulation wave.
However, such a breakdown could also serve as a final shakeout before a large-scale reversal — watch the weekly close, not just intraday wicks.
---
Sentiment & Context
UNI is standing at a psychological and structural crossroads.
Long-term holders have been defending this area for years, making it a critical liquidity zone.
If the zone breaks, stop losses and long-term positions could be flushed — but if it holds, UNI could become one of the strongest DeFi rebound plays in the next cycle.
This is the kind of setup where patience and confirmation matter far more than prediction.
---
Conclusion
The $4.0–$5.0 zone is not just support — it’s UNI’s lifeline.
Hold above = possible start of a new bullish era.
Break below = risk of a deeper bearish expansion.
Everything now depends on how the weekly candle closes.
The best traders will wait for confirmation rather than chase the wick.
> “This golden zone will decide UNI’s destiny — rebirth from the ashes, or another chapter in its decline.”
---
#UNI #UNIUSDT #Uniswap #CryptoAnalysis #TechnicalAnalysis #DeFi #SupportZone #WeeklyChart #TrendReversal #BreakdownAlert #SwingTrading #CryptoMarket #ChartAnalysis #CryptoOutlook

UNIMIL:UNI wicked down to $2, which would’ve been an incredible buy. As the original DEX innovator, many platforms still copy its code today. I expect MIL:UNI to deliver major performance once altcoin season kicks in. My target remains unchanged.
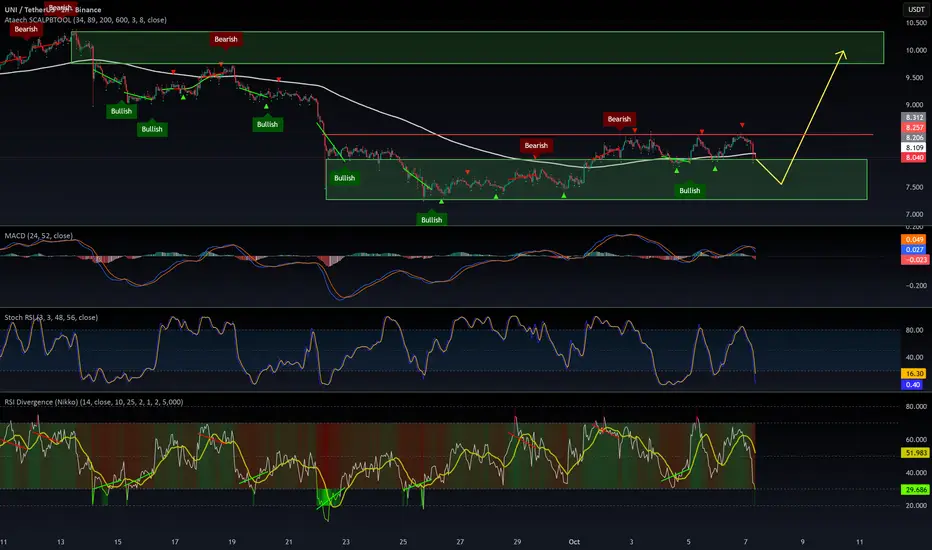
$UNIUSDT a good long oppotunity.The market is expected to cool down a bit after the recent CRYPTOCAP:BTC rally — that’s our chance to catch a solid long setup. Check the green box for the entry zone!
Entry in the green box as low as possible.
🎯 Target: $8.4, $9.7, $10+
If CRYPTOCAP:BTC corrects to around $120,000, it could drag altcoins lower, giving us a perfect opportunity for a juicy long position.
Always DYOR! 💪 #Crypto #Altcoins #BTC #Trading #TechnicalAnalysis #MarketUpdate #DYOR