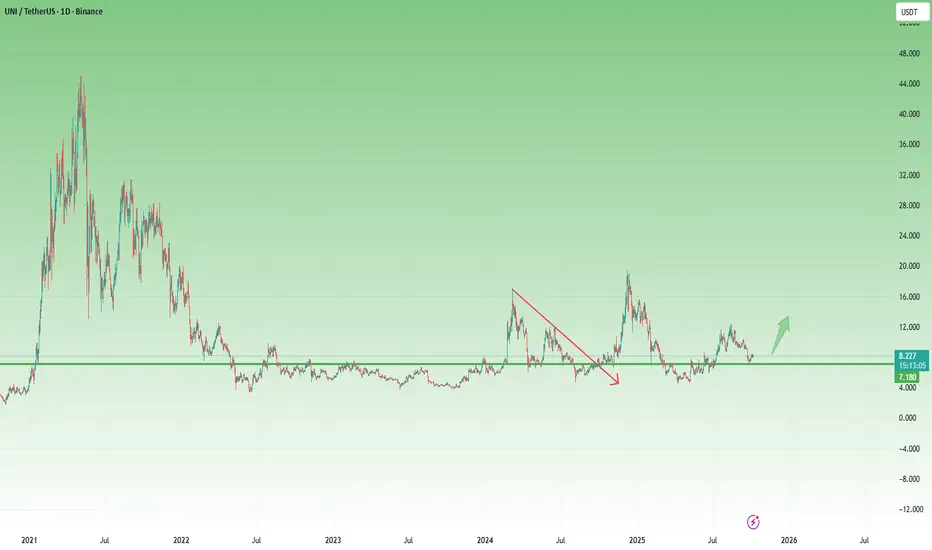
Uniswap Holding above $7 — Bullish Setup AheadAfter the massive 90% drop from its 2021 peak, Uniswap has been consolidating within a wide range. Each attempt to break higher has so far been followed by a return toward the lower end of the structure — a clear sign of prolonged accumulation.
What’s particularly interesting is how the $7 zone has
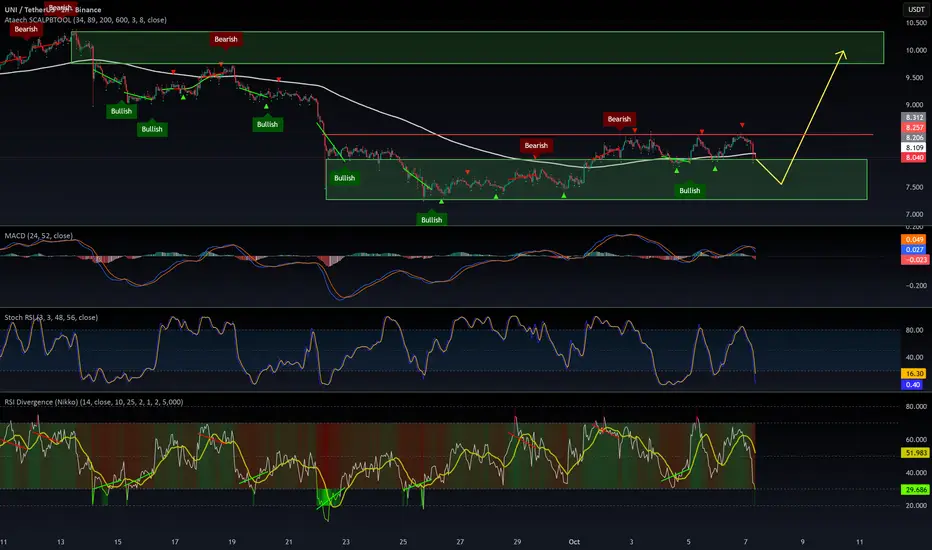
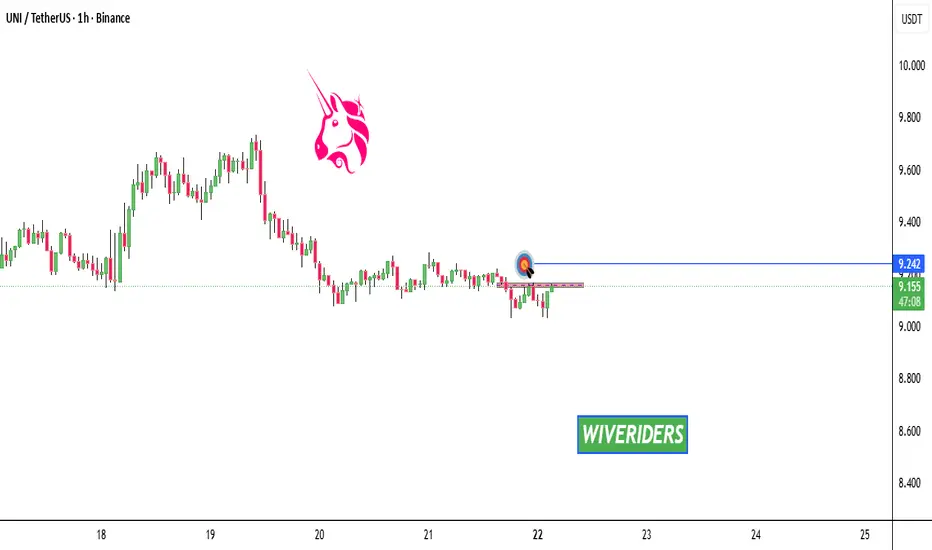
$UNIUSDT a good long oppotunity.The market is expected to cool down a bit after the recent CRYPTOCAP:BTC rally — that’s our chance to catch a solid long setup. Check the green box for the entry zone!
Entry in the green box as low as possible.
🎯 Target: $8.4, $9.7, $10+
If CRYPTOCAP:BTC corrects to around $120,000, it could d
A $300 $UNI token?so it might sound unrealistic — until it’s not. That’s essentially a 10x from here followed by another 3x extension. With altseason approaching, DEX tokens deserve a spot in every serious portfolio. These platforms can easily spark momentum through new airdrops, fee-sharing models, or expanded token

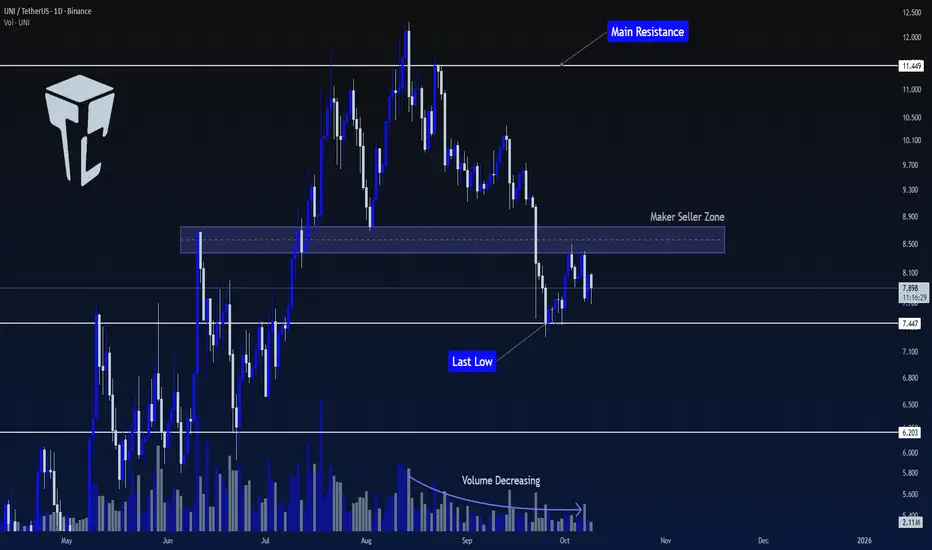
TradeCityPro | UNI: Key Levels and Bullish Continuation Setup👋 Welcome to TradeCity Pro!
In this analysis, I’m going to review UNI, one of the most popular DEX projects within the Ethereum ecosystem, with a market cap of $4.93 billion, ranking 28th on CoinMarketCap.
📅 Daily Timeframe
This coin has shown a strong upward move reaching 11.449 and then started a
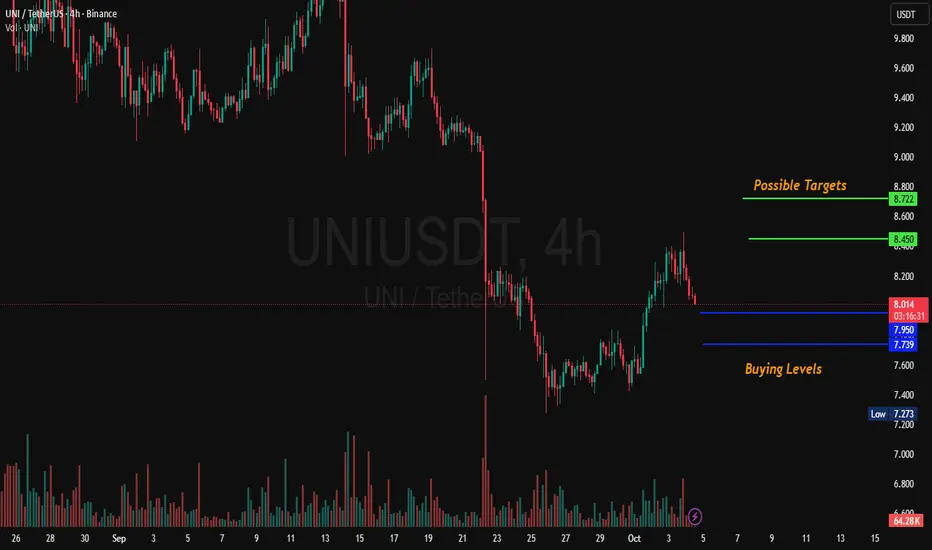
Uni 4H Trade IdeaHere is a trade idea for UNI on 4 hour TF. Entry & Exit Points are given. NFA. DYOR.

UNI 4H AnalysisBME:UNI Has started upward momentum. Key buying area are marked as 7.95 & 7.739. Possible targets are also given on the chart. NFA DYOR.
Uniswap approaches key support, potential 20% surge to 11$Hello✌️
Let’s analyze Uniswap’s price action both technically and fundamentally 📈.
🔍Fundamental analysis:
A new proposal could send 65% of Uniswap fees to UNI stakers, making the token yield-bearing.
If approved, UNI may see strong demand, but delays could slow momentum.
📊Technical analysi
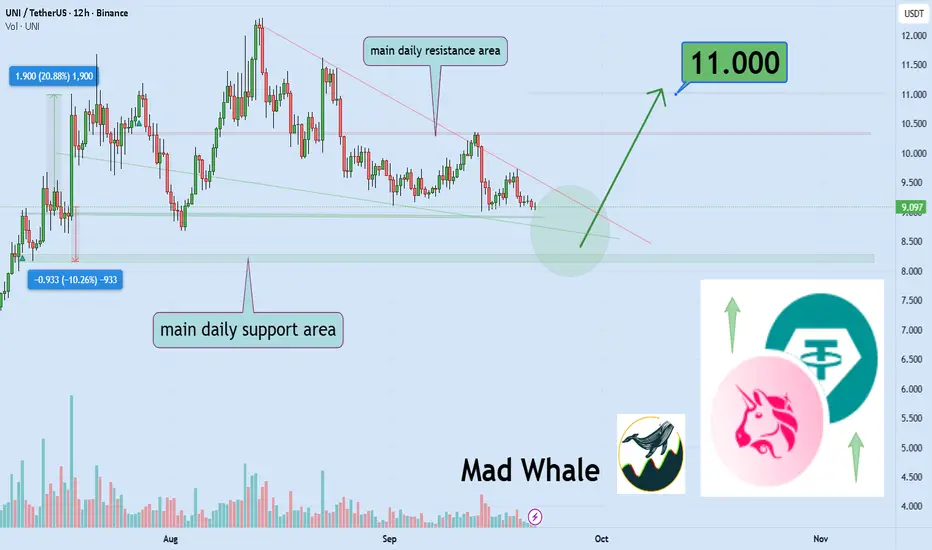
UNI/USDT – Daily OutlookUNI is approaching the 7.7 – 7.8 demand zone after significant bearish pressure. This zone will act as a crucial decision point.
If demand holds, UNI may rebound and retest the 10.3 resistance, which also serves as the validation level for the Head and Shoulders pattern. A breakout above this level

UNI is forming a potential double bottom pattern📊 BME:UNI Market Update
BME:UNI is forming a potential double bottom pattern 🔄. If it breaks out of the red resistance zone 🔴, the first target will be the 🔵 blue line level 🎯.
$UNIPUMP Token Slumps, Leads Meme Coin Losses: Pump.fun’s native token, PUMP, recently slumped, leading losses among meme coins like Dogecoin, PEPE, and BONK, as the market stumbled.

See all ideas
Summarizing what the indicators are suggesting.
Oscillators
Neutral
SellBuy
Strong sellStrong buy
Strong sellSellNeutralBuyStrong buy
Oscillators
Neutral
SellBuy
Strong sellStrong buy
Strong sellSellNeutralBuyStrong buy
Summary
Neutral
SellBuy
Strong sellStrong buy
Strong sellSellNeutralBuyStrong buy
Summary
Neutral
SellBuy
Strong sellStrong buy
Strong sellSellNeutralBuyStrong buy
Summary
Neutral
SellBuy
Strong sellStrong buy
Strong sellSellNeutralBuyStrong buy
Moving Averages
Neutral
SellBuy
Strong sellStrong buy
Strong sellSellNeutralBuyStrong buy
Moving Averages
Neutral
SellBuy
Strong sellStrong buy
Strong sellSellNeutralBuyStrong buy
Displays a symbol's price movements over previous years to identify recurring trends.