Next report date
—
Report period
—
EPS estimate
—
Revenue estimate
—
20.80 INR
7.59 B INR
464.51 B INR
564.02 M
About UPL Limited
Sector
Industry
CEO
Jaidev Rajnikant Shroff
Website
Headquarters
Mumbai
Founded
1969
IPO date
Feb 26, 1996
Identifiers
2
ISIN INE628A01036
UPL Ltd. engages in the business of manufacturing and sale of pesticides, insecticide, and micronutrients. It operates through the following segments: Crop Protection, Seeds Business, and Non-Agro. The Crop Protection segment includes the manufacture and marketing of conventional agrochemical products, and other agricultural related products. The Seeds Business segment manufactures seeds. The Non-Agro segment focuses on the manufacturing and marketing of industrial chemical and other non-agricultural related products. The company was founded by Rajnikant Devidas Shroff on May 29, 1969 and is headquartered in Mumbai, India.
Related stocks

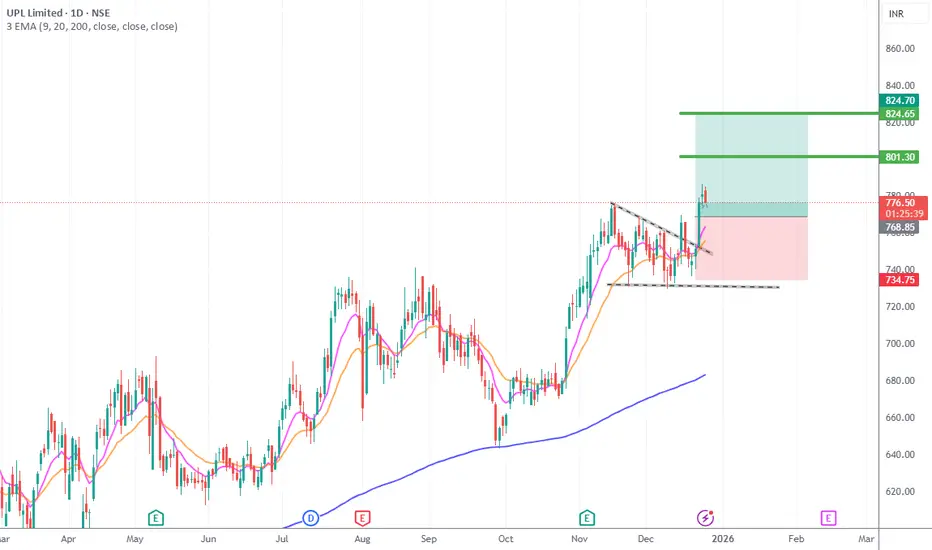
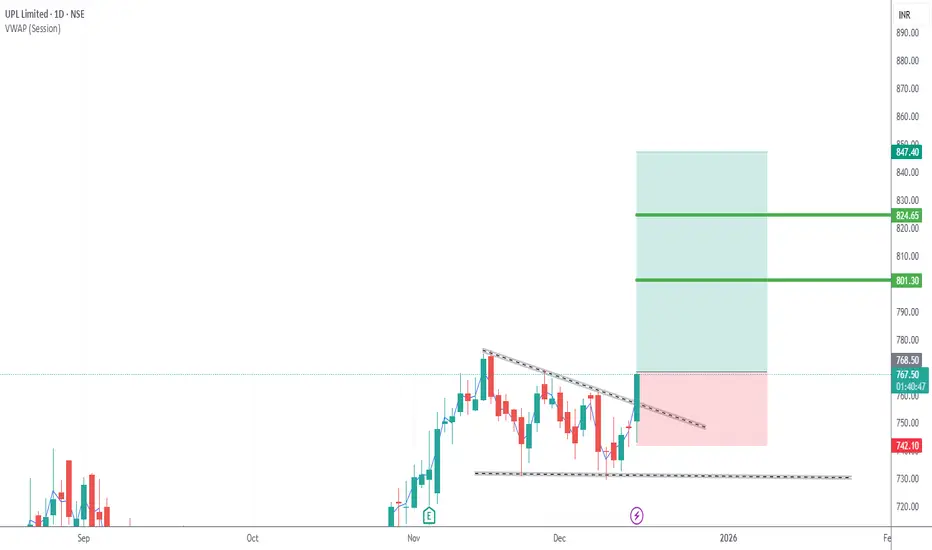
UPLUPL breaking the resistance
buy above 769.45
stop loss 741.5
target 1 : 799
target 2 : 825
target 3 : 851
exit 50 percent quantity on target 1 and 25 percent quantity on target 2 and 25 per on target 3
UPL – Ready for All-Time High? (Preemptive Breakout Setup)🌱 UPL – Ready for All-Time High? (Preemptive Breakout Setup)
UPL is showing signs of a rounding bottom breakout after almost 4 months of consolidation.
If this breakout sustains, the stock can head towards an all-time high (ATH) — last seen in June 2021.
Since this is a preemptive setup, follow s
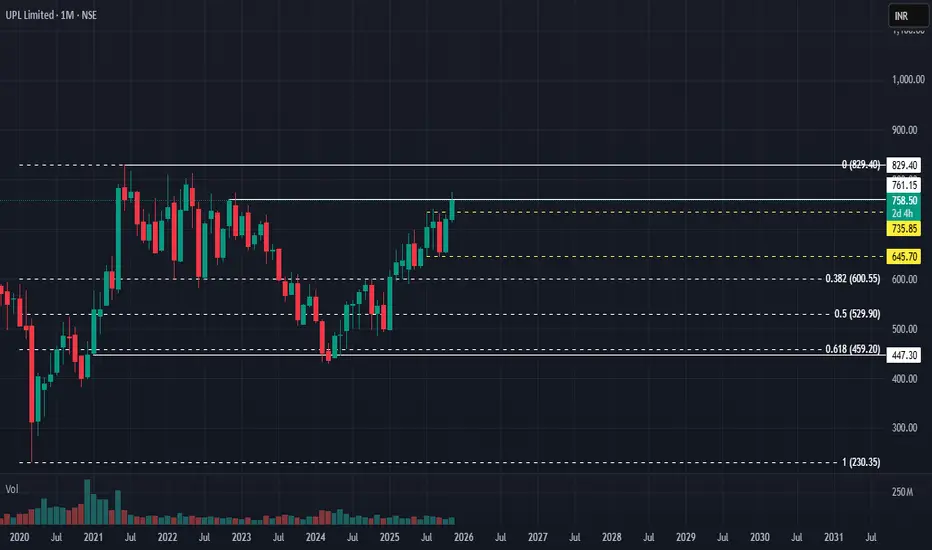
UPL – On Verge of Neckline Breakout After 4.5-Year ConsolidationUPL is showing a classic rounding bottom structure formed over the last 4.5 years, signaling a potential major trend reversal on the long-term chart. The price is now hovering near the neckline resistance, and a decisive breakout above this zone could ignite strong momentum ahead.
🔹 Technical Setup

UPL LIMITED – SELL SETUP (Equity + Futures)🔻 UPL LIMITED – SELL SETUP (Equity + Futures)
Entry Zone: ₹718 – ₹717
Action: SELL
Targets:
🎯 Target 1: ₹710
🎯 Target 2: ₹700
Stop Loss: ₹725 (Closing Basis)
Analysis Insight:
UPL is showing clear weakness near its resistance zone around ₹718–₹720 levels, with consistent selling pressure and low

UPL Ltd for 27th Oct #UPL UPL Ltd for 27th Oct #UPL
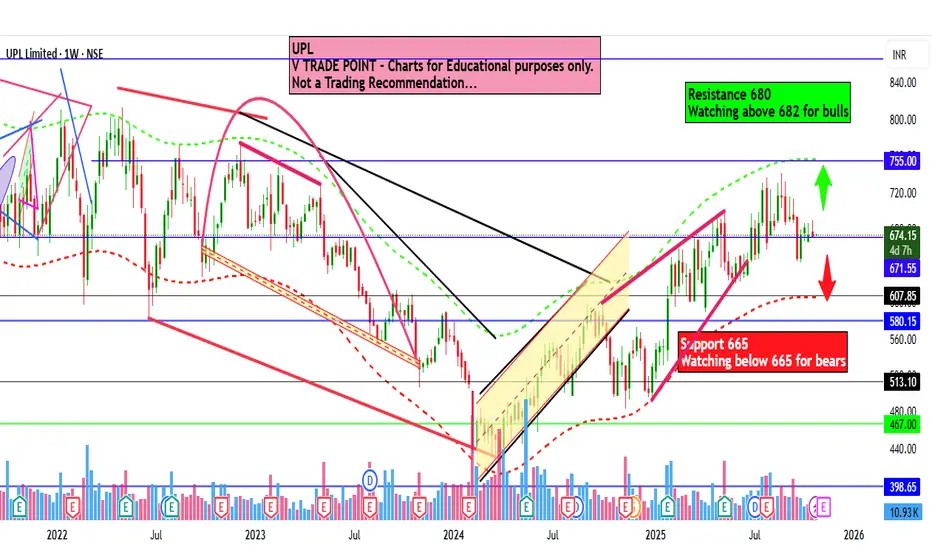
Resistance 680 Watching above 682 for upside momentum.
Support area 665 Below 675 gnoring upside momentum for intraday
Watching below 665 for downside movement...
Above 675 ignoring downside move for intraday
Charts for Educational purposes only.
Please follow strict st
UPL , 1W , Weekly Bullish As the UPL pattern is looking very Good and Giving Breakout and Enter only after the Close of Weekly time frame .
follow your risk Management , proper Position Sizing

UPL for short term target around 617.45UPL Is in downside journey and may be it will fall more for monday 27 may 25 it may touch 617, hope it will touch it , lets see what happens

Market Outlook and Entry Strategy for UPLBased on the daily chart structure, the current market trend is bullish, evidenced by a Break of Structure (BOS). The price has already retraced to the 70% Fibonacci level on the same timeframe, indicating a healthy pullback within the ongoing trend.
However, despite this bullish context, this is n

See all ideas
Summarizing what the indicators are suggesting.
Neutral
SellBuy
Strong sellStrong buy
Strong sellSellNeutralBuyStrong buy
Neutral
SellBuy
Strong sellStrong buy
Strong sellSellNeutralBuyStrong buy
Neutral
SellBuy
Strong sellStrong buy
Strong sellSellNeutralBuyStrong buy
An aggregate view of professional's ratings.
Neutral
SellBuy
Strong sellStrong buy
Strong sellSellNeutralBuyStrong buy
Neutral
SellBuy
Strong sellStrong buy
Strong sellSellNeutralBuyStrong buy
Neutral
SellBuy
Strong sellStrong buy
Strong sellSellNeutralBuyStrong buy
Displays a symbol's price movements over previous years to identify recurring trends.
UPLC5000773
UPL Corporation Limited 4.625% 16-JUN-2030Yield to maturity
5.70%
Maturity date
Jun 16, 2030
UPLC4611648
UPL Corporation Limited 4.5% 08-MAR-2028Yield to maturity
5.65%
Maturity date
Mar 8, 2028
78KL45
Kerala Enviro Infrastructure Ltd. 7.8% 02-NOV-2045Yield to maturity
—
Maturity date
Nov 2, 2045
See all UPL bonds
GUNR
FlexShares Morningstar Global Upstream Natural Resources Index FundWeight
0.54%
Market value
36.41 M
USD
EEDM
iShares IV PLC - iShares MSCI EM CTB Enhanced ESG UCITS ETF Unhedged USDWeight
0.18%
Market value
17.96 M
USD
EDM2
iShares IV PLC - iShares MSCI EM CTB Enhanced ESG UCITS ETF Accum Shs Unhedged USDWeight
0.18%
Market value
17.96 M
USD
Explore more ETFs
Frequently Asked Questions
The current price of UPL is 741.30 INR — it has decreased by −0.85% in the past 24 hours. Watch UPL Limited stock price performance more closely on the chart.
Depending on the exchange, the stock ticker may vary. For instance, on NSE exchange UPL Limited stocks are traded under the ticker UPL.
UPL stock has risen by 3.37% compared to the previous week, the month change is a −7.45% fall, over the last year UPL Limited has showed a 15.11% increase.
We've gathered analysts' opinions on UPL Limited future price: according to them, UPL price has a max estimate of 980.00 INR and a min estimate of 630.00 INR. Watch UPL chart and read a more detailed UPL Limited stock forecast: see what analysts think of UPL Limited and suggest that you do with its stocks.
UPL stock is 2.69% volatile and has beta coefficient of −0.17. Track UPL Limited stock price on the chart and check out the list of the most volatile stocks — is UPL Limited there?
Today UPL Limited has the market capitalization of 625.57 B, it has increased by 2.20% over the last week.
Yes, you can track UPL Limited financials in yearly and quarterly reports right on TradingView.
UPL Limited is going to release the next earnings report on May 11, 2026. Keep track of upcoming events with our Earnings Calendar.
UPL earnings for the last quarter are 5.40 INR per share, whereas the estimation was 6.46 INR resulting in a −16.41% surprise. The estimated earnings for the next quarter are 15.10 INR per share. See more details about UPL Limited earnings.
UPL Limited revenue for the last quarter amounts to 122.69 B INR, despite the estimated figure of 115.66 B INR. In the next quarter, revenue is expected to reach 169.79 B INR.
UPL net income for the last quarter is 3.96 B INR, while the quarter before that showed 5.53 B INR of net income which accounts for −28.39% change. Track more UPL Limited financial stats to get the full picture.
Yes, UPL dividends are paid annually. The last dividend per share was 6.00 INR. As of today, Dividend Yield (TTM)% is 0.81%. Tracking UPL Limited dividends might help you take more informed decisions.
As of Feb 7, 2026, the company has 12 K employees. See our rating of the largest employees — is UPL Limited on this list?
EBITDA measures a company's operating performance, its growth signifies an improvement in the efficiency of a company. UPL Limited EBITDA is 95.49 B INR, and current EBITDA margin is 17.17%. See more stats in UPL Limited financial statements.
Like other stocks, UPL shares are traded on stock exchanges, e.g. Nasdaq, Nyse, Euronext, and the easiest way to buy them is through an online stock broker. To do this, you need to open an account and follow a broker's procedures, then start trading. You can trade UPL Limited stock right from TradingView charts — choose your broker and connect to your account.
Investing in stocks requires a comprehensive research: you should carefully study all the available data, e.g. company's financials, related news, and its technical analysis. So UPL Limited technincal analysis shows the buy rating today, and its 1 week rating is buy. Since market conditions are prone to changes, it's worth looking a bit further into the future — according to the 1 month rating UPL Limited stock shows the buy signal. See more of UPL Limited technicals for a more comprehensive analysis.
If you're still not sure, try looking for inspiration in our curated watchlists.
If you're still not sure, try looking for inspiration in our curated watchlists.