$SPX SPX 1H - Downside ContinuationSP:SPX - Check Weekly and Daily charts as well
After the sharp bounce off the 9/16–11/7 demand zone, price is stalling under the 10/24–11/4 supply box (~6780–6800) and printing a lower high with a red rejection candle. Base case is continuation lower, with a grind from ~6750 toward 6720 support; if we get a 1H close below ~6710, expect a hunt of the prior spike low in the mid-6600s near the top of the 9/16–11/7 demand zone. Key trigger: a 1H close below ~6740 that is not reclaimed on the next bar confirms the 6720 test. Bias stays bearish while below ~6785.
Trade ideas

The S&P 500 is flirting with a close below the 50-day moving aveThe S&P 500 is flirting with a close below the 50-day moving average for the first time since April.
This level has acted as reliable support twice already, and so far the index is reacting in a similar way.
However, the RSI is showing a clear bearish divergence, suggesting momentum is weakening even as price pushed to new highs in October–November.
🔎 Key levels to watch:
• 50-day MA — primary support
• RSI structure — persistent lower highs
• Recent swing lows — potential breakdown trigger if the 50-day MA fails
Price is at an inflection point: either the 50-day holds again, or we finally get a deeper pullback after months of strength.

US500 Analysis: Tech Pullback & Rates UncertaintyThe US500 is undergoing a short-term correction driven by weakness in the Technology and AI sectors, coupled with renewed uncertainty about the Federal Reserve's rate path. While near-term momentum is bearish after a significant daily decline, the longer term uptrend remains intact, with defensive sectors showing relative resilience. The market is positioned for a consolidation phase pending clarity on monetary policy and tech earnings stability.
Fundamental Analysis
Key Driver: The dominant negative factor is the retreat in the Technology and AI-linked sectors, which previously drove the index to record highs. Disappointing earnings and profit-taking in stocks like Tesla (-4%) and Palantir (-4%) fueled the slide.
Macro Headwinds: Investor sentiment is pressured by two main macro themes:
Federal Reserve Policy: Expectations for a December rate cut are fading due to mixed economic signals, dampening risk appetite and increasing the appeal of safer assets like Treasury bonds (higher yields).
"AI Bubble" Fears: Market participants are becoming concerned that valuations in the AI/Tech space may be stretched, leading to a rotation out of high growth names and into defensive and value sectors.
Long-Term Context: Despite the recent 1.5% drop, the US500 is still up 1.6% over the last month and a significant 13.5% year-over-year, indicating that the foundational, broader market strength is holding up.
Technical Analysis
Price Action: The index is trading below 6,700, confirming a break below the immediate support level of 6,700. This follows the worst single day performance in over a month.
Short-Term Momentum: Bearish. Selling pressure is evident, particularly in the highly-weighted tech components.
Key Levels:
Immediate Resistance: 6,885. A move back above this zone is needed to alleviate immediate bearish pressure.
Key Support: 6,600 – 6,550. This area represents the critical defense line; a break below here could trigger broader, accelerated selling.
Sentiment Analysis
Current Mood: The prevailing sentiment is cautious to defensive.
Market Positioning: Traders are actively hedging for potential further downside, evidenced by options flows and fund positioning. This suggests investors acknowledge the risks but are not in a state of panic.
Outlook
The base case is for the US500 to enter a period of consolidation within the range of 6,550 to 6,800 into year end.
Upside Potential: Buying interest is expected to return on further pullbacks, especially if the upcoming economic data is strong enough to support corporate earnings and the Federal Reserve pivots back to a more dovish stance.
Key Risk: Continued uncertainty regarding the Fed's rate decision and further significant earnings disappointments from the Technology sector remain the primary threats to the consolidation thesis.
Outlook Interpretation: The current slide is largely viewed as a necessary valuation reset or healthy correction in the high flying tech sector, rather than the start of a full-blown market crash. Recovery potential is seen, but not without elevated volatility.
Analysis is by Terence Hove, Senior Financial Markets Strategist at Exness

SPX – Bounce or Break?The latest sell-off comes as higher yields and softening growth expectations weigh on risk. SPX is now testing the lower bound of the August channel and the anchored VWAP – a crucial confluence.
A reaction here sets the tone. A bounce could keep the structure intact, while a clean break opens the door to a broader correction and more cash waiting on the sidelines.
What’s your read?

Get ready for 7000Price has completed a clean 5-wave impulse followed by an ABC correction, now landing right on trendline support. If this C-wave holds, the setup hints at the beginning of a fresh bullish leg toward the 7000 psychological level. Watching for confirmation—momentum shift, higher lows, and volume pickup. Bulls might not be tired of winning just yet.
Remember to ignore the noise, follow technicals and you’ll always end up on the right side of the trade ! Good luck and wait for confirmation

S&P500 H1 | Bullish Bounce off Key SupportMomentum: Bullish
Price is currently within the bullish ichimoku cloud.
Buy entry: 6,817
- Strong overlap support
- 23.6% Fib retracement
- 127.2% Fib extension
Stop Loss: 6,774
- Swing low support
Take Profit: 6,874
- Swing high resistance
Stratos Markets Limited (tradu.com/uk ), Stratos Europe Ltd (tradu.com/eu ):
CFDs are complex instruments and come with a high risk of losing money rapidly due to leverage. 70% of retail investor accounts lose money when trading CFDs with this provider. You should consider whether you understand how CFDs work and whether you can afford to take the high risk of losing your money.
Stratos Global LLC (tradu.com/en ): Losses can exceed deposits.

SP500 Santa Claus rally - just backwardsIt is time to short the waaaaay needed correction on the stock market.

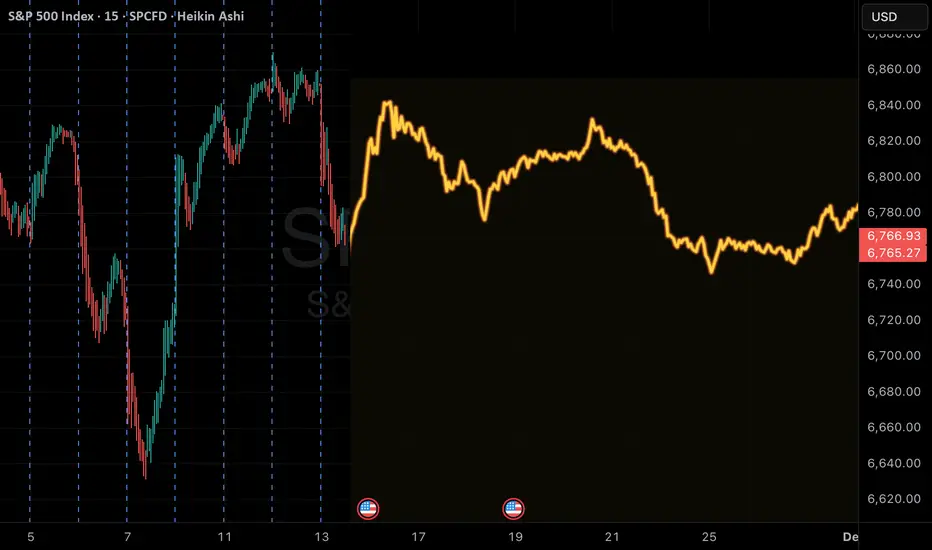
Shutdown Ends, Uncertainty Remains | SPX500 Holds Below 6866SPX500 | Overview
Trump Signs Bill to End Longest U.S. Government Shutdown
U.S. President Donald Trump signed a bill late at night in the Oval Office, officially ending the longest government shutdown in U.S. history, after a dinner with Jamie Dimon and top Wall Street executives.
While markets welcomed the resolution, the White House confirmed that some economic data gaps may be permanent, as October’s employment and CPI reports might never be released—a factor that could influence future Fed decision-making.
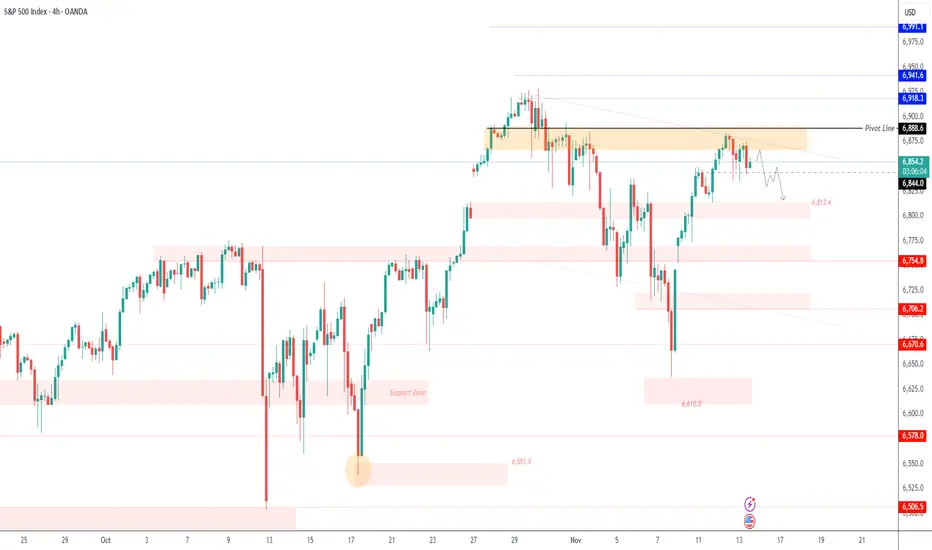
Technically:
The SPX500 has stabilized below the pivot zone at 6866, indicating continued bearish momentum with downside potential toward 6844 and 6813.
As long as the price trades below 6866, the bearish bias remains active.
However, a 1H close above 6888 would shift sentiment to bullish, targeting 6918 and a potential new all-time high (ATH) around 6940.
Pivot Line: 6866
Resistance: 6888 · 6918 · 6940
Support: 6844 · 6813 · 6768
SPX – Deep Correction or Opportunity for a Rebound?While the S&P 500 has seen impressive recoveries recently, current technical signals and macroeconomic factors indicate a high likelihood of a deep decline in the short term.
From a macroeconomic perspective , rising bond yields and excessive optimism about tech stocks have contributed to a strong correction in the SPX. Additionally, concerns about the Fed not continuing to cut interest rates have increased caution in the market.
From a technical analysis standpoint, SPX is currently facing strong resistance around 6,850. The chart shows that the index is trading near an upward trendline, but if it breaks the 6,600 support, SPX could continue to fall sharply to 6,550 in the medium term.
Conclusion: With both technical and macroeconomic factors supporting a bearish trend, the likelihood of SPX continuing a sharp correction in the next 24-48 hours is very high. If the price fails to hold the 6,600 support, a deeper decline is a likely scenario.
Recommendation: Monitor key support and resistance levels and consider opening a SELL position if the price confirms a break of these critical support zones.

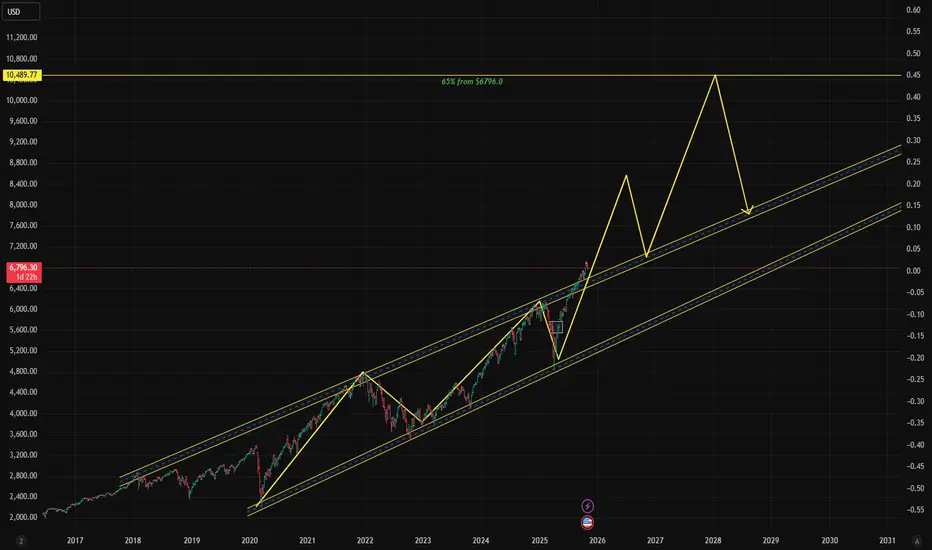
$SPX Hi, we are back with another one: SP:SPX !!!
As we can see we have SP:SPX sitting at $6796.30 with and expectation for a 65% pump.
That would bring us around $9-$10K per 1 SP:SPX .
Wouldn't that be incredible if we can see this by 2026 -2028 ?
What a time to be alive no ?
Don't forget to comment like and share for good luck :) !!!
SPX500 - 5000 & 5500 PUT, exp June 2026📉👍
SPX500 short with 5000 & 55000 PUT exp June 2026.
Take your pick...
AI hype & capital overcommitment
China beginning to catch up in GPU compute capability, pulling away capital from nvidia
Degrading consumer credit (BNPL, Auto loans, housing)
Increased govermant debt, geo-political decoupling
China rare earth mineral threats
Possible overturn on the Trumps tarrifs by the supreme court, requiring repatriations to be paid back to foreign countries

SPX QuantSignals V3 0DTE – High-Conviction PUT Alert SPX 0DTE Signal | 2025-11-13
Market Context:
SPX faces heavy selling pressure after a -1.22% intraday drop, with RSI at an extreme 8.1 (oversold zone). Despite Katy AI’s neutral 50% confidence, momentum and sentiment indicate short-term downside continuation.
AI Insight (QuantSignals V3):
Confidence: 72% (Medium)
Predicted Range: $6769 → $6667 (-1.5%)
Gamma Risk: Low
Flow Intel: Neutral
Signal Type: 0DTE PUT
Trade Setup:
🎯 Strike: 6770 PUT (Exp. 2025-11-13)
💵 Entry: $15.30
🎯 Target 1: $22.80 (+50%)
🎯 Target 2: $30.60 (+100%)
🛑 Stop Loss: $10.70 (-30%)
📏 Position Size: 2% (Low-Moderate Risk)
🕒 Exit By: 2:00 PM ET (Time Decay Risk)
Technical Summary:
EMA alignment: Bearish
RSI: 8.1 (Extreme Oversold)
MACD: -6.23 (Bearish)
Support: $6667.58 (Katy stop)
Resistance: $6869.91 (session high)
Key Notes:
⚠️ Katy’s model predicts upside, but real-time technicals override AI summary.
⚡ Momentum + sentiment confirm short-term PUT bias.
📉 Use tight stop & scale profits fast — 0DTE = fast decay.
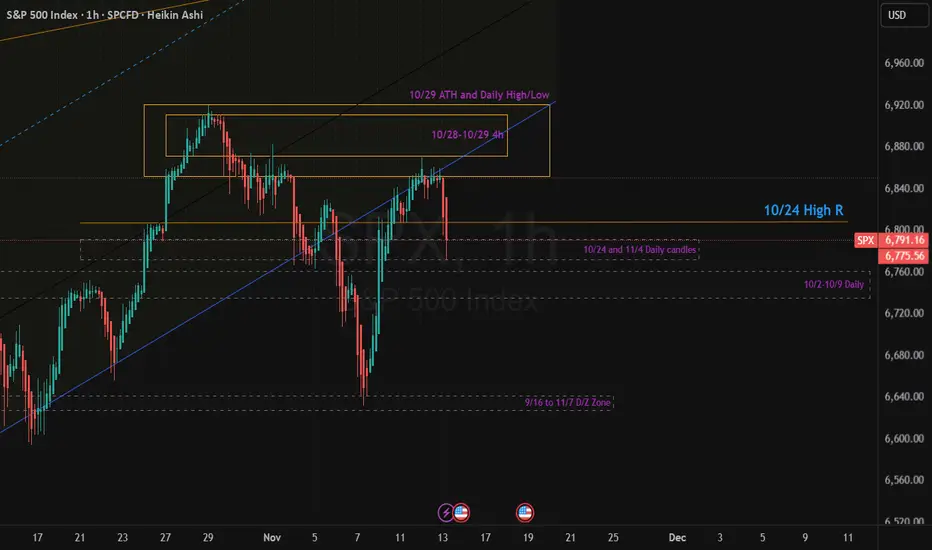
SPX 1H – Rejection at Parabolic Midline | 11/13 UpdateSPX rejected cleanly from the 10/28–10/29 supply zone and the parabolic midline (blue). The lower parabolic channel on 11/10 ( check the chart ) - this level that flipped from support to resistance after Nov 10.
Currently, price is testing the 10/24 High R zone (~6774) with strong downside momentum shown on Heikin Ashi
Key Levels:
Resistance: 6830–6870 (midline + prior rejection block)
Suport 1: 6780 (10/24 High R)
Support 2: 6720–6650 (10/2–10/9 & 9/16–11/7 demand zones)
Scenarios:
Bounce: If 6780 holds, expect a short-term relief rally toward 6830–6850 (mean reversion).
Breakdown: A 1H close below 6775 opens room for 6720 and possibly 6650.
Overall momentum remains bearish after rejection from the parabolic curve. Bulls must reclaim 6830+ to shift structure.
S&P500 (US500): Important Breakout & Bullish Continuation
US500 likely completely a correctional movement,
breaking a resistance line of a bullish flag pattern on a 4H time frame.
I think that a bullish wave is going to start soon
and the market will reach at least to 6917 level.
❤️Please, support my work with like, thank you!❤️
I am part of Trade Nation's Influencer program and receive a monthly fee for using their TradingView charts in my analysis.

SPX500 TIME TO BUY NOWSPX500 is in a clear upwards channel and has broken the last bit of resistance (white line shown) - this is a clear confirmation that the next target will be the next resistance zone to the upside shown above (this is a great buy trade opportunity) - Time to buy!

S&P 500 H1 | Bullish Bounce off Key SupportMomentum: Bullish
Price is currently above the ichimoku cloud.
Buy entry: 6,849.07
- Strong overlap support
- 50% Fib retracement
- 100% Fib projection
Stop Loss: 6,814.5
- Swing low support
Take Profit: 6,883.1
- Strong overlap resistance
Stratos Markets Limited (tradu.com/uk ), Stratos Europe Ltd (tradu.com/eu ):
CFDs are complex instruments and come with a high risk of losing money rapidly due to leverage. 70% of retail investor accounts lose money when trading CFDs with this provider. You should consider whether you understand how CFDs work and whether you can afford to take the high risk of losing your money.
Stratos Global LLC (tradu.com/en ): Losses can exceed deposits.

Bullish continuation in play?S&P500 (US500) has bounced off the pivot and could potentially rise to the 1st resistance.
Pivot: 6,827.13
1st Support: 6,745.48
1st Resistance: 7,006.51
Disclaimer:
The opinions given above constitute general market commentary and do not constitute the opinion or advice of IC Markets or any form of personal or investment advice.
Any opinions, news, research, analyses, prices, other information, or links to third-party sites contained on this website are provided on an "as-is" basis, are intended to be informative only, and are not advice, a recommendation, research, a record of our trading prices, an offer of, or solicitation for, a transaction in any financial instrument and thus should not be treated as such. The information provided does not involve any specific investment objectives, financial situation, or needs of any specific person who may receive it. Please be aware that past performance is not a reliable indicator of future performance and/or results. Past performance or forward-looking scenarios based upon the reasonable beliefs of the third-party provider are not a guarantee of future performance. Actual results may differ materially from those anticipated in forward-looking or past performance statements. IC Markets makes no representation or warranty and assumes no liability as to the accuracy or completeness of the information provided, nor any loss arising from any investment based on a recommendation, forecast, or any information supplied by any third party.

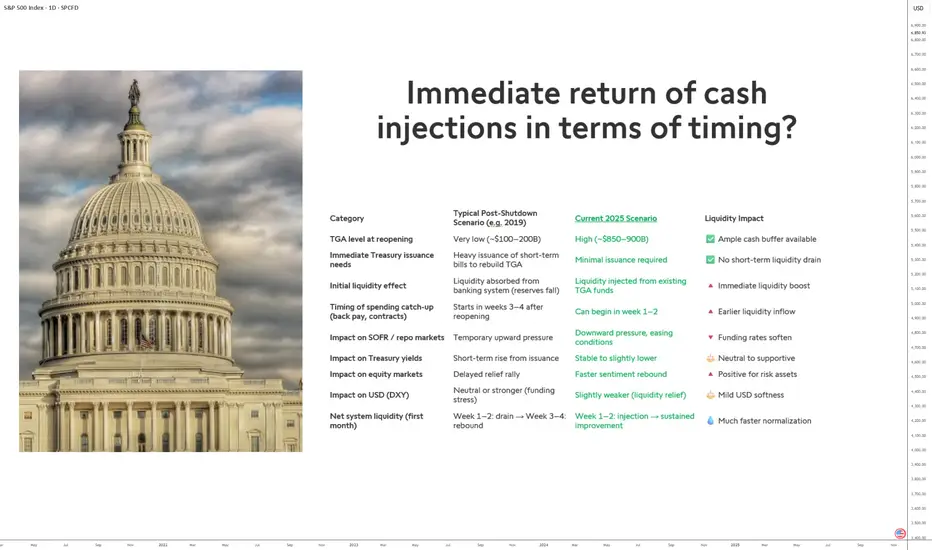
End of the 2025 Shutdown: Immediate Impact on LiquidityThe reopening of the U.S. government at the end of the 2025 shutdown is expected to trigger a swift return of liquidity to financial markets. This recurring phenomenon will have a distinct magnitude this time due to the specific conditions of the U.S. Treasury General Account (TGA) and the current federal funding structure.
1) A fiscal context unlike previous shutdowns
In past episodes, notably in 2019, the U.S. Treasury exited the shutdown with very low cash balances—typically between $100 and $200 billion. To rebuild this buffer, it had to issue large amounts of short-term Treasury bills, which drained liquidity from the banking system as investors used reserves to buy the securities.
In 2025, the situation is reversed. The Treasury holds a high cash balance—estimated between $850 and $900 billion—because the federal government’s account at the Fed (the TGA) was replenished at the end of September. This provides ample room to finance near-term public spending without issuing new debt. The result is an absence of pressure on money markets and stable bank reserves.
2) Liquidity injections from day one
With abundant cash reserves, the Treasury can promptly resume pending payments—federal salaries, public contracts, and suspended programs. These payments act as direct liquidity injections into the financial system, starting within the first weeks following the end of the shutdown.
In previous reopenings, this process began only after three to four weeks. In 2025, it could start as early as week one or two, significantly shortening the normalization timeline for market liquidity.
3) Moderate but positive market effects
This faster liquidity return should lead to:
• unchanged or slightly lower bond yields, given steady demand and the absence of additional issuance;
• a slightly weaker dollar, reflecting easier financing conditions.
Overall, this points to a quicker and more orderly normalization of the monetary system compared to 2019, potentially supporting risk assets in the short term.
DISCLAIMER:
This content is intended for individuals who are familiar with financial markets and instruments and is for information purposes only. The presented idea (including market commentary, market data and observations) is not a work product of any research department of Swissquote or its affiliates. This material is intended to highlight market action and does not constitute investment, legal or tax advice. If you are a retail investor or lack experience in trading complex financial products, it is advisable to seek professional advice from licensed advisor before making any financial decisions.
This content is not intended to manipulate the market or encourage any specific financial behavior.
Swissquote makes no representation or warranty as to the quality, completeness, accuracy, comprehensiveness or non-infringement of such content. The views expressed are those of the consultant and are provided for educational purposes only. Any information provided relating to a product or market should not be construed as recommending an investment strategy or transaction. Past performance is not a guarantee of future results.
Swissquote and its employees and representatives shall in no event be held liable for any damages or losses arising directly or indirectly from decisions made on the basis of this content.
The use of any third-party brands or trademarks is for information only and does not imply endorsement by Swissquote, or that the trademark owner has authorised Swissquote to promote its products or services.
Swissquote is the marketing brand for the activities of Swissquote Bank Ltd (Switzerland) regulated by FINMA, Swissquote Capital Markets Limited regulated by CySEC (Cyprus), Swissquote Bank Europe SA (Luxembourg) regulated by the CSSF, Swissquote Ltd (UK) regulated by the FCA, Swissquote Financial Services (Malta) Ltd regulated by the Malta Financial Services Authority, Swissquote MEA Ltd. (UAE) regulated by the Dubai Financial Services Authority, Swissquote Pte Ltd (Singapore) regulated by the Monetary Authority of Singapore, Swissquote Asia Limited (Hong Kong) licensed by the Hong Kong Securities and Futures Commission (SFC) and Swissquote South Africa (Pty) Ltd supervised by the FSCA.
Products and services of Swissquote are only intended for those permitted to receive them under local law.
All investments carry a degree of risk. The risk of loss in trading or holding financial instruments can be substantial. The value of financial instruments, including but not limited to stocks, bonds, cryptocurrencies, and other assets, can fluctuate both upwards and downwards. There is a significant risk of financial loss when buying, selling, holding, staking, or investing in these instruments. SQBE makes no recommendations regarding any specific investment, transaction, or the use of any particular investment strategy.
CFDs are complex instruments and come with a high risk of losing money rapidly due to leverage. The vast majority of retail client accounts suffer capital losses when trading in CFDs. You should consider whether you understand how CFDs work and whether you can afford to take the high risk of losing your money.
Digital Assets are unregulated in most countries and consumer protection rules may not apply. As highly volatile speculative investments, Digital Assets are not suitable for investors without a high-risk tolerance. Make sure you understand each Digital Asset before you trade.
Cryptocurrencies are not considered legal tender in some jurisdictions and are subject to regulatory uncertainties.
The use of Internet-based systems can involve high risks, including, but not limited to, fraud, cyber-attacks, network and communication failures, as well as identity theft and phishing attacks related to crypto-assets.
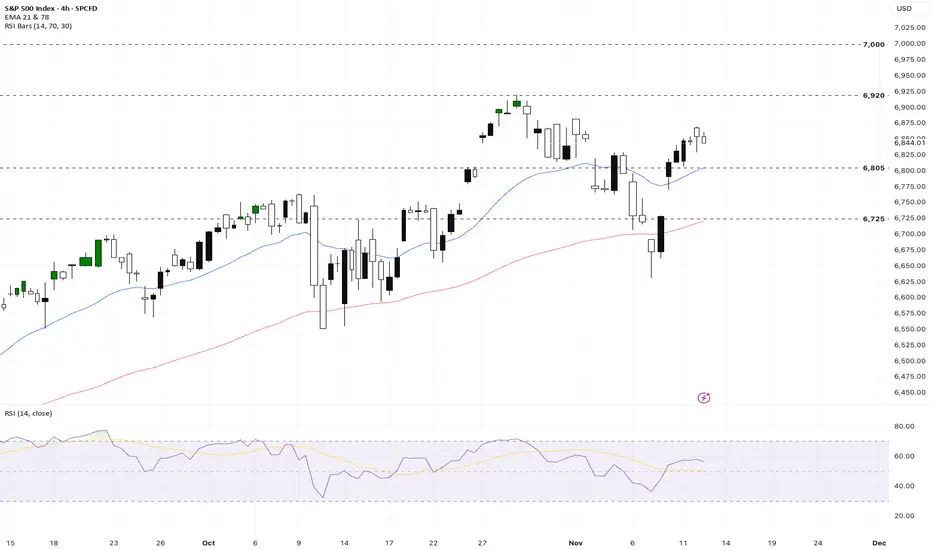
US500 Recovery on Imminent US Government Shutdown DealFundamental Analysis
The US500 is driven by strong Q3 earnings and a recovery in risk sentiment due to the imminent resolution of the US government shutdown. Market odds for a December Fed rate cut are high, boosting equity valuations. However, index gains are uneven, highly concentrated in the "Magnificent 7" tech mega-caps.
Technical Analysis
The index is in a well-defined upward channel, with dynamic support at the EMA 21. The RSI is bullish but nearing overbought territory, though all major moving averages signal a "buy." Short-term volatility (VIX) is low, supporting a continued grind higher. Key levels are 6,805 Support and 6,920 Resistance.
Sentiment Analysis
Optimism prevails following the drop in the VIX, indicating subsiding turbulence. Funds are positioning for a low-volatility climb. However, caution exists regarding high valuations in tech and signs of rotation into defensive sectors. Commentators view recent dips as routine corrections.
Outlook
The year-end target remains near 7,000, contingent on sustained macroeconomic stability and continued Fed dovishness. Pullbacks are expected to be buying opportunities given solid corporate profitability and continued AI enthusiasm. The core uptrend remains intact barring major policy or geopolitical surprises.
Analysis by Terence Hove, Senior Financial Market Strategist at Exness
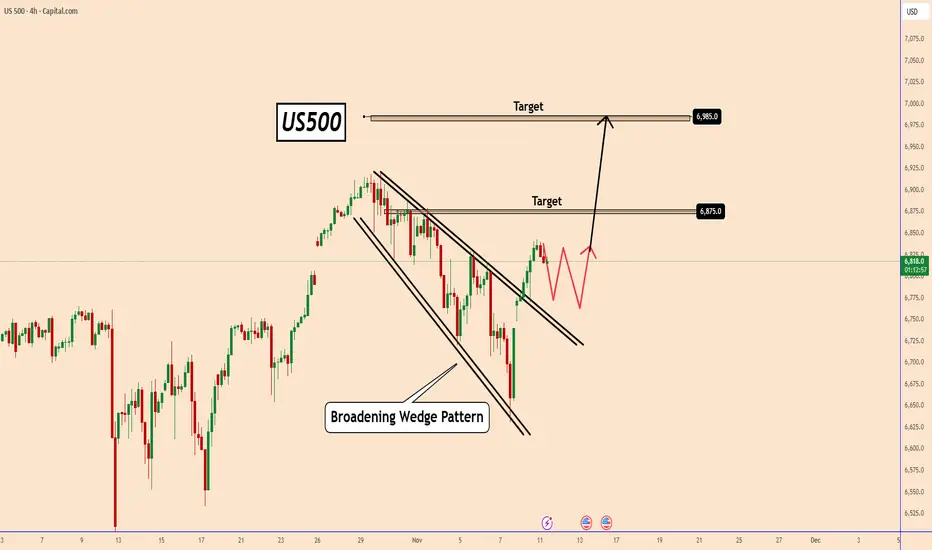
US500: Breaking Out of the Falling ChannelUS500: Breaking Out of the Falling Channel
The US500 index has finally broken out from its falling channel, signaling a potential continuation of the broader bullish trend.
After a strong recovery from recent lows, price action suggests a possible pullback to retest the breakout zone before targeting higher levels.
If momentum continues, we could see buyers pushing the index toward the 6,875 resistance zone first — and if that level gives way, the next target sits around 6,985.
Key levels to watch:
🎯Target 1: 6,875
🎯Target 2: 6,985
You may find more details in the chart!
Thank you and Good Luck!
❤️PS: Please support with a like or comment if you find this analysis useful for your trading day❤️
SPX500 Bullish Plan in Motion with SMA + Kijun Confirmation🚀 US500/SPX500 INDEX MARKET SWING TRADE MASTERCLASS 🎯
📊 ASSET: S&P 500 Index (US500 | SPX500)
Timeframe: 4H-Daily | Strategy Type: Swing Trade | Market Context: Bullish Pullback Confirmation
🎲 TRADE SETUP: THE "THIEF PROTOCOL" STRATEGY ⚡
✅ TECHNICAL CONFIRMATION
🔹 Primary Signal: Simple Moving Average (SMA) Pullback Retest
🔹 Secondary Confirmation: Kijun-sen (Ichimoku MA) Retest
🔹 Market Structure: Higher Lows Formation + Bullish Consolidation
🔹 Bias: LONG with Layered Entry Methodology
💰 ENTRY STRATEGY: MULTI-LAYER LIMIT ORDER APPROACH
The "Thief Layering Method" - Stack multiple buy limit orders for optimal risk distribution:
🟢 Layer 1 Entry: $6,750.00 - Initial Probe Entry (30% Position Allocation)
🟢 Layer 2 Entry: $6,800.00 - Aggressive Add (35% Position Allocation)
🟢 Layer 3 Entry: $6,850.00 - Final Confirmation Entry (35% Position Allocation)
Entry Flexibility: Adjust layers based on your account size & risk tolerance. Spread entries across pullback zones for superior fill pricing.
🛑 STOP LOSS MANAGEMENT
Recommended SL Level: $6,720.00 - Placed below the support trendline + SMA confluence
⚠️ IMPORTANT DISCLAIMER: Dear Traders! This is YOUR trading journey. We strongly recommend adjusting stop loss based on YOUR risk management rules. Account sizing is crucial - never risk more than 2-3% per trade. Your SL placement = YOUR decision, YOUR responsibility. Use proper position sizing ALWAYS.
🎯 PROFIT TARGET ZONES
Primary Target: $7,050.00 ⚡
📊 Technical Reasoning: This level represents strong resistance confluence zone, historical supply level in overbought territory, and creates a risk/reward sweet spot of 1:3+ return potential. Alert: Trap zone exists here - smart money reversal area confirmed.
Exit Strategy Recommendation: Close 50% of position at $7,000-7,020 to lock partial profits. Hold remaining 50% with trailing stop or until $7,050 for maximum upside capture. Lock profits incrementally to secure gains.
⚠️ CRITICAL REMINDER: Your profit target = YOUR choice! This TP represents technical confluence, but market conditions evolve. Trade YOUR plan, manage YOUR risk, protect YOUR capital.
🌍 CORRELATED PAIRS TO WATCH 🔗
📈 PRIMARY CORRELATIONS
1️⃣ QQQ (Nasdaq-100 ETF) - 0.99 Correlation 💻
This is the tech-heavy composition that typically leads SPX rallies. Current focus remains on AI/Mag7 momentum and overall growth stock sentiment. Key watch: QQQ strength = SPX bullish confirmation signal. When QQQ breaks out, SPX follows closely.
2️⃣ IWM (Russell 2000 ETF) - 0.95 Correlation 📍
Small-cap composition with high tariff sensitivity. Current status shows small-cap underperformance zones vulnerable to trade policy shifts. Trading tip: IWM weakness = Sector rotation risk, so watch for divergence from SPX strength.
3️⃣ DXY (US Dollar Index) - Inverse/Mixed Correlation 💵
Recent positive correlation emerging in 2025 market dynamics. Current dynamic shows dollar strength now sometimes supports equities due to policy-driven factors. Risk factor alert: DXY spike above 108 = potential SPX headwind to monitor.
📊 SECONDARY WATCH PAIRS
SPY (S&P 500 ETF) - Mirror of SPX, use for volume confirmation and institutional positioning.
DIA (Dow Jones ETF) - Large-cap value barometer, less tech-sensitive than QQQ, shows rotation signals.
VIX (Volatility Index) - Above 25 = caution mode, below 15 = complacency warning.
📱 KEY CORRELATION INSIGHTS FOR THIS TRADE
🔴 RED FLAGS - Watch These Closely:
VIX spiking above 30 signals potential fear spike. DXY breaking above 108 creates dollar strength pressure. QQQ failing to confirm breakout indicates tech weakness divergence. IWM hitting new lows signals broad market weakness.
🟢 GREEN LIGHTS - Trade Confirmation:
QQQ and SPX moving in sync above SMA is bullish. IWM holding key support levels confirms breadth. DXY consolidating means no headwind pressure building. VIX below 20 indicates low fear environment.
🎯 TRADE PSYCHOLOGY & EXECUTION TIPS
✅ Pre-Trade Checklist:
Confirm SMA pullback on 4H chart before entry. Verify Kijun retest on Ichimoku indicator. Check QQQ alignment for correlation confirmation. Monitor DXY to avoid strong dollar days. Set alerts at all 3 entry layers for execution readiness.
✅ During Trade Management:
Take partial profit at 50% move up to secure gains. Move SL to breakeven after hitting first target. Trail stop every 50-pip move in your favor. Document your execution for journal review and performance tracking.
🔥 TRADE EXECUTION SUMMARY
Signal Type: Bullish Pullback Retest ✅ Confirmed
Entry Method: 3-Layer Limit Orders 🎯 Optimized for Best Fill Pricing
SL Level: $6,720.00 🛑 Defined and Placed Below Support
TP Level: $7,050.00 🎯 Defined at Resistance Confluence
Risk/Reward Ratio: 1:3+ 💰 Favorable Trade Structure
Best Tradeable Window: Next 48-72 Hours ⏰ Active Setup Zone
Good Luck, Traders! 🚀 Trade Smart. Trade Safe. Trade Often.
Remember: Your SL = Your Protection | Your TP = Your Goal | Your Risk = Your Responsibility
#SPX500 #SwingTrade #TechnicalAnalysis #TradingIdea #S&P500 #MarketAnalysis #TradeSetup #RiskManagement

S&P500 H1 | Bullish Bounce off Key SupportMomentum: Bullish
Price is currently above the ichimoku cloud.
Buy entry: 6,811.61
- Pullback support
- 50% Fib retracement
- 100% Fib projection
Stop Loss: 6,773.85
- Swing low support
Take Profit: 6,848.7
- Overlap resistance
Stratos Markets Limited (tradu.com/uk ):
CFDs are complex instruments and come with a high risk of losing money rapidly due to leverage. 68% of retail investor accounts lose money when trading CFDs with this provider. You should consider whether you understand how CFDs work and whether you can afford to take the high risk of losing your money.
Stratos Europe Ltd (tradu.com/eu ):
CFDs are complex instruments and come with a high risk of losing money rapidly due to leverage. 70% of retail investor accounts lose money when trading CFDs with this provider. You should consider whether you understand how CFDs work and whether you can afford to take the high risk of losing your money.

SPX since 1877 & 1896 & 1932-2021 & beyond. Waddup MM !!! 9 Years & 18 months. I choose the first largest three crashes as a base for cycles nothing more nothing less.
WADDUP MARKET MAKERS, CAN YOU SHARE THE PROBABILITIES OF YOUR ALGOS ;-) .
Blue adjusted for time = Action in June. Red and green = Action in July . It is like a
puzzle. Waddup MMs share the knowledge.
