SPX since 1877 & 1896 & 1932-2021 & beyond. Waddup MM !!! 9 Years & 18 months. I choose the first largest three crashes as a base for cycles nothing more nothing less.
WADDUP MARKET MAKERS, CAN YOU SHARE THE PROBABILITIES OF YOUR ALGOS ;-) .
Blue adjusted for time = Action in June. Red and green = Action in July . It is like a
puzzle. Waddup MMs share the knowledge.
Trade ideas

Congress Set to End Shutdown | SPX500 Holds Strong Above 6877SPX500 | Overview
U.S. Congress Poised to Get Back to Work
The U.S. government is on the verge of reopening, potentially restoring pay to federal workers and reviving key economic data releases that have been halted for weeks — leaving the Federal Reserve operating with limited visibility.
Renewed optimism over a resolution in Washington has boosted investor sentiment, supporting further upside in U.S. equities.
Technically:
The SPX500 has pushed higher and is now stabilized above the pivot level at 6877, indicating continuation of the bullish trend toward 6918 and 6941, with potential to reach new all-time highs (ATH) if momentum persists.
However, if the price closes a 1H candle below 6866, it would signal short-term weakness, leading to a bearish correction toward 6844 and 6814.
Pivot Line: 6877
Resistance: 6918 · 6941 · 6991
Support: 6845 · 6814 · 6797

Important Breakout - US500Hello traders,
The US500 failed to create a new lower low, and the price broke the lower high — confirming a change of character (ChoCH)!
So, I expect a bullish move ahead 🚀
🎯 Target: 6890.0

SPX – Recovery Momentum Gradually ReturningThe U.S. stock market is regaining its upward rhythm after a period of correction, as investor sentiment improves notably on hopes that the U.S. government shutdown will soon end .
At the same time, the U.S. Dollar Index has stalled and bond yields have slightly declined , creating favorable conditions for capital to return to large-cap equities.
On the 4H chart, SPX maintains a steady ascending channel structure , and the sharp rebound from the 6,800 zone signals that buyers are regaining control.
The current setup suggests the index could continue rising toward the 7,000 level, before a minor technical pullback — a healthy move to build momentum for the next leg higher toward the upper boundary of the channel.
With market sentiment turning increasingly positive , supported by bullish forecasts from major institutions like UBS (targeting S&P 500 at 7,500 by 2026), the short-term bullish bias for SPX remains intact.
As long as 6,800 holds firm, the uptrend structure stays valid, reflecting growing confidence that the U.S. market recovery cycle is far from over.

$SPX: DIP BUYNG IS THE RULE FOR NOW The strategy of buying on dips has proven effective once again, underscoring the current strength of the market. The 10- and 20-day moving averages are no longer relevant as support or resistance levels; instead, their slopes indicate the short-term trend. We will focus on the 20-day simple moving average (SMA), which remains in a positive slope. The key moving average for maintaining the upward trend is the 50-day SMA. The S&P 500 has easily recovered above the 0.618 Fibonacci retracement level and is just 73 points away from its all-time high; it appears quite feasible to set a new record.
However, there is a slight concern regarding the technology sector, which seems to be carrying more weight in the market. If the end of the shutdown is indeed approaching, the uncertainty will likely conclude with the release of economic data. Therefore, given this display of market strength, a wait-and-see approach may develop, which could lead to sideways trading—a situation that could be quite frustrating.


SPX What's it Gonna Be? Pop or Drop?Fellow SPX traders, followers and gamblers!
Do we have a bullish flag on the 30min or will it fake break the other way?
Pop or Drop be ready either way!

S&P500 New Bullish Leg confirmed targeting 7150.The S&P500 index (SPX) offered us, as we mentioned on our last analysis, an excellent buy opportunity last Friday as it hit its 1D MA50 (blue trend-line) and bounced.
Having broken and closed yesterday above its 4H MA50 (red trend-line), it has technically confirmed the new Bullish Leg of the 6-month Channel Up. Based on all previous ones, it should target the 2.5 Fibonacci extension at 7150, which remains our long-term Target for the end of the year.
Notice also how similar the 1D RSI patterns are of October and August. Steady rise is expected for November getting into December.
---
** Please LIKE 👍, FOLLOW ✅, SHARE 🙌 and COMMENT ✍ if you enjoy this idea! Also share your ideas and charts in the comments section below! This is best way to keep it relevant, support us, keep the content here free and allow the idea to reach as many people as possible. **
---
💸💸💸💸💸💸
👇 👇 👇 👇 👇 👇

Watch out—the current rebound could be a bull trap.Watch out—the current rebound could be a bull trap.
Technical analysis
1. US500 rebounded from the EMA50, with the price forming higher swings, and the multi-period EMAs signal an uptrend.
2. However, price has formed Bearish Divergence with RSI twice already (rarely does it occur more than three times), so this rebound may not be sustainable.
3. In terms of Elliott Wave, this rally might be the final sub-wave before a major correction—potentially an Ending Diagonal, which tends to be a ZigZag structure and often finishes with a throw-over before reversing.
4. If the index holds above 6770 and can make a new high, the upside may be limited, with resistance at the ascending trendline around 7000—near the 161.8% Fibonacci retracement—before a significant pullback begins.
5. Alternatively, if US500 fails to make a new high, it may correct toward 6510 as the first support.
Fundamental Analysis
6. S&P 500 valuations look extended, trading around 28–30x P/E versus a 17–25x long-run average range, while P/S near ~3.3–3.4x sits close to record highs—both materially above historical norms.
7. Inflation remains above target as core CPI is ~3% and sticky, leading to expectations that the Fed may not cut interest rates that much, which might not support risk assets as initially anticipated.
8. Berkshire Hathaway's record cash holdings reflect Warren Buffett's increased caution. He views the current market as expensive or uncertain, thus pausing major investments. This stance aligns with the Buffett Indicator surging to 217%-223%, a level he previously warned was "playing with fire," implying the market is significantly overvalued relative to the economy.
Analysis by: Krisada Yoonaisil, Financial Markets Strategist at Exness

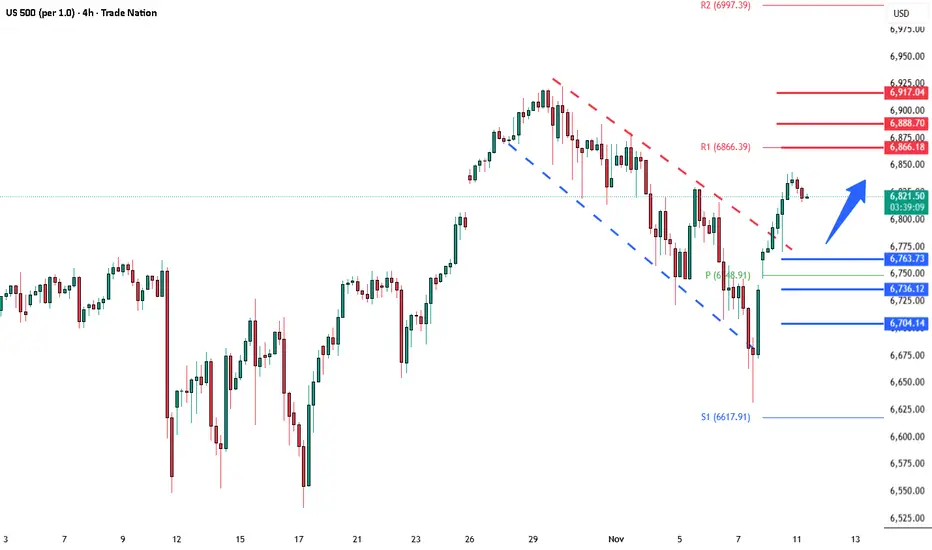
S&P500 Positive sentiment from tech reboundOverview:
Wall Street rallied strongly yesterday, led by tech stocks. The NASDAQ gained +2.27%, and the Magnificent 7 surged +2.79%, with Nvidia (+5.79%) leading after its biggest jump since April. Broader gains were more moderate — the equal-weight S&P 500 rose +0.52%, and Russell 2000 +0.94% — showing the rally was concentrated in large-cap tech.
Drivers of Sentiment:
Tech rebound: Nvidia’s recovery and strong performance in other mega-caps fueled optimism.
Trade optimism: Trump said the US is “pretty close” to trade deals with India and Switzerland, potentially reducing tariffs.
Political progress: The US government funding deal advanced in the Senate, easing shutdown concerns.
Market Takeaway for Today:
S&P 500 likely to open steady to slightly higher, supported by risk-on momentum from tech.
Focus on whether the rally broadens beyond mega-caps — equal-weight S&P lagging suggests narrow leadership.
Short-term tone: Positive sentiment from tech rebound, trade deal hopes, and easing US political risk, but watch for consolidation after strong gains.
Key Support and Resistance Levels
Resistance Level 1: 6866
Resistance Level 2: 6889
Resistance Level 3: 6917
Support Level 1: 6763
Support Level 2: 6736
Support Level 3: 6700
This communication is for informational purposes only and should not be viewed as any form of recommendation as to a particular course of action or as investment advice. It is not intended as an offer or solicitation for the purchase or sale of any financial instrument or as an official confirmation of any transaction. Opinions, estimates and assumptions expressed herein are made as of the date of this communication and are subject to change without notice. This communication has been prepared based upon information, including market prices, data and other information, believed to be reliable; however, Trade Nation does not warrant its completeness or accuracy. All market prices and market data contained in or attached to this communication are indicative and subject to change without notice.
SPX wedge breakout: Reopen relief, 6780 tetest, 7k in SightS&P500 breaks out of a broadening wedge and retests 6780 support as government reopening odds fuel a relief bid.
Senate progress towards ending the record shutdown has lifted the overhang on data releases and growth, triggering a risk-on bounce across US indices. Price action confirmed a breakout with a clean throwback to 6780, aided by hidden bullish divergence on momentum before the surge to 6850.
Key drivers:
Government reopening: bipartisan Senate advance and White House support shift odds towards a near‑term resolution.
Technical confirmation: breakout from falling/broadening wedge, successful retest and RSI reset from overbought at 6850 towards midline supports continuation higher if 50 line holds.
Levels in play: support 6800–6775 and 6750; resistance 6850–6890 then 6930 with psychological 7000 on extension if momentum rebuilds.
Risk: reopening unleashes delayed macro data. A miss or policy hiccup could pull the price back toward the 50% area before the trend resumes and ahead of Nvidia earnings next week.
Bias stays long while above 6775: buy dips to 6750 with invalidation below 6725; If 6690 fails on a daily close, step aside and reassess.

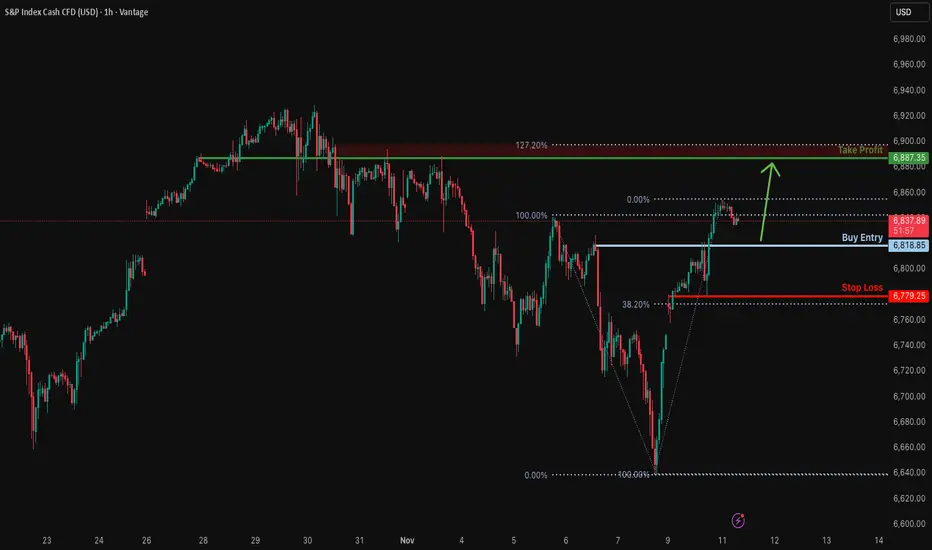
Bullish continuation setup?S&P500 is falling towards the support level, which is a pullback support and could bounce from this level to our take profit.
Entry: 6,618.85
Why we like it:
There is a pullback support level.
Stop loss: 6,779.25
Why we like it:
There is a pullback support that lines up with the 38.2% Fibonacci retracement.
Take profit: 6,887.35
Why we like it:
There is an overlap resistance that is slightly below the 127.2% Fibonacci extension.
Enjoying your TradingView experience? Review us!
Please be advised that the information presented on TradingView is provided to Vantage (‘Vantage Global Limited’, ‘we’) by a third-party provider (‘Everest Fortune Group’). Please be reminded that you are solely responsible for the trading decisions on your account. There is a very high degree of risk involved in trading. Any information and/or content is intended entirely for research, educational and informational purposes only and does not constitute investment or consultation advice or investment strategy. The information is not tailored to the investment needs of any specific person and therefore does not involve a consideration of any of the investment objectives, financial situation or needs of any viewer that may receive it. Kindly also note that past performance is not a reliable indicator of future results. Actual results may differ materially from those anticipated in forward-looking or past performance statements. We assume no liability as to the accuracy or completeness of any of the information and/or content provided herein and the Company cannot be held responsible for any omission, mistake nor for any loss or damage including without limitation to any loss of profit which may arise from reliance on any information supplied by Everest Fortune Group.
Hellena | SPX500 (4H): LONG to max of wave "3" area of 6929.4.Good afternoon colleagues, it looks like the correction is ending and soon I expect wave “5” in the upward movement. Perhaps wave “4” will update the low of 6637.8 before the upward movement.
I expect to reach the maximum of wave “3” at 6929.4. Further we will observe the price behavior in this area.
Fundamental Background
The US stock market remains positive: business activity data showed a steady expansion, which strengthens confidence in corporate earnings.
Manage your capital correctly and competently! Only enter trades based on reliable patterns!

S&P 500 (SPX) Eyes Fresh All-Time High in Wave (5)The ongoing cycle in the S&P 500 Index (SPX), originating from the April 2025 low, continues to unfold as an impulsive structure. The advance to 6920.21 marked the completion of wave (3) within this impulse, as illustrated in the accompanying one-hour chart. Subsequently, the market entered a corrective phase in wave (4), which developed as a double three Elliott Wave pattern.
From the termination of wave (3), wave ((a)) declined to 6814.26, followed by a recovery in wave ((b)) to 6882.32. The Index then resumed its descent in wave ((c)), reaching 6763.11 and thereby completing wave W of a higher degree. A corrective rally in wave X ensued, peaking at 6829.78. Thereafter, the Index turned lower again, initiating wave Y as a lower-degree zigzag.
Within wave Y, wave ((a)) bottomed at 6707.51 and wave ((b)) rebounded to 6757.63. Wave ((c)) extended downward to 6630.72, finalizing wave Y of (4). The Index has since begun to rise in wave (5). However, a decisive break above the wave (3) high at 6920.21 remains necessary to invalidate the possibility of a double correction. From the wave (4) low, wave ((i)) is nearing completion. A pullback in wave ((ii)) is anticipated to correct the cycle from the November 8, 2025 low, likely unfolding in a 3, 7, or 11 swing sequence. In the near term, provided the pivot at 6630.72 remains intact, any pullback should find support within the expected swing structure, paving the way for further upside continuation.

A pullback may tell us moreAny pullback and then higher high likely means we are going to the upper BB again. A pullback that gets under today's low and 18ma would be very bearish. So we have to wait for a pullback. Gold may also pullback soon, and probably follows the general market. BTC still at resistance but could hit 107,500. Oil still consolidating.
The pullback will tell us more if and when it comes.

$SPX 1H – Testing Lower Boundary of Parabolic Channel $SP:SPXSP:SPX has pulled back to the lower blue curve, the parabolic channel support that has guided price for months.
Check daily and weekly charts as well.
We’re now at a critical inflection zone — buyers and sellers are battling for control. @SPX
Bounce Scenario: A successful defense here could trigger a short-term relief rally back toward the midline (dotted blue) — a classic mean-reversion move within the channel.
Breakdown Scenario: A decisive close below this curve on strong 4H or 1D momentum would signal a channel breakdown, potentially driving price toward the 6700–6650 demand zone.
This area will define whether the uptrend structure of the parabolic channel remains intact or transitions into a corrective phase.


USA S&P 500 IndexPrice has completed a clean sweep of sell-side liquidity and is now showing strong displacement toward the upside. The recent break in structure confirms short-term bullish intent.
If price returns to the fair value gap or discount zone, I’ll look for confirmation to enter in alignment with the intraday bullish flow.
My first target remains the internal liquidity zone, and the potential extended target is the previous day’s high where buy-side liquidity rests.

S&P 500: Q3 Earnings Surge Amid Rising RisksResilient Earnings Growth in a Challenging Environment
Honestly, even with all the warning signs flashing red, the S&P 500 just pulled off something impressive. Companies in the index posted 10.7% annual earnings growth in Q3 2025 - and that’s no small feat. It’s a real testament to how resilient U.S. businesses are right now, no matter what.
Four Quarters of Double-Digit Gains: A Rare Streak
That said, staying long in this market is getting trickier. The stakes are rising. Valuations are stretched, policy signals are mixed, and while earnings are strong, the margin for error is shrinking. It’s one of those moments where you have to respect the strength - but also stay sharp.
What stands out is this: we’ve now seen four straight quarters of double-digit earnings growth in the S&P 500 - something we haven’t seen since the post-COVID surge in 2021. Companies are still delivering, even amid inflation and high rates. In Q3 2025, 83% of firms beat EPS estimates , well above the 5- and 10-year averages. But the average surprise was just 5.3%, down from historical norms. Wins are frequent, but margins are narrowing.
Sector Heavyweights Drive the Rally-But at What Cost?
The bulk of the upside came from Financials, Tech, and Consumer Discretionary. JPMorgan NYSE:JPM , Apple NASDAQ:AAPL , Microsoft NASDAQ:MSFT - the usual suspects - carried the weight. The Magnificent 7 are doing all the heavy lifting, which makes the market more fragile. If one stumbles, the whole index gets affected. It doesn’t feel comfy to me.
Stretched Valuations Signal Vulnerability
We must honestly admit that valuations are stretched. The S&P’s forward P/E is 22.9 - considerably above the 5-year average of 19.9. We’re clearly pricing in even stronger earnings ahead, but here’s what really worries me: if growth falters, this market could snap back hard. Instead of a smooth landing, we might get a sharp correction. There’s just too much optimism already baked into valuations.
Beyond Earnings: Labor Market Cracks and Data Blackouts
What’s even more concerning is what’s happening off the earnings sheet. The prolonged government shutdown is disrupting key macro data releases, leaving investors flying blind. For most of 2025, the labor market was in a “no hire, no fire” phase. But that’s changing. Amazon NASDAQ:AMZN just cut 14,000 jobs . UPS’s headcount is down 48,000 year-over-year. Target, Paramount - all trimming staff. These no longer look like isolated moves, and they need more unbiased scrutiny and sober projections.

SPX | Daily Analysis #12 - 10 November 2025Hello and Welcome Back to DP,
Review and News:
Last week was quite eventful. The index plunged toward the 6,640 area before a sharp rebound—helped in part by a series of market-friendly statements and tweets from former President Trump, which appeared to lift sentiment. Despite trading down more than 1.3% intraday, the market recovered impressively and ultimately closed the session in the green.
This week, investors will be watching closely to see whether Trump continues to influence sentiment with further comments or appearances that could help fuel market volatility and optimism. The shutdown remains at the center of U.S. politics. The Senate has advanced a temporary funding bill extending federal funding through January and reversing some layoffs, but final approval by the House and the President’s signature is still pending. Until a resolution is reached, uncertainty will linger across markets and public services.
The October Consumer Price Index (CPI) report—typically one of the most closely watched inflation indicators—is likely to be delayed due to the ongoing federal government shutdown. The lack of fresh data is creating a “data fog” for policymakers and traders alike.
Technical Analysis:
🟩 Demand Zones (Support Areas)
6,735 – 6,748 region
Multiple touches and strong buying reaction.
Large bullish candles emerged after price retested this area → indicates strong institutional demand.
It’s the nearest demand and acts as immediate support.
If broken, next possible downside continuation zone would be near 6,700 – 6,710.
Lower demand extension (6,730 – 6,740)
Good confluence with volume spike at lows → buyers defended this region before a sharp move up.
🟥 Supply Zones (Resistance Areas)
6,813 – 6,834 region
Clear previous consolidation before a breakdown.
This area now acts as a major supply / resistance zone.
Expect sellers to step in if price retests this zone — first test may trigger rejection.
It’s aligned with a local structure high; several long upper wicks in the past confirm supply pressure.
Above 6,834 → potential next supply
Around 6,850 – 6,860 (top of previous distribution).
Disclaimer:
This content is for informational purposes only and does not constitute financial or investment advice. © DIBAPRISM
Amir D.Kohn

Battle at the 18maSPX futures gapped up and got to the 18ma area. If we close below the 18 today it would likely be bearish, and a close above would be likely bullish. There's a gap on futures which may get filled. Gold had a nice bounce but it's also testing it's 18ma resistance here. BTC is at resistance. Oil is holding support at around 60 dollars.

US500 Intraday Technical Analysis📊 US500 Intraday Technical Analysis - 10 Nov 2025
S&P 500 at 6,792 (4:45 PM UTC+4) — Major breakout setup with confluence
━━━━━━━━━━━━━━━━━━━━━━━━━━━━━━━━━━━━
🔍 MARKET STRUCTURE
🔸 Wyckoff Phase D re-accumulation; Dow Theory primary uptrend intact
🔸 Gann Square-of-9 targets: 6,950 (resistance) / 6,650 (support)
🔸 Elliott Wave (3) extension in progress toward 6,950-7,050
━━━━━━━━━━━━━━━━━━━━━━━━━━━━━━━━━━━━
📈 TIMEFRAME MATRIX
Daily (1D): Rising channel 6,700-6,900; RSI 62 (bullish); Ichimoku cloud support 6,550
4H: Broadening wedge 6,750-6,900; EMA21>EMA50>EMA200 (golden cross); VWAP 6,680
1H: Cup-and-handle pattern; BB expanding; VWAP slope bullish
30M: Symmetrical triangle 6,780-6,850; hidden bull divergence on RSI; volume contracting
15M: Bull flag above 6,790; Tenkan>Kijun bullish; stochastic reset ready
5M: Falling wedge retest 6,800; hammer shows demand; watch false breakout
━━━━━━━━━━━━━━━━━━━━━━━━━━━━━━━━━━━━
🎯 PRIMARY LONG (HIGH PROBABILITY)
Entry: 6,790-6,820 (flag support + VWAP confluence)
SL: 6,750 (below triangle base)
TP1: 6,880 (+90 pips)
TP2: 6,950 (+160 pips — channel resistance)
TP3: 7,050 (+260 pips — harmonic extension)
Confirmation: RSI >55, volume +20%, VWAP holding
⚡ MOMENTUM SCALP
Add above 6,950 ONLY if RSI >65 + volume surge; trail stop 6,920
🔻 REVERSAL SHORT
Entry: 6,950-7,000 (supply resistance)
SL: 7,050 (above wedge)
Targets: 6,900 → 6,820 → 6,750 (Gann support)
Trigger: Bearish engulfing + RSI divergence on 5M/15M
━━━━━━━━━━━━━━━━━━━━━━━━━━━━━━━━━━━━
🚨 BREAKOUT ALERTS
✅ BULL: 1H close >6,950 confirms breakout → target 7,150; move SL to BE+25
✅ BEAR: 1H close <6,780 with volume → retest 6,650 cloud support
━━━━━━━━━━━━━━━━━━━━━━━━━━━━━━━━━━━━
📊 INDICATOR SNAPSHOT
BB Squeeze (30M) expanding | MACD histogram positive | VWAP slope up | EMA21 = trigger line | Hidden bull divergence confirmed on RSI
⚠️ PATTERN RECOGNITION
Harmonic Bat PRZ: 7,050 | Rising Wedge failure <6,790 = Wyckoff spring | H&S risk if 6,700 breaks | Bull trap risk above 6,950 without volume
📈 TIMING & VOLATILITY
Gann 90° window 21:00 UTC (US close) | ATR(14) ≈100 pts | Earnings whispers elevate risk | Risk ≤1% per setup; lock TP1; avoid chasing sub-avg volume
Educational analysis only. Follow your plan, manage risk, adapt to live price action.
━━━━━━━━━━━━━━━━━━━━━━━━━━━━━━━━━━━━
S&P long amid positivity on US Gov shutdownPossibly long on S&P as positivity around the potential reopening of the US government.
Markets gap higher Sunday open on the news and provides a good area to trade off.
4hr chart
- Rejected off fib retracement
- Broken counter trendline and resistance
- Fill of gap and retest of trendline provides good area of support
Would require confirmation on lower TF breakout
Caution around earnings and missed data to be released upon the government reopening.
