S&P500 - US markets closed, liquidity thinUS Thanksgiving Holiday
US markets closed, liquidity thin globally.
Expect muted volumes, potential for exaggerated moves in FX and rates due to reduced participation.
Key Support and Resistance Levels
Resistance Level 1: 6830
Resistance Level 2: 6848
Resistance Level 3: 6866
Support Level 1: 6770
Support Level 2: 6756
Support Level 3: 6735
This communication is for informational purposes only and should not be viewed as any form of recommendation as to a particular course of action or as investment advice. It is not intended as an offer or solicitation for the purchase or sale of any financial instrument or as an official confirmation of any transaction. Opinions, estimates and assumptions expressed herein are made as of the date of this communication and are subject to change without notice. This communication has been prepared based upon information, including market prices, data and other information, believed to be reliable; however, Trade Nation does not warrant its completeness or accuracy. All market prices and market data contained in or attached to this communication are indicative and subject to change without notice.
Trade ideas

SPY - likely lower into next weekCorrection of yesterday's strong down move is likely close to being over here. Gold also looks like it will drop and probably hard. Oil, probably lower. BTC lower.

Don’t Let Panic Drive Your Decisions, The Market Reward PatienceDon’t Let Panic Drive Your Decisions — Because The Market Rewards Patience
The last few days in the S&P 500 were the perfect reminder of how quickly sentiment swings — and how dangerous emotional trading can be.
* Nov 20: Headlines screamed about an “AI Bubble Burst,” triggering panic selling.
* By Nov 21: Market declined +3.5%, wiping over $2 trillion in market value.
* By Nov 26: The same market recovered $2.6 trillion, pushing the S&P 500 back above 6800
* S&P 500 is now just 1.6% away from all-time highs (6921).
Anyone who sold in fear on Nov 20–21 is now sitting on regret, while disciplined investors who stayed calm are comfortably in profit.

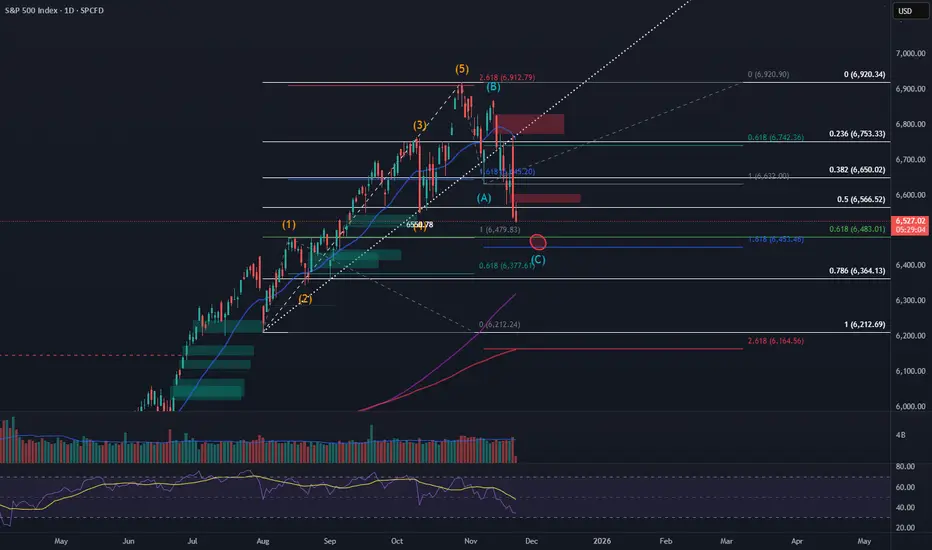
SPX Corrective Wave C Approaching Key Fibonacci ConfluenceThe S&P 500 appears to be completing an A–B–C corrective structure following the recent top. Price is currently breaking below wave (A) and moving toward a strong confluence zone at the 0.618–1.618 Fibonacci levels. This area aligns with prior demand, trendline support, and measured targets, making it a potential reversal zone for wave (C). Watching for bullish reaction or confirmation before considering upside continuation.
S&P 500 Wave Analysis – 21 November 2025
- S&P 500 index reversed from strong support level 6555.00
- Likely to rise to resistance level 6800.00
S&P 500 index recently reversed from support area between the strong support level 6555.00, lower daily Bollinger Band and the 50% Fibonacci correction of the upward impulse from August.
The upward reversal from the support level 6555.00 stopped the previous minor ABC correction 2 from the end of October.
Given the clear daily uptrend, S&P 500 index can be expected to rise to the next resistance level 6800.00 (former top of wave (3) from October).

S&P 500 – DTF Technical & Fundamental AnalysisS&P 500 – DTF Technical & Fundamental Analysis
⚠️ S&P 500 Update – Short-Term Bullish, But Overall Structure Shows Weakness
The S&P 500 recently experienced a short-term bullish move after retesting the key support level at 6,500, which is now acting as a major support following the reversal. This rally was largely driven by major technology and AI-related firms, especially Alphabet. Strong earnings and leadership in generative AI have boosted investor confidence, propelling the index to new highs.
Despite this, technical factors suggest caution. On the daily timeframe, the overall market structure after the bullish trend is forming lower highs and lower lows, indicating that buyers are losing momentum. This rally could be temporary, largely representing liquidity grabs above previous highs rather than a true trend reversal. From a technical perspective, 6,500 is a critical support zone. If this level holds, the S&P 500 could continue the short-term bullish move. However, if this level breaks with high volume, a deeper correction may follow, potentially targeting the next major demand zone around 6,370.
The market remains highly reactive to both technical triggers and fundamental news, so caution is advised. Watch key levels closely and wait for confirmed structure before taking positions.
⚠️ Risk Disclaimer
This analysis is for educational purposes only and is not financial advice. Trading CFDs and Forex involves high risk. Always trade responsibly and manage your risk.

$SPX - Turkey WeekI made this turkey with my strong hand:
Bulls seek to close >6700
Bears seek to contain <6700, IDEALLY <6600
OUTLOOK = choppy, bumpy, and fun - keep it small, keep it tight like a tiger
Feel free to comment or add input 💪
Inside modified pitchfork anchors on macro
cyan trend line = .618
fusia = median
LARGER TF POSTED BELOW

US500 Bullish: Entry: 6,700 – 6,720US500 – Institutional Intraday Analysis (Athena Protocol v7.3)
Exchange: IC Markets
Current Price: ~6,791.00
Current Time: 01:57 UTC-5
Timeframe: 90m
1. Market Bias: Bullish (but overstretched and vulnerable to a liquidity tap)
Bias Explanation
This chart screams: “Yes, we are bullish, but please… someone sweep me properly before I continue.”
Let’s break it down.
Goldbach Levels
Strong PO3 clustering around 6561 and 6723–6804, but price is now far above these baselines.
– Algo signals on the 27 and 81 rows: BR → FV, RB → OB, -RB → -OB
These represent continuation patterns, not reversal ones.
– The 243 & 729 rows show FV → MB and LV → -LV, again supportive of continuation after retracement.
Conclusion: Goldbach models favor bullish continuation after a pullback.
They do not support longing at current highs.
Visible Range Volume Profile
– Major HVN at ~6,690–6,720
– Low-volume void above price → explains the straight-line rally.
– But current price at 6,791 is sitting in a thin-volume zone = susceptible to deep intraday pullbacks.
Session Volume Profile
– Sessions are printing higher Value Area Highs and Lows → trending structure.
– But today’s session POC is lagging behind price → inefficiency = retracement likely.
CVD
– CVD is flat-to-slightly declining despite price rising.
This is one of Athena’s biggest red flags:
Displacement not supported by real buy flow = engineered move.
COT (Non-Commercial USD positions)
Massively bearish sentiment:
– % Short = 73%
– Net positions = –14,933, worsening from –13,145
– Big players increased shorts, decreased longs.
This is why pullbacks on US500 have been savage lately.
Macro Snapshot
– FOMC cautious but not dovish; market pricing soft-landing narrative.
– Trump’s fiscal plans support equities short-term.
– But rising Middle East tensions + Treasury issuance linger as downside catalysts.
Overall Bias: Bullish trend, but the smarter long is taken after the sweep.
2. Key Interpretation
– Market is too high, too fast.
– CVD + COT warn that this pump is weak-handed.
– Volume profile signals a retest toward 6,720 or even 6,660 before further rally.
Bias: BUY ONLY — but only after liquidity raids.
Not at the highs. Never at the highs. Not even if you’re feeling lucky.
3. Smart Money Buy Levels
A. Aggressive Buy Limit
Entry: 6,745 – 6,755
SL: 6,708
TP1: 6,793
TP2: 6,820
TP3: 6,855
Rationale:
– First micro-inefficiency beneath current structure.
– Will likely fill on the first intraday pullback.
– Partial mitigation of the OB at the current high.
Win Probability: ~58%
Works if momentum continues without deep sweep.
B. Conservative Buy Limit (Primary Institutional Level)
Entry: 6,700 – 6,720
SL: 6,660
TP1: 6,780
TP2: 6,815
TP3: 6,860
Rationale:
– This is the visible range HVN and prior volume shelf.
– The ideal level where algos reload.
– Matches Goldbach’s 81 PO3 level + session POC cluster.
Win Probability: ~72%
Most reliable for today’s trading.
C. Very Safe Buy Limit (Institutional Raid Zone)
Entry: 6,645 – 6,660
SL: 6,588
TP1: 6,720
TP2: 6,780
TP3: 6,840
Rationale:
– Deep sweep of equal intraday lows.
– Cleans out all short-term long stops.
– Aligns with Goldbach 729 and 243 baseline structures.
– Best RR, but may not fill unless NY session gets heavy liquidity injection.
Win Probability: ~81%
The highest-probability setup but lowest fill probability.
4. Why These Plays Work
Technical Confluence
– US500 is extended into low-volume weeds.
– CVD shows buyers exhausted.
– Goldbach signals agree with continuation but ONLY after the retrace.
– Volume profiles indicate untested demand zones below.
Macro Confluence
– Equities remain favored but heavily crowded.
– Short-term short squeeze may have just finished.
– COT data screams: “Market too high. Needs a flush.”
So we wait… and buy the flush.
5. Best Trading Session
– London AM → NY Opening Range
These sessions consistently deliver the retracements US500 refuses to give in Asia.
6. Athena’s Final Words
US500 right now is like a caffeinated intern: sprinting full-speed without checking whether their shoelaces are tied.
Spoiler: they’re not.
Let the kid trip, scoop up the dip, and ride the rebound.
This is educational analysis, not financial advice.

SPX500 – Key Levels After 3.5% Drop | Bearish Below 6578SPX500 | OVERVIEW
U.S. index futures declined as Nasdaq and S&P500 faced renewed selling pressure, with tech names — including Nvidia — continuing to weaken after Thursday’s sharp drop.
Concerns over stretched valuations remain a key driver of the pullback.
SPX500 – Market Outlook | Bearish Below 6578
SPX500 and Nasdaq futures fell again as tech stocks remain under pressure following Thursday’s selloff. Market sentiment continues to weaken due to concerns over stretched valuations.
Below 6578: Bearish continuation toward 6510 → 6425
Above 6578 (1H close): Short-term correction toward 6610 → 6635
Pivot: 6578
Support: 6510 · 6425
Resistance: 6610 · 6635
SPX500 stays bearish as long as price remains below the pivot. A break above 6578 would only allow a short correction, not a trend reversal.
previous idea:

Will SPX Make New All Time Highs? We dive into the recent technical setup of the S&P500.
We are on the verge of triggering a new massive bullish patterns.
The backdrop of soft commodities. soft yields, softer dollar and the December 10 rate cute.
We have the tailwinds in place for higher price.
I would like to see some sideways chop to make this rally more sustainable, but bull market bounces are very fierce especially when they come from failed bearish patterns.

SnP500 channelSnp performance over the years covering lows and highs and drops along the way. I am bearish because BTC has corrected but the SnP has not yet.

SPX500: Tight Consolidation Before Breakout — Key Levels AheadSPX500 | Technical Overview
New York Fed President John Williams signaled Friday that a near-term rate cut is still possible, noting that labor-market weakness is now a greater risk than inflation.
Traders have increased the odds of a 25 bps December rate cut to 69%, up from 44% a week ago.
Technical Outlook
SPX500 remains volatile, but the broader momentum still leans bearish.
Price is currently consolidating between 6635 and 6610, waiting for a clear breakout direction.
A 1H or 4H close below 6610 will strengthen the bearish trend toward 6578, with further downside possible.
A break and stability above 6635 would open the door for a move toward 6670, and later 6705.
Key Levels
Support: 6610 · 6579 · 6507
Resistance: 6635, 6670 · 6704

$SPX next move higherSP:SPX 5510 is my short TP level and level to go long. It hit perfectly on Friday and now we are 200 points higher. Price action is still bullish (despite the bearish weekly candle last week). 5826 is next magnetic level. And a break above the trendline will see ATH before next of year.
SPX500: Risk-On Sentiment Builds as Bulls Eye 6733SPX500 | Technical Overview
Global markets are riding a risk-on wave after a sudden jump in U.S. rate-cut expectations, triggered by dovish comments from several Federal Reserve officials.
However, gains may cool in Europe as FX markets remain alert to possible Bank of Japan yen intervention.
Geopolitics also added to market sentiment:
U.S. President Donald Trump described relations with China as “extremely strong” after his call with President Xi — reinforcing a short-term risk-on environment.
Technical Outlook
SPX500 is expected to retest the pivot zone near 6670–6705 before attempting another bullish extension.
Bullish Scenario:
After retesting the pivot, the price may push upward toward 6733, and if momentum holds, extend to 6771 and 6800.
Bearish Scenario:
A 1H candle close below 6670 will activate bearish pressure toward 6635, with further downside potential toward 6578.
Overall structure remains bullish as long as the price trades above the pivot zone.
Support: 6670 · 6635 · 6578
Resistance: 6733 · 6771 · 6800

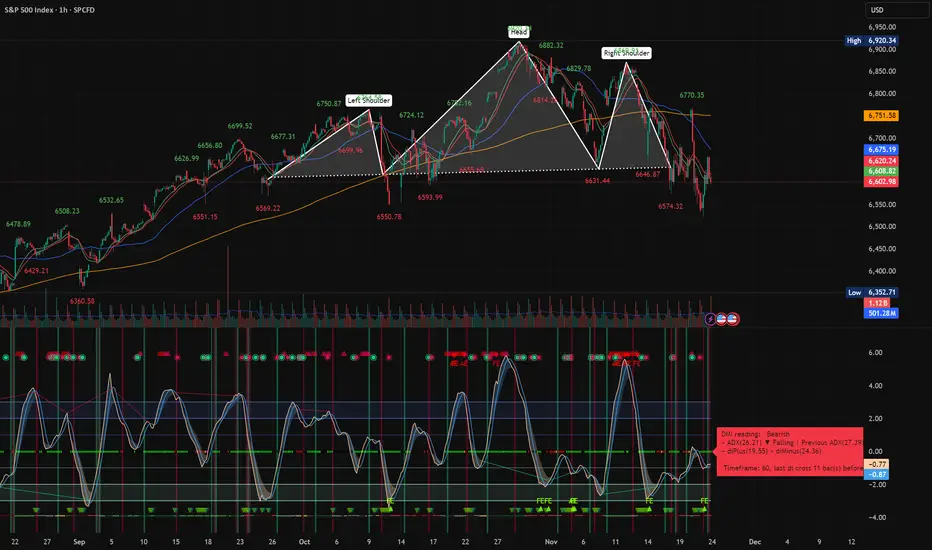
Head and Shoulders on SPXAt the core of the current setup is a fully formed Head and Shoulders pattern, which has already broken its neckline and is now in the process of playing out its measured-move target. The left shoulder formed around 6750, the head extended to roughly 6882, and the right shoulder peaked near 6829. The neckline, positioned around 6590–6630, was decisively broken. This is crucial because a neckline break with momentum and no immediate reclaim typically confirms that a bearish trend has begun. The measured downside projection, based on subtracting the pattern height from the neckline, lands near 6350, which is also a visible structural level on the chart—adding confluence to the target.
Trend structure reinforces this bearish posture. Price is trading below both the 50 EMA and the 200 EMA, creating a dual timeframe downtrend. The 50 EMA has curled downward, illustrating a clear loss in short-term strength, while the 200 EMA has acted as resistance rather than support—another hallmark of a shift in momentum. Attempts to rally back above the neckline have been weak and short-lived, showing that buyers lack control. Until price can reclaim the neckline and hold above it, the path of least resistance remains to the downside.
Volume behavior also strengthens the bearish case. Downward moves are accompanied by heavier volume, while bounce attempts show declining volume and little enthusiasm. Frequent cluster WVF signals—AE, FE, and other markers—concentrated before the breakdown. Clusters that appear before structural breaks often signal distribution. Since no capitulation spike has appeared yet, it is likely that the move is not finished. VIX is above 26, as well and curling upwards.
On the lower panel, the Momentum Oscillator is oversold, but importantly, it has not produced a strong upward reversal. Historically, similar deep dips with hesitation tend to precede an additional flush lower before the next meaningful bounce. Meanwhile, the DMI (Directional Movement Index) gives a clear bearish reading. The displayed values show ADX falling from a higher level and –DI outperforming +DI. A falling ADX during a bearish configuration suggests that although the trend is bearish, the strength of acceleration is cooling slightly—often a pause before continuation. The “last DI cross 11 bars ago” informs us that this downtrend is still young; past cycles in this chart tend to run significantly longer, suggesting more room for follow-through.
Altogether, the evidence points to a strong bearish bias. The breakdown from the Head and Shoulders pattern, rejection from both EMAs, confirming volume, bearish DMI, and lack of bullish divergence collectively support a continued decline toward the 6350 region. A rally could occur, but unless it recaptures the 50 EMA and the neckline, any bounce is likely to be corrective rather than trend-changing. For now, the most probable direction remains downward, with the measured move target representing a logical destination before any larger reversal attempt emerges.
Bullish S&P 500 - Elliott Wave Count The S&P 500 (SPX) decline since 10/29/25 has the choppy look of an Elliott wave – Double Zigzag correction. If this wave count is correct, it implies the SPX could rally in the last week of November 2025.
Intraday momentum supports this theory. The 30 – minute RSI has several bullish divergences going into the bottom made on 11/21/25. This implies selling has exhausted.
Upside price action could occur in the next few trading days.

SPX Gann boxSPX is currently turning bearish and its second motive wave of maximum 3 or 4 motive ways down according to wave count. We finished 1st wave of second bigger wave and its consolidation and are now in 2nd wave of 2nd bigger wave. Gann Box gives us time and price targets relative to length and duration of the first wave for SPX second wave down.
i highlited upcoming fibs and strong horizontal resistance. Astonishingly they fit perfectly together.

Hellena | SPX500 (4H): LONG to resistance area of 6775.Dear colleagues, according to the last forecast the price is at the support level, but as it turned out, the correction in wave “4” is a bit more complicated than I thought.
Wave “4” consists of three waves “ABC” and should be over soon. The upward movement is still in priority, but I will target the not so distant resistance area of 6775.
Once it is reached, we will think about how to reach higher levels.
Manage your capital correctly and competently! Only enter trades based on reliable patterns!

S&P 500 Surges to Pivotal Resistance- Decision time for BullsThe S&P 500 has rallied nearly 3% off the monthly low and is approaching the first major test of the late-October downtrend. Resistance is eyed at 50% retracement of the decline at 6715 and is backed closely by the 61.8% retracement at 6764. A breach / daily close above the August trendline is needed to suggest a more significant low is in place with subsequent objectives eyed at the monthly open at 6842. Key resistance remains unchanged at 6911/986.
Support rests with the October low at 6500 and losses below this threshold would threaten resumption of the near-term downtrend with the next major technical consideration seen at 6408/21- a region defined by the 1.618% extension of the October decline and the 23.6% retracement of he yearly range. Look for a larger reaction there IF reached.
Bottom line: The S&P 500 is approaching downtrend resistance early in the week and the outlook remains tilted to the downside while within this formation. Look for a reaction into 6715 for guidance in the days ahead. From a trading standpoint, losses would need to be limited to the monthly low-day close / weekly open at 6574 IF price is heading for a breakout here with a breach above 6764 needed to fuel the next leg.

S&P 500 – Upside TargetDow Jones & S&P 500 – Testing Key Support After a One-Month Decline
Both the Dow Jones and the S&P 500 have pulled back over the past month and are now approaching a significant support area. This zone continues to attract the attention of investors, indicating that demand remains strong despite recent weakness.
Based on the current order flow and buying interest seen in the market, the broader long-term trend for both indices still appears bullish.
S&P 500 – Upside Target
For the S&P 500, the first major upside target is located near 7000, and there is a strong possibility that price could reach this level within the next month if buying pressure continues.
Sasha Charkhchian

SPX: Are tech stocks overvalued?Are tech stocks too expensive at this moment? This continues to be one of the main questions among investors. The second is related to the next Fed move at the FOMC meeting in December. The markets entered November in a corrective mood. The S&P 500 dropped another week in a row, to the level of 6.524. Although the market was trading in a positive territory on Friday, still, the S&P 500 is marking around a 5,5% drop for the month.
The week started with markets' high concerns regarding Nvidia quarterly results. Jan Huang brought some relief commenting that the demand for chips remains extremely strong, especially for its Blackwell GPUs. The posted quarterly result showed Q3 revenue of $57B, up 62% y/y. The company expects strong earnings to continue till the end of this year, with estimated $65B in Q4, which is higher from current Wall Street estimates. Regardless of data, the shape price dropped by 11%.
Amazon is cutting more than 1,800 engineering roles as part of a broader reduction of 14,000 corporate jobs, the largest layoff in its 31-year history. Its share price went down by 8% for the week. On the opposite side, Alphabet (GOOGL) managed to hold the higher grounds, despite the general sell-off of tech stocks.
The sentiment on equity markets continues to be negative, with decreasing expectations that the Fed might cut interest rates in December. Current odds by the CME FedWatch Tool dropped to 41%, considering relatively mixed jobs data posted for September.
Bear Case for DecemberBear Case for December.
Looking for the sell off to continue.
Decent R/R with a clear "stop" level above us.

Last chance for SPX500USD to go upHi traders,
Last week SPX500USD dropped, went corrective up and dropped again.
The pattern changed. Now it could become an (orange) wave 4 Triangle (if it doesn't break the grey arrow) or it finished a Zigzag.
So next week we could see more (corrective or impulsive) upside for this pair.
Let's see what the market does and react.
Trade idea: Wait for a small correction down on a lower timeframe. After a change in orderflow to bullish you could trade longs.
This shared post is only my point of view on what could be the next move in this pair based on my technical analysis.
But I react and trade on what I see in the chart, not what I've predicted or expect.
Don't be emotional, just trade your plan!
Eduwave
