Powell cutting rates? But why would he?📉 Powell cutting rates? 100% priced in. Even talk of 1–2% slashes. But why would he?
Let’s look at what the media ignores:
🇮🇳 Reports suggest India plans to cut its US Treasury holdings by up to 50% by 2025. That could mean roughly $450B hitting the market. Who’s going to buy that debt? The Fed? They’re already running negative equity — something that would be called insolvency for any private company.
Lowering rates would allow the US government (and its billionaire buddies) to borrow even more cheap money — not to fix the economy, but to speculate, pump Bitcoin, and trash the dollar further. Inflation? Even worse.
The US economy shows all the symptoms of a recession: layoffs rising, real wages falling, manufacturing shrinking. Official GDP numbers still look positive, but let’s not forget those “revisions” that always come later. Translation: the data is constantly massaged.
So what’s the real goal? Probably to juice the housing market. But let’s be honest: US mortgage rates today are just average by historical standards. Russia’s rates are higher, yet their currency and balance sheet look healthier because they don’t live off endless money printing.
The core problem is clear: reckless dollar printing to protect billionaire portfolios. And Powell? If he truly had conviction, he wouldn’t touch the rate at all.
US500 trade ideas

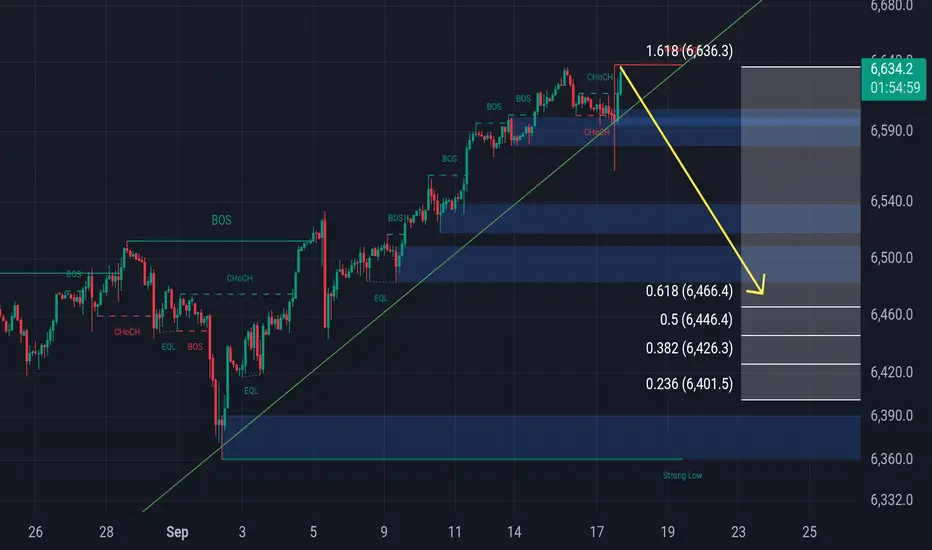
Monitoring possible Retest of BOS then .618This is just a short scalp, not a permanent short.. Monitoring the flow on the 2hr, Im seeing a bearish divergence leading into an apex.. I havent posted in awhile and thought I would share something im working on..
Hellena | SPX500 (4H): LONG to resistance area of 6700.Colleagues, I think we should expect the upward movement to continue. The upward impulse is not over yet, but I think we may see a correction to the 6500 area, then I expect the upward movement to continue to the 6700 area, which is a pretty strong psychological level and is the area of 50% levels of Fibonacci extension.
Manage your capital correctly and competently! Only enter trades based on reliable patterns!

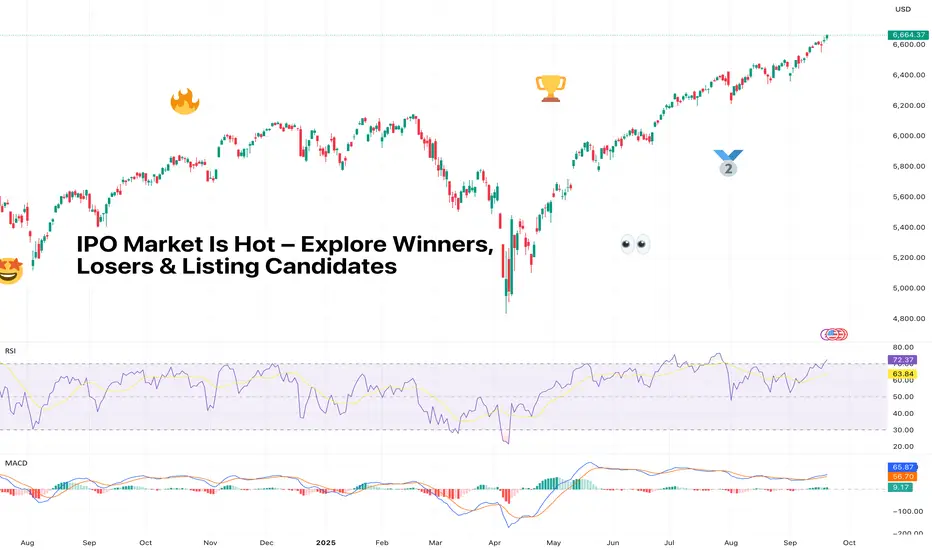
IPO Market Is Hot – Explore Winners, Losers & Listing CandidatesThe IPO market has woken up from its multi-year nap and is now in beast mode. But as always, Wall Street’s hottest party comes with an entrance fee and a dose of uncertainty – opaque prices, sketchy balance sheets, and a whole lot of FOMO.
So who’s winning, who’s losing, and who’s still waiting in the pipeline? Let’s find out.
🚀 The IPO Mania Returns
After years of drought, IPO mania is back in full swing. More than 150 companies have listed this year – up from 99 at this point in 2024 and just 76 in 2023, according to Renaissance Capital.
Together, they’ve raised nearly $30 billion, compared with $24 billion last year. First-day gains? Averaging 26%, the best since 2020. IPOs aren’t just back, they’re back with conviction.
Renaissance estimates we could see 40–60 more deals before the year is out. In other words, if you thought you missed the fun, the afterparty’s still ahead.
🤗 The Winners
Some debuts have been straight out of an IPO fantasy league.
Circle NYSE:CRCL , the stablecoin issuer, lit up the screens with a jaw-dropping 168% surge on its first trading day.
Firefly Aerospace NASDAQ:FLY , a rocket and lunar lander, blasted 30% higher on its IPO day, living up to its name.
Klarna NYSE:KLAR didn’t exactly moon, but a 15% pop for a lossmaking buy-now-pay-later firm isn’t shabby in this environment.
Then there’s Figure NASDAQ:FIGR , the blockchain-native mortgage lender. Since its listing in mid-September , it’s up 44% even after a midweek stumble. Investors love a fintech-meets-crypto mashup story – and Figure is playing it well.
Who said Figma NYSE:FIG ? The design software maker went vertical in its market debut , although reality has since slapped it down from those frothy day-one highs. Still, design nerds everywhere are proudly watching their favorite platform make its way up the rankings among the world's biggest software companies .
😭 The Losers
Not every IPO has the golden touch.
StubHub NYSE:STUB , the ticketing platform, came in hot with an 8% intraday pop above its $23.50 listing price, only to end its first session underwater at $22 . The days after? Even worse – the stock is floating near the $18 mark.
CoreWeave NASDAQ:CRWV , the AI up-and-comer, is a really interesting one. First off, it stumbled at the start after pricing its shares at $40 to float in March.
It traded under its IPO price for a while before clawing back with AI hype fueling the shares by 450% May through June. Then insider selling knocked the winds out of its sails in August.
Now it’s gravitating at triple its offering price, proving IPOs are a marathon, not a sprint.
🎲 The Pricing Game
The truth is, IPO pricing is as much science as it is art (and sometimes performance art). Investment banks like Goldman NYSE:GS , Morgan Stanley NYSE:MS , and Citi NYSE:C run the roadshows, build the books, and set the price. Oversubscribed IPOs often guarantee a strong open. Undersubscribed ones? Crickets.
Bears hate this one simple trick: most IPOs only float about 15–20% of the company. That tiny slice of tradable shares means volatility is baked into the flotation. Throw in a 180-day lockup (when insiders can’t sell), and early trading is a weird mix of price discovery and pure speculation.
💡 The Fundamentals Still Matter
The hype is real, but the numbers don’t lie. Valuations on some of these newly public firms are eye-watering. Circle trades at 130x earnings estimates, Figma at 184x. Compare that to Adobe’s 5x and you see how far the IPO froth can go.
Meanwhile, many of these firms aren’t consistently profitable. They post alternating quarters of red ink and black ink while investors cheer growth over everything.
🦄 Unicorn Watch: Who’s Next?
Here’s who’s buzzing on the IPO radar and what they’re worth in 2025:
• OpenAI, AI overlord, $500 billion
• SpaceX, rockets and satellites, $450 billion
• xAI / x.com, Elon Musk’s AI play, $200 billion
• Anthropic, OpenAI rival, $190 billion
• Databricks, data and AI analytics, $100 billion
• Stripe, payments giant, $92 billion
• Revolut, digital banking, $75 billion
• Canva, design platform (and your CV maker), $42 billion
• Fanatics, sports merch and betting, $30 billion
• Discord, chat for gamers (and everyone else), $15 billion
• Solera, software and data for auto and insurance, $10 billion
• Grayscale, crypto asset manager (part of Digital Currency Group), $10 billion
• AlphaSense, market intelligence, $4 billion
• Wealthfront, robo-advisor, $2 billion
• Quora, knowledge-sharing platform, $500 million
📉 The Risk of Chasing
So should you pile in? Here’s the trader’s dilemma: first-day pops are seductive, but inflated pricing means you’re often exit liquidity for early investors.
Waiting a few days, weeks, or even months for the froth to fade, lockups to expire, analyst coverage to roll in, and the hype to cool may be the smarter play.
🫶 Final Take
The current IPO season is hot, but so is the risk. But every IPO is different. Circle shows monster returns are possible, while StubHub proves not every ticker deserves a ticker-tape parade.
The winners? Companies with strong fundamentals (not just growth, but profits) and a story that Wall Street loves right now (AI, crypto, fintech).
The losers? Overpriced firms without consistent performance. The candidates? Mega-unicorns waiting for their grand entrance and some smaller players ready to make a splash.
As always, timing is everything. Here’s to hoping your favorite IPO won’t list right after a hawkish Jay Powell.
Off to you : What IPOs are on your radar for this year and the next? Share your thoughts in the comments!
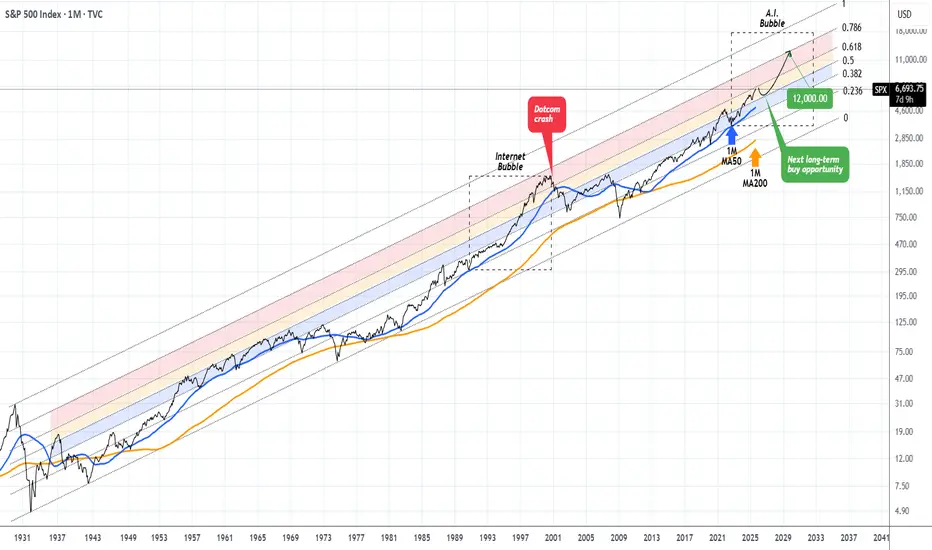
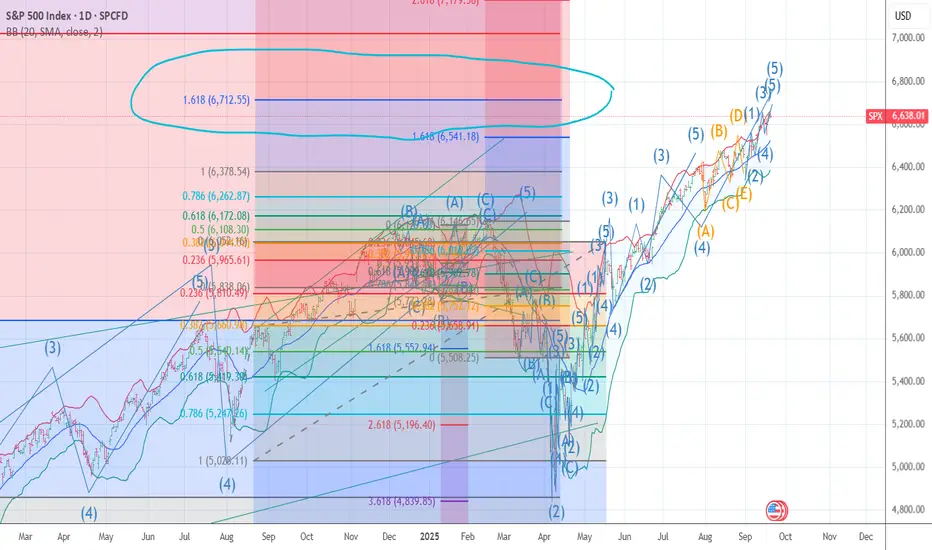
S&P500 approaching a Resistance that was last tested in 1998 !!This isn't the first time we present you this chart, in fact from time to time (usually on a quarterly basis) we like to bring this forward with some adjustments in order to help us maintain a long-term perspective.
And that technically shows the S&P500 index (SPX) trading within a century long Fibonacci Channel Up (since the 2029 Great Depression) with clear Bull and Bear Cycles. We will not get into much details on those, as they've been analyzed extensively in previous publications but we will point out that currently we remain inside a multi-year Bull Cycle.
In fact, since the November 2022 market bottom, we believe we've entered the A.I. Bubble, which is in our opinion (perhaps a more aggressive) version of the Internet Bubble of the 1990s. Again this has been analyzed extensively before.
Right now the index is approaching the top of the 0.5 - 0.618 Fib Zone (orange range). The one above (0.618 - 0.786 Fib, red Zone), was first entered in February 1998 and exited for good at the start of the Dotcom crash in February 2001. Since then, the market never even touched it (almost 25 years).
We believe that a marginal test and break inside this 'ghost zone' could be attempting by late 2025 - Q1 2026 and then a strong correction back near the 1M MA50 (blue trend-line) will present the next long-term buy opportunity that could fuel the A.I. Bubble until it finally bursts within 2030 - 2032.
Until then, a 12000 Target on SPX isn't at all an unrealistic one, in our opinion.
-------------------------------------------------------------------------------
** Please LIKE 👍, FOLLOW ✅, SHARE 🙌 and COMMENT ✍ if you enjoy this idea! Also share your ideas and charts in the comments section below! This is best way to keep it relevant, support us, keep the content here free and allow the idea to reach as many people as possible. **
-------------------------------------------------------------------------------
💸💸💸💸💸💸
👇 👇 👇 👇 👇 👇
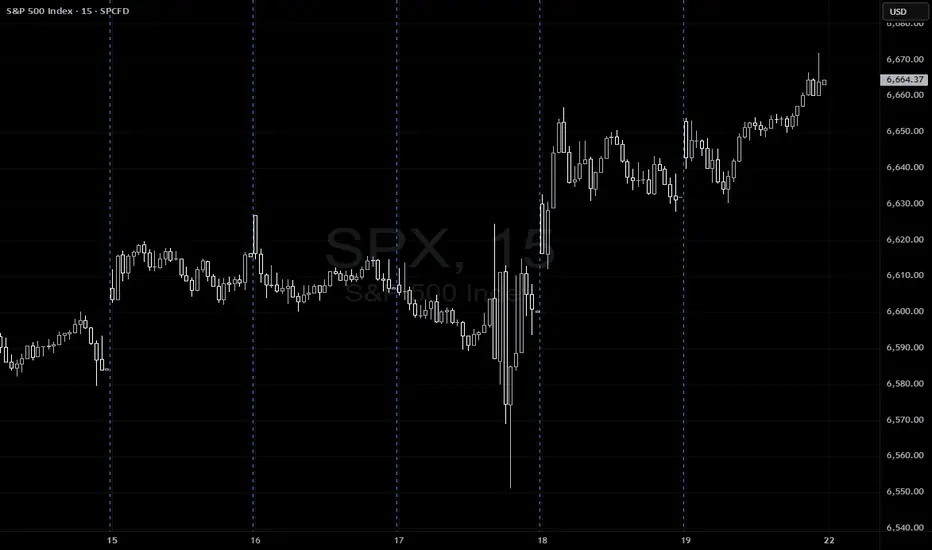
S&P 500 consolidated near a new high zoneThe S&P 500 consolidated near a new high zone of 6600 as markets brace for the Federal Reserve’s rate decision this week. Futures remain supported by expectations of a steady policy stance, while traders await Chair Powell’s commentary for guidance on inflation trends, labour market weakness, and trade risks.
Monday’s rally to record levels was fuelled by optimism surrounding U.S.–China trade talks and strong performance from the technology sector.
Technical Outlook
The Fed meeting and Powell’s tone remain the primary catalysts A decisive break above 6612 could open the way toward the next psychological resistance zone around 6720.
You may find more details n the chart.
Trade wisely Best Of Luck.
Ps; Support with like and comments for better analysis thanks for Supporting.

SP500 Consolidation Higher to fresh HighsThe S&P 500 is consolidating within a strong range as U.S. stocks gained traction on Monday, extending record highs with additional support from the technology sector. Markets continue to assess the outlook for interest rates, but sentiment remains broadly positive.
The index advanced more than 0.5%, maintaining a bullish structure. Key resistance is seen around 6760.40, while support rests near 6650. As long as price action remains above the support zone, the path of least resistance favours continued growth.
You may find more details in the chart.
Trade wisely best of Luck,
Ps; Support with like and comments for better analysis Thanks for Support.

Major S&P 500 - Bearish Signals On 09/19/25 the S&P 500 (SPX) had two major bearish Signals.
Since March of 2000 all significant SPX peaks occurred with a rising VIX. On 09/19/25 the VIX made its second higher bottom since 08/28/25.
Daily RSI has reached the overbought zone and has a bearish divergence.
A multi – week decline could begin soon.

S&P500 |H1 Rising Wedge | GTradingMethodHello Traders, happy Tuesday!
🧐 Market Overview:
I’ve been closely tracking the rising wedge forming on the 1 hour chart. While this isn’t a pattern I normally trade, the structure caught my attention, and I decided to expose a small amount of risk.
Rising wedges are generally bearish in nature - they don't always have to be though. If I zoom out, markets are over bought on the RSI and there are rsi divergences on multiple timeframes. This is one signal that markets need to cool off before advancing further. So bearing in mind the RSI divergences and the bearish pattern, I have decided to risk a small amount.
Further, if this pattern plays out, it will likely bring crypto down with it.
Ideally, I’d prefer to see a clean double top develop before committing more exposure on the short side.
📊 Trade Plan:
Entry: 6 633.7
Stop Loss: 6 648.7
Take Profit: Not predefined (will target structural support levels highlighted on the chart)
🙏 Thanks for checking out my post!
Make sure to follow me to catch the next idea and please share your thoughts – I’d like to hear if anyone else is trading this pattern or if you have any tips on how to trade it.
📌 Please note:
This is not financial advice. This content is to track my trading journey.

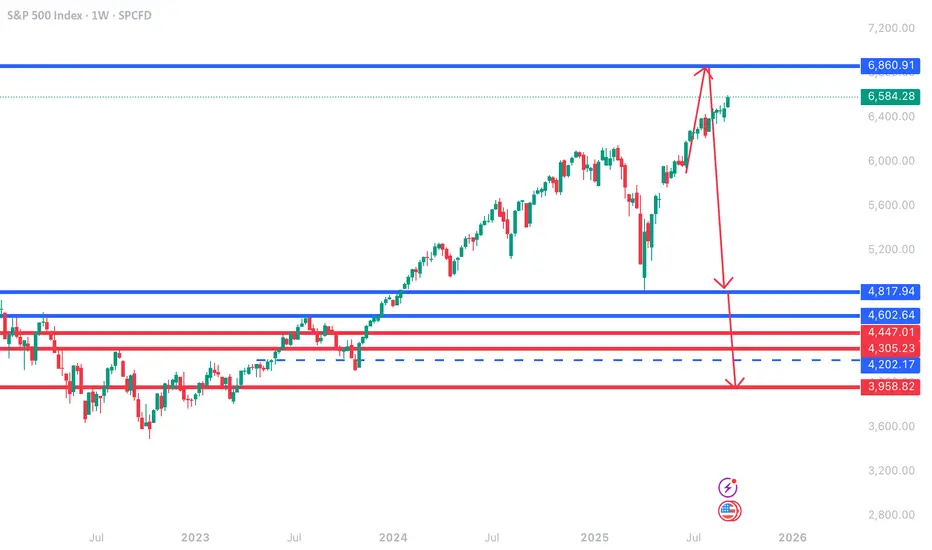
SPX to 6,860$ WITHIN the NEXT WEEK!!!We have been calling this since 5,800$.
I wish I could tell you how I do this.
I have one heck of a set up.
it should keep pumping to 6,860$ as stated!
and thereafter, I don't have to say anymore as there will be the imminent crash I've been talking about.

We called this bull move on SPX but be wary!We stated in our most recent post on SPX that it would be pumping to 6,860$ and then see a financial crash like no other before.
See that idea linked below and follow for more outstanding calls like this.
SPY / S&P TOO HOT....gravity is strongMore traditionalist here and following technicals (macro-level). We see insane PE / CAPE ratios, higher than dot.com, most expensive stock market ever, and weakening economy. Not being fooled by tech companies buying from each other with CAPEX (100% depreciation). Correction will happen faster than people think! It's easy to get pumped up by the narrative, but the real story is not good and media outlets like CNBC / FoxBusiness are spinning good stories that are mostly opinions with zero fundamentals or historical context. Best of luck!
Add CBOE:UVIX CBOE:MSTZ CBOE:BTCZ to your portfolio before they spike

Stock market pullback aheadIt’s an incredible time for retail investors: the market is pumping non-stop, and it seems like it could continue indefinitely.
However, the charts are signaling a different scenario as we approach October.
MACD is at the top of its range
RSI is at the top of its range
Stochastic is at the top of its range
While liquidity remains high and rate cuts appear increasingly likely, history shows that when these indicators reach such extremes on the 1-week timeframe, a market correction often occurs. This reset can pave the way for further growth.
In short, we may see a correction, sideways movement, or a pause, most likely starting in October.
Anything is possible, but the charts don’t lie—even if sentiment can be misleading.
Monitor the situation closely: a market correction can also be a great opportunity to buy at lower prices.
DYOR.

Index Futures & Options1. Introduction to Index Derivatives
Financial markets thrive on two main goals: wealth creation and risk management. Investors, traders, and institutions constantly look for tools that can help them protect against uncertainties or magnify profits. One such set of tools are derivatives, financial contracts whose value is derived from an underlying asset such as stocks, commodities, currencies, or indices.
Within the derivatives universe, Index Futures and Options are among the most widely traded instruments globally. They are not based on a single stock but on a basket of stocks represented by a market index like the S&P 500 (US), Nifty 50 (India), FTSE 100 (UK), or Nikkei 225 (Japan).
Why indices? Because they reflect the overall performance of a market segment or economy, making them powerful tools for broad-based speculation, hedging, and arbitrage.
2. What are Index Futures?
An Index Future is a standardized derivative contract traded on an exchange where two parties agree to buy or sell the value of an index at a future date for a pre-agreed price.
Unlike stock futures, index futures do not involve delivery of actual shares since an index itself cannot be delivered. Instead, they are cash-settled contracts.
For example:
Suppose the Nifty 50 index is at 20,000 points today.
You buy one Nifty Futures contract expiring next month at 20,100 points.
If, on expiry, Nifty closes at 20,500, you make a profit of 400 points × lot size.
If it closes at 19,800, you incur a loss of 300 points × lot size.
Key Features of Index Futures:
Underlying: A stock market index.
Lot Size: Fixed by the exchange (e.g., 50 units for Nifty in India).
Cash Settlement: No delivery of shares, only the difference in value.
Margin Requirement: Traders must deposit initial and maintenance margins.
Leverage: Small capital controls large exposure.
3. Mechanics of Index Futures Trading
Steps Involved:
Select Index Future (e.g., Nifty, S&P 500).
Choose Expiry (monthly, weekly in some markets).
Place Buy/Sell Order on exchange.
Margin Blocked: Initial margin required (5–12% typically).
Mark-to-Market (MTM) Settlement: Daily profits/losses adjusted in trader’s account.
Expiry Settlement: Final cash settlement at index closing price.
Example:
Trader A buys Nifty Futures at 20,000.
Next day Nifty closes at 20,200.
Profit = 200 × 50 (lot size) = ₹10,000 credited to Trader A.
This daily settlement ensures default risk is minimal.
4. What are Index Options?
An Index Option is a derivative contract that gives the buyer the right (but not obligation) to buy or sell an index at a pre-decided strike price before or on a specified expiry date.
Like futures, index options are cash-settled since indices cannot be delivered physically.
Types of Index Options:
Call Option (CE) – Right to buy index at strike price.
Put Option (PE) – Right to sell index at strike price.
The seller (writer) of the option, however, has the obligation to fulfill the contract if the buyer exercises it.
5. Types of Index Options (Call & Put)
Let’s simplify with an example using Nifty 50:
Call Option Example:
Nifty = 20,000.
You buy a Call Option (CE) with Strike = 20,100 at Premium = 150.
On expiry, if Nifty = 20,400 → Intrinsic value = 300; Profit = 150 (after premium).
If Nifty < 20,100 → Option expires worthless; Loss = Premium (150).
Put Option Example:
Nifty = 20,000.
You buy a Put Option (PE) with Strike = 19,800 at Premium = 120.
On expiry, if Nifty = 19,400 → Intrinsic value = 400; Profit = 280 (after premium).
If Nifty > 19,800 → Option expires worthless; Loss = Premium (120).
6. Pricing & Valuation Concepts
Index futures and options pricing depends on multiple factors:
Futures Pricing (Cost of Carry Model):
Futures Price = Spot Price × (1 + r – d)^t
Where,
r = Risk-free interest rate
d = Expected dividend yield
t = Time to expiry
Option Pricing (Black-Scholes Model):
Key Inputs:
Spot Index Level
Strike Price
Time to Expiry
Volatility
Risk-free Rate
Dividends
Options’ premiums consist of:
Intrinsic Value = Difference between spot and strike.
Time Value = Premium paid for future uncertainty.
7. Key Strategies using Index Futures & Options
Futures Strategies:
Directional Trading:
Buy futures if bullish on market.
Sell futures if bearish.
Hedging:
Long-term investors sell index futures to hedge portfolio risk.
Arbitrage:
Exploit mispricing between futures and spot market.
Options Strategies:
Protective Put: Buy puts to protect long portfolio.
Covered Call: Sell call against index holdings to earn premium.
Straddle: Buy call + put at same strike → profit from high volatility.
Strangle: Buy OTM call + OTM put → cheaper than straddle.
Iron Condor: Combination of spreads → profit in low volatility.
8. Role in Hedging & Speculation
Hedging:
Institutional investors with large portfolios use index derivatives to offset market-wide risks. Example: A mutual fund holding 500 crores worth of stocks may sell Nifty futures to hedge against a market fall.
Speculation:
Traders with directional views use leverage in index futures/options to profit from short-term moves.
Portfolio Insurance:
Buying index puts acts as insurance during market downturns.
9. Advantages & Disadvantages
Advantages:
Efficient hedging tool.
High liquidity in major indices.
Cash settlement – no delivery hassle.
Lower cost compared to trading multiple individual stock options.
Good for expressing macro views.
Disadvantages:
Leverage magnifies losses.
Options can expire worthless.
Requires good understanding of pricing & volatility.
Market risks cannot be eliminated fully.
10. Risks & Challenges
Leverage Risk: Small move in index can wipe out margins.
Volatility Risk: Option buyers may lose premium if volatility drops.
Liquidity Risk: Smaller indices may have low volume.
Systemic Risk: Large index moves can create margin pressures across market.
11. Global Market Practices
US Markets: S&P 500 Futures & Options most traded globally (CME, CBOE).
India: Nifty 50, Bank Nifty dominate F&O segment (NSE).
Europe: FTSE, DAX index derivatives popular.
Asia: Nikkei 225, Hang Seng actively traded.
These instruments are also used by hedge funds, mutual funds, pension funds, and sovereign wealth funds to manage exposure.
12. Case Studies & Examples
2008 Financial Crisis:
Portfolio managers used index puts to hedge against market collapse.
Those without hedges faced catastrophic losses.
Indian Market Example:
During Budget announcements, traders use straddles/strangles on Nifty due to expected high volatility.
Global Funds:
US-based funds often use S&P 500 futures to hedge international equity exposure.
13. Conclusion
Index Futures & Options are powerful instruments that serve dual roles:
Risk Management (Hedging)
Profit Generation (Speculation & Arbitrage)
For institutions, they act as portfolio insurance. For traders, they provide opportunities to capitalize on short-term moves. However, they demand discipline, risk management, and understanding of market mechanics.
In a world where uncertainty is constant, index derivatives are no longer optional – they are essential for anyone engaged in serious investing or trading.
How Blockchain Could Create a Single Global Marketplace1. The Current Global Marketplace: Fragmented and Inefficient
Despite globalization, today’s international trade and commerce remain highly fragmented:
Multiple currencies → Every country has its own currency, requiring foreign exchange conversion, leading to costs, delays, and risks.
Intermediaries → Payment processors, banks, brokers, and logistics middlemen increase costs.
Trust issues → Buyers and sellers often don’t know each other, so they rely on third-party verification.
Inefficient supply chains → Tracking goods across borders is complex, slow, and prone to fraud.
Regulatory fragmentation → Every country enforces its own trade, tax, and compliance rules.
As a result, cross-border trade is expensive, slow, and sometimes inaccessible for small businesses or individuals. The dream of a truly globalized marketplace remains incomplete.
2. Blockchain’s Core Features and Why They Matter
Blockchain brings several unique features that directly solve the inefficiencies of global commerce:
Decentralization → No single authority controls the ledger, allowing peer-to-peer trade without middlemen.
Transparency → Transactions are visible and verifiable, reducing fraud.
Immutability → Once recorded, data cannot be tampered with, ensuring trust.
Smart contracts → Self-executing agreements automate business logic like payments or delivery confirmations.
Tokenization → Physical or digital assets can be represented as tokens, enabling easy trading.
Borderless payments → Cryptocurrencies and stablecoins allow instant cross-border value transfer.
Together, these features create the foundation for a single, borderless, digital-first marketplace.
3. Building Blocks of a Global Blockchain Marketplace
To understand how blockchain could unify the world economy, let’s break down the key pillars:
a) Universal Digital Currency
The first step is borderless payments. Cryptocurrencies like Bitcoin, Ethereum, and especially stablecoins pegged to fiat currencies already allow instant international transfers.
No need for currency exchange.
Settlement in seconds, not days.
Lower fees compared to SWIFT, Visa, or PayPal.
For example, a freelancer in India can receive payment from a U.S. client in USDT (a dollar-pegged stablecoin) instantly, bypassing banks and high remittance costs.
b) Tokenized Assets
Almost anything — from gold and real estate to art and stocks — can be represented as digital tokens on blockchain. Tokenization creates:
Fractional ownership → Anyone can buy a piece of expensive assets.
Liquidity → Assets can be traded globally without geographic restrictions.
Inclusivity → Small investors can access markets previously reserved for the wealthy.
This democratization of assets is crucial for a true global marketplace.
c) Smart Contracts for Automation
Smart contracts remove the need for trust between strangers. For example:
An exporter ships goods → smart contract releases payment automatically once delivery is confirmed.
A digital service provider delivers work → contract triggers instant payment.
This eliminates disputes, delays, and dependency on lawyers or courts.
d) Decentralized Marketplaces
Blockchain enables decentralized platforms where buyers and sellers connect directly. Examples include:
OpenBazaar (past experiment) → A peer-to-peer marketplace.
Uniswap & decentralized exchanges → Peer-to-peer asset trading.
NFT platforms → Direct artist-to-buyer transactions.
Such platforms reduce fees, censorship, and reliance on corporate intermediaries like Amazon or eBay.
4. Potential Benefits of a Single Global Blockchain Marketplace
1. Inclusivity and Financial Access
Currently, 1.4 billion people remain unbanked (World Bank data). Blockchain wallets give anyone with a smartphone access to global trade and finance.
2. Lower Costs
Cutting out intermediaries means cheaper remittances, payments, and trading. Cross-border remittance costs can drop from 7% to less than 1%.
3. Faster Transactions
International settlements that take days (via SWIFT) can be done in seconds.
4. Trust Without Middlemen
Blockchain’s transparency and immutability allow strangers across the globe to transact securely.
5. Global Liquidity and Market Access
Tokenization enables markets to operate 24/7, allowing capital and goods to move freely without geographic barriers.
6. Economic Empowerment
Small businesses, freelancers, and creators in emerging economies can access global customers directly, without dependence on banks or corporate platforms.
5. Real-World Use Cases
1. Cross-Border Payments
Companies like Ripple (XRP) and Stellar (XLM) are already enabling fast, cheap international transfers.
2. Supply Chain Management
IBM’s Food Trust blockchain allows tracking food from farm to supermarket, ensuring authenticity.
3. Decentralized Finance (DeFi)
Platforms like Aave or Compound let users lend/borrow globally without banks.
4. E-Commerce and Retail
Decentralized marketplaces allow direct buyer-seller trade. Imagine an Amazon alternative run on blockchain where sellers keep more profit.
5. NFTs and Creator Economy
Artists, musicians, and game developers can sell directly to global audiences using NFTs, bypassing labels or publishers.
6. Tokenized Real Estate
Platforms like Propy enable property sales on blockchain, making international real estate investments accessible.
6. The Role of Governments and Institutions
For a global blockchain marketplace to succeed, governments and institutions must play a role:
Global regulatory frameworks → To ensure safety while enabling innovation.
Central Bank Digital Currencies (CBDCs) → Countries like China, India, and the EU are developing CBDCs that could integrate with blockchain.
Public-private partnerships → Collaboration between regulators, banks, and blockchain firms to ensure trust.
Eventually, a hybrid system may emerge where CBDCs and decentralized platforms coexist, bridging traditional finance with blockchain.
7. Conclusion
Blockchain holds the potential to transform our fragmented, inefficient global economy into a single, unified marketplace where trade flows freely, securely, and inclusively. By combining borderless payments, tokenized assets, smart contracts, and decentralized platforms, blockchain eliminates the barriers of trust, geography, and cost.
Challenges remain — regulation, scalability, and adoption — but with growing institutional interest, technological improvements, and grassroots adoption, the path to a global blockchain-powered economy is clearer than ever.
The question is no longer “if”, but “when” blockchain will reshape the world economy. When that happens, trade will not just be global — it will be truly universal.
S&P500 | H1 Double Top | GTradingMethod👋 Hello traders,
Tried shorting a potential head and shoulders on the 1H chart earlier — it failed. Thankfully, one of my exit rules triggered before my stop loss, so the loss was small, but still not pleasant. That’s trading.
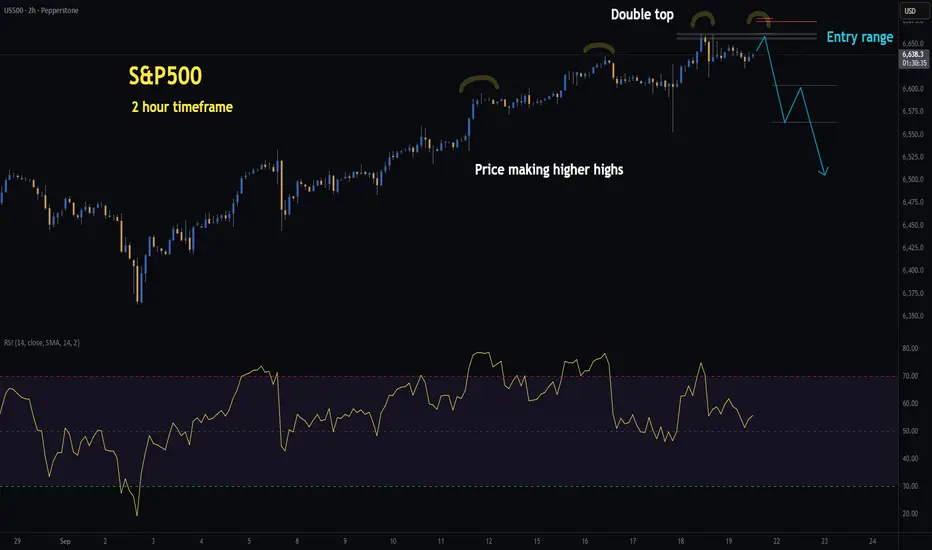
🧐 Market Overview:
The bigger picture remains the same. On the detailed side, I am looking for a potential double top on the hourly chart. RSI is making lower highs while price is making higher highs, which shows weakening buying momentum. For me, this is a non-negotiable variable when trading double tops and head & shoulders setups.
I’ll be waiting for a candle closure in my entry range, alongside a few more confirmations, before taking the next shot. Patience is key here.
📊 Trade Plan:
Risk/Reward: 3.4
Entry: 6 598.4
Stop Loss: 6 608.3
Take Profit 1 (50%): 6 567.9
Take Profit 2 (50%): 6 557.9
💡 GTradingMethod Tip:
Losses are part of the process. The key is to keep them small, stick to your rules, and wait for probability to play out over time.
🙏 Thanks for checking out my post!
Follow me to catch my next setup, and let me know — do you think this head and shoulders will confirm, or will buyers push the S&P to fresh highs?
📌 Disclaimer:
This is not financial advice. This content is to track my trading journey and for educational purposes only.

US500 | H2 Double Top | GTradingMethodHello Traders, I hope you’ve all had a profitable week!
🧐 Market overview:
The US500 has pushed into new highs since the FOMC and remains in an uptrend. However, price is advancing on weakening momentum — higher highs in price while RSI prints lower highs, a classic case of negative divergence. My system is flagging this as a potential double top setup on the 2H timeframe, but I am still waiting for confirmation before entering a short.
Interestingly, while my system highlights bearish risk, there are also bullish signals worth noting:
- Daily CMF money flow shows no negative divergence.
- Daily MACD remains on a buy signal.
- The recent rate cut adds further liquidity and stimulus to markets.
📊 My trade plan:
Risk/Reward: 3.6 – 4.5
Entry: 6,655.6 – 6,661.8
Stop Loss: 6,674.8 – 6,678.6
Take Profit 1 (50%): 6,604
Take Profit 2 (50%): 6,563
The entry and stop ranges vary depending on where the setup confirms within the zone.
Tip:
Divergences often act as early warning signs of trend exhaustion, but they work best when combined with pattern confirmation (like a double top) rather than traded in isolation.
🙏 Thanks for checking out my post!
Make sure to follow me to catch the next idea and keen to hear if you are trading the US500? :)
Please note: This is not financial advice. This content is to track my trading journey and for educational purposes only.
S&P 500 | H1 Rising Wedge | GTradingMethodHello Traders,
Similar to the Dow Jones setup, the US500 is also showing a rising wedge pattern. Yesterday, price broke to the downside and is now retesting the wedge — a classic technical setup.
📊 Trade Plan:
Risk/Reward: 5.4
Entry: 6 653.6
Stop Loss: 6 676.8
Take Profit: 6 526
🧐 Market Overview:
Rising wedges are typically bearish continuation/reversal patterns, and the current retest provides an opportunity to align with that probability. That said, wedges can fail, especially around major news events, so risk management is key specially with markets being bullish after the fomc announcement.
💡 GTradingMethod Tip:
When trading wedge retests, always allow the market to confirm direction. A strong rejection on the retest adds confluence and avoids false breakouts.
🙏 Thanks for checking out my post!
Make sure to follow me to catch the next idea and please share your thoughts — I’d love to hear them.
📌 Please note:
This is not financial advice. This content is to track my trading journey and for educational purposes only.

My top wave count alt 6681/6712I have moved back into puts for 2027 rather deep in the money As we are now up almost 24 to 26 weeks in this rally .The PUT to call ratio is now into level I see as mind blowing on 5 10 and now 20 day . and also have three bearish Divergences from Rsi to two of my private models .I have a major turn once again based on the Spirals 2/19 top and 4/7 low they are due near the end of next week . I am now 95 % in Puts and will move to 115% next week based on the dates or is the sp cash can rally to 6709 next week Best of trades WAVETIMER
Why K-Line Is a Game-ChangerThis 🎰live-kline-signals might just be the greatest invention in financial trading ever … mark my words. 🚀
Here’s why:
• Traditional TA & charting tools give you visuals 📊 — moving averages, RSI, patterns — but they don’t learn. They just show you what already happened.
• Pure AI/LLM models give you intelligence 🧠 — they process billions of data points and detect hidden structures — but they don’t show you the exact price path.
• K-Line 🎰kline-signal combines the best of both worlds 🤩 — visual price paths and deep AI-powered learning of candlestick dynamics.
That means you get a real-time market map that both looks like a chart AND thinks like an AI model.
⸻
🎯 Why This Matters for Traders
• You’re no longer stuck choosing between lagging TA indicators or black-box AI outputs.
• You get early warning signals before big moves, with the ability to see where the market is shifting.
• Trading becomes less guesswork, more probabilistic edge.
⸻
🔑 How QS Uses It
We built QS K-Line on top of TSFM ( time series foundation model ) trained on billions candlestick records across global markets.
With our quant overlays, K-Line in QS detects:
✅ Transition zones (when range is about to break)
✅ Accumulation vs. distribution phases
✅ Trend ignition points
In other words, K-Line shows you the story of price evolution — before it becomes obvious to the crowd.
⸻
📌 Bottom line: Charts without intelligence are outdated. AI without charts is incomplete.
With QS K-Line 🎰live-kline-signals we just unlocked both. 💰upgrade-instructions now to unlock this powerful trading oracle.
🔥 The future of trading is here.
Inflation, Interest Rates & Global Trade CostsPart 1: Understanding Inflation
What is Inflation?
Inflation is simply the rate at which the general level of prices for goods and services rises over time. When inflation is high, money loses value—what you could buy last year for $100 may now cost $110.
Economists track inflation using indicators like the Consumer Price Index (CPI) or Wholesale Price Index (WPI). While some inflation is normal (a sign of healthy demand), too much or too little can destabilize economies.
Mild inflation (2–3% per year) usually means an economy is growing steadily.
High inflation (above 6–7%) erodes purchasing power, increases uncertainty, and hurts savings.
Hyperinflation (triple digits annually, like Zimbabwe or Venezuela at times) destroys entire economies.
Deflation (falling prices) may sound good, but it discourages spending and investment, leading to recessions.
Causes of Inflation
Demand-Pull Inflation – When demand for goods exceeds supply, prices go up. Example: During post-pandemic recovery, pent-up demand pushed prices higher globally.
Cost-Push Inflation – When production costs rise (raw materials, wages, fuel), producers pass costs to consumers. Example: Oil price spikes increase transportation and manufacturing costs worldwide.
Imported Inflation – When the cost of imported goods rises due to weaker currency or higher global prices.
Monetary Inflation – When central banks print too much money or keep interest rates artificially low, flooding the economy with liquidity.
Why Inflation Matters Globally
Inflation does not stay within borders. Higher energy prices in one country push up manufacturing costs worldwide. Food shortages in one region can cause global ripple effects. For example, the Russia-Ukraine war disrupted grain exports, leading to food inflation across Africa and Asia.
Part 2: Interest Rates
What are Interest Rates?
Interest rates represent the cost of borrowing money. Central banks (like the U.S. Federal Reserve, European Central Bank, or Reserve Bank of India) set benchmark rates that influence lending across the economy.
When central banks change rates, they are essentially trying to control inflation and economic growth.
Low interest rates encourage borrowing and spending but can fuel inflation.
High interest rates slow down borrowing, reduce spending, and cool inflation—but they also risk slowing growth too much.
The Inflation–Interest Rate Link
Central banks use interest rates as their main weapon against inflation. If prices are rising too fast, raising rates makes loans costlier, which reduces consumer demand and investment, eventually bringing inflation down.
For example, in 2022–23, the U.S. Federal Reserve aggressively hiked interest rates from near 0% to above 5% to fight the worst inflation in 40 years. That made mortgages, car loans, and corporate borrowing more expensive, slowing down demand.
Interest Rates & Global Trade
Interest rates do not just affect domestic economies—they also influence global trade and capital flows:
Currency Strength – Higher interest rates attract foreign investment, strengthening the domestic currency. A stronger dollar, for example, makes U.S. exports more expensive but imports cheaper.
Capital Flows – Investors chase higher yields. If U.S. rates rise, money flows into American bonds and stocks, draining liquidity from emerging markets.
Debt Burden – Many developing countries borrow in dollars. When U.S. rates rise, their repayment burden grows, sometimes leading to crises.
Part 3: Global Trade Costs
What are Trade Costs?
Global trade costs include everything that makes cross-border trade expensive or complicated:
Transportation Costs – Shipping freight, air cargo, fuel charges.
Tariffs & Trade Barriers – Import duties, customs delays, paperwork.
Supply Chain Costs – Warehousing, inventory, distribution networks.
Currency Fluctuations – Exchange rate risks add hidden costs to contracts.
Key Drivers of Trade Costs
Energy Prices – Oil and gas prices directly affect shipping costs. For example, a spike in crude oil prices can double container freight charges.
Geopolitical Tensions – Wars, sanctions, and tariffs increase uncertainty and add barriers to trade.
Infrastructure Bottlenecks – Port congestion, lack of modern rail/road links, or limited storage facilities make trade inefficient.
Technology & Automation – Digital tools (blockchain, AI logistics, tracking systems) can lower costs by reducing inefficiencies.
Regulatory Complexity – Each country’s rules on safety, quality, and documentation increase time and cost.
Recent Shocks to Global Trade Costs
COVID-19 Pandemic – Container shortages, factory shutdowns, and port delays caused shipping costs to multiply five-fold.
Russia–Ukraine War – Energy price shocks and rerouted shipping lanes raised logistics costs.
Climate Change & Canal Blockages – Events like the Suez Canal blockage (2021) disrupted $9 billion worth of daily trade.
Part 4: The Interconnection
Here’s where it all ties together:
Inflation & Trade Costs
Higher trade costs (fuel, shipping, tariffs) push prices up globally, fueling inflation.
Inflation in turn raises production costs, which feeds back into higher global trade prices.
Interest Rates & Inflation
Central banks raise rates to fight inflation.
But higher rates increase borrowing costs for shipping companies, exporters, and importers, raising global trade costs indirectly.
Interest Rates & Trade Costs
Higher rates strengthen currencies, making imports cheaper but exports less competitive.
Developing nations with heavy external debt see rising repayment burdens when rates go up, making global trade riskier.
A Cycle in Motion
Rising oil prices → higher shipping costs → global inflation.
Global inflation → central banks raise interest rates.
Higher interest rates → stronger currencies, weaker exports.
Weaker exports → trade slows down, but debt burdens grow.
This cycle shows how tightly linked these forces are, making global economic management extremely tricky.
Part 5: Case Studies
Case Study 1: U.S. Federal Reserve & Global Trade (2022–23)
When the Fed hiked rates rapidly to curb inflation, emerging markets like Turkey, Argentina, and India faced capital outflows and currency depreciation. Their import bills rose, worsening inflation. Shipping companies faced higher borrowing costs, raising freight charges.
Case Study 2: Oil Price Spike & Global Inflation (1970s & 2020s)
In the 1970s, OPEC’s oil embargo quadrupled oil prices, fueling global inflation and recession. In 2021–22, post-pandemic recovery plus the Russia-Ukraine war caused similar oil and gas price spikes, driving up both inflation and trade costs.
Case Study 3: Pandemic & Supply Chains
COVID-19 shutdowns raised container shipping costs from $2,000 per container in 2019 to nearly $20,000 in 2021. This directly drove inflation in consumer goods worldwide.
Part 6: The Future Outlook
Trends to Watch
De-Dollarization – If global trade shifts away from the U.S. dollar, interest rate cycles in the U.S. may have less influence globally, though this will take time.
Green Energy Transition – As shipping and manufacturing shift to renewable energy, volatility from oil price shocks may reduce, lowering trade costs in the long run.
Technology in Logistics – AI, blockchain, and real-time data tracking can significantly reduce global trade costs.
Fragmentation of Supply Chains – “Friendshoring” and regional trade blocs may reduce dependence on global shipping but increase localized inflation risks.
Climate Risks – Extreme weather, rising sea levels, and canal disruptions will continue to add volatility to trade costs.
Policy Challenges
Balancing Inflation & Growth – Central banks must avoid over-tightening, which risks recession.
Global Coordination – Inflation, interest rates, and trade costs are global phenomena; yet policies are mostly national. Lack of coordination worsens shocks.
Debt Sustainability – Rising global interest rates put developing nations at risk of debt crises, which can collapse trade flows.
Conclusion
Inflation, interest rates, and global trade costs are not isolated variables. They form a complex, interconnected system that shapes the global economy. Inflation eats away at purchasing power, central banks fight it with interest rates, and those rate changes ripple through currencies, trade, and debt. Meanwhile, trade costs—driven by energy, geopolitics, and supply chains—feed into inflation, creating a feedback loop.
For businesses, policymakers, and traders, understanding this triangle is essential. A shipping delay in Asia can fuel inflation in Europe. An interest rate hike in the U.S. can trigger capital flight from Africa. And an oil shock in the Middle East can raise costs across the globe.
In the 21st century, with economies so deeply interconnected, no country can ignore the dance between inflation, interest rates, and global trade costs. Managing this delicate balance will determine whether the world enjoys steady growth—or faces repeated cycles of crisis.

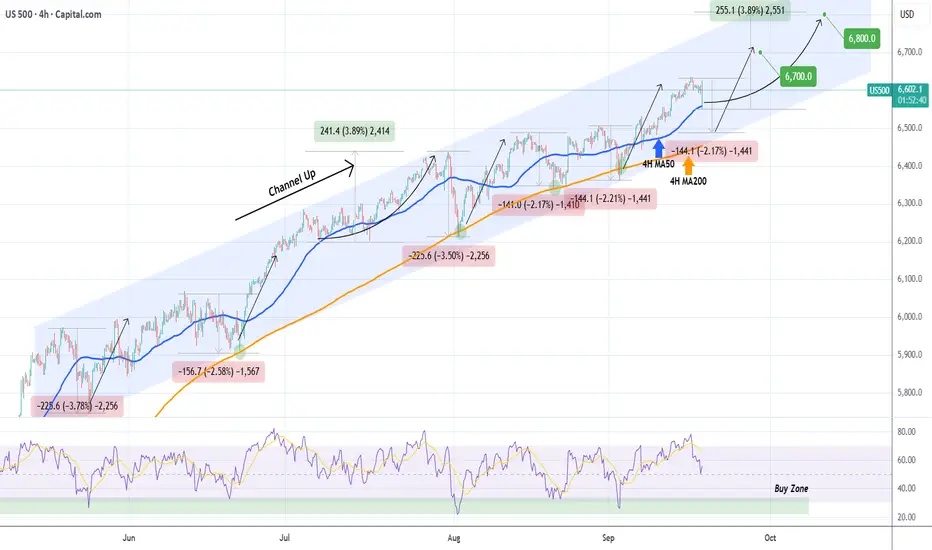
S&P500 Risks drop to the 4H MA200 if MA50 fails.The S&P500 index (SPX) is experiencing a strong intra-day correction that just hit its 4H MA50 (blue trend-line) for the first time since September 05. As long as this holds, we expect a gradual rise, targeting 6800 (representing a +3.89% increase similar to July's).
A 1D candle closing below the 4H MA50 however, has historically paved the way to more selling within the 4-month Channel Up, that touched the 4H MA200 (orange trend-line) before rebounding. If that candle closing takes place, we will close the 4H MA50 buy on minimum loss and buy on the 4H MA200, targeting 6700 (sharp rebound similar to all 4H MA200 bounces).
Keep also an eye on the 4H RSI Buy Zone. It has given the 5 most optimal buy entries during these 4 months. Note also that the 4H MA200 has been holding as Support since the April 25 break-out.
-------------------------------------------------------------------------------
** Please LIKE 👍, FOLLOW ✅, SHARE 🙌 and COMMENT ✍ if you enjoy this idea! Also share your ideas and charts in the comments section below! This is best way to keep it relevant, support us, keep the content here free and allow the idea to reach as many people as possible. **
-------------------------------------------------------------------------------
💸💸💸💸💸💸
👇 👇 👇 👇 👇 👇
WARNING S&P 500, upper bound of bullish channel reached!Is the US stock market in a speculative bubble? Is the S&P 500 index and the S&P 500 futures contract approaching a major market top as the Fed’s new monetary trajectory has sustained the bullish move initiated last April?
This question is on investors’ minds as they ride the bullish trend in place for many months, and logically, one must be on the lookout for technical exhaustion signals to protect invested capital.
We will answer this question using technical analysis of financial markets with chartist and quantitative aspects.
1. Warning: the S&P 500 index and futures have reached the upper bound of their long-term bullish channel, but no bearish divergence yet
In technical analysis, several combined factors are needed to anticipate a major market top. The combination of a major technical resistance with a price/momentum bearish divergence is particularly effective.
The chart below shows the weekly candlesticks of the S&P 500 index: after rebounding in early April at the lower bound of its long-term bullish channel, the index has now reached the upper bound at 6700 points.
However, there is currently no price/momentum bearish divergence. Nevertheless, the strong technical resistance at 6700 could trigger profit-taking.
2. The Russell 2000 index, US small caps, has reached its all-time high from late 2021
In the short term, the Russell 2000 could also pause as it is testing its record high, but this resistance may be broken this autumn thanks to the Fed’s monetary pivot.
The chart below shows the weekly candlesticks of the Russell 2000 index.
3. From a quantitative perspective, S&P 500 stocks are not yet in an extreme overheating zone
Thus, 6700 points represent major resistance for the S&P 500, which could enter a short-term consolidation phase. However, the long-term bullish trend does not seem threatened, since the market is not in an extreme overheating zone from a quantitative perspective, as shown below by the percentage of S&P 500 stocks above the 50-day simple moving average.
DISCLAIMER:
This content is intended for individuals who are familiar with financial markets and instruments and is for information purposes only. The presented idea (including market commentary, market data and observations) is not a work product of any research department of Swissquote or its affiliates. This material is intended to highlight market action and does not constitute investment, legal or tax advice. If you are a retail investor or lack experience in trading complex financial products, it is advisable to seek professional advice from licensed advisor before making any financial decisions.
This content is not intended to manipulate the market or encourage any specific financial behavior.
Swissquote makes no representation or warranty as to the quality, completeness, accuracy, comprehensiveness or non-infringement of such content. The views expressed are those of the consultant and are provided for educational purposes only. Any information provided relating to a product or market should not be construed as recommending an investment strategy or transaction. Past performance is not a guarantee of future results.
Swissquote and its employees and representatives shall in no event be held liable for any damages or losses arising directly or indirectly from decisions made on the basis of this content.
The use of any third-party brands or trademarks is for information only and does not imply endorsement by Swissquote, or that the trademark owner has authorised Swissquote to promote its products or services.
Swissquote is the marketing brand for the activities of Swissquote Bank Ltd (Switzerland) regulated by FINMA, Swissquote Capital Markets Limited regulated by CySEC (Cyprus), Swissquote Bank Europe SA (Luxembourg) regulated by the CSSF, Swissquote Ltd (UK) regulated by the FCA, Swissquote Financial Services (Malta) Ltd regulated by the Malta Financial Services Authority, Swissquote MEA Ltd. (UAE) regulated by the Dubai Financial Services Authority, Swissquote Pte Ltd (Singapore) regulated by the Monetary Authority of Singapore, Swissquote Asia Limited (Hong Kong) licensed by the Hong Kong Securities and Futures Commission (SFC) and Swissquote South Africa (Pty) Ltd supervised by the FSCA.
Products and services of Swissquote are only intended for those permitted to receive them under local law.
All investments carry a degree of risk. The risk of loss in trading or holding financial instruments can be substantial. The value of financial instruments, including but not limited to stocks, bonds, cryptocurrencies, and other assets, can fluctuate both upwards and downwards. There is a significant risk of financial loss when buying, selling, holding, staking, or investing in these instruments. SQBE makes no recommendations regarding any specific investment, transaction, or the use of any particular investment strategy.
CFDs are complex instruments and come with a high risk of losing money rapidly due to leverage. The vast majority of retail client accounts suffer capital losses when trading in CFDs. You should consider whether you understand how CFDs work and whether you can afford to take the high risk of losing your money.
Digital Assets are unregulated in most countries and consumer protection rules may not apply. As highly volatile speculative investments, Digital Assets are not suitable for investors without a high-risk tolerance. Make sure you understand each Digital Asset before you trade.
Cryptocurrencies are not considered legal tender in some jurisdictions and are subject to regulatory uncertainties.
The use of Internet-based systems can involve high risks, including, but not limited to, fraud, cyber-attacks, network and communication failures, as well as identity theft and phishing attacks related to crypto-assets.
