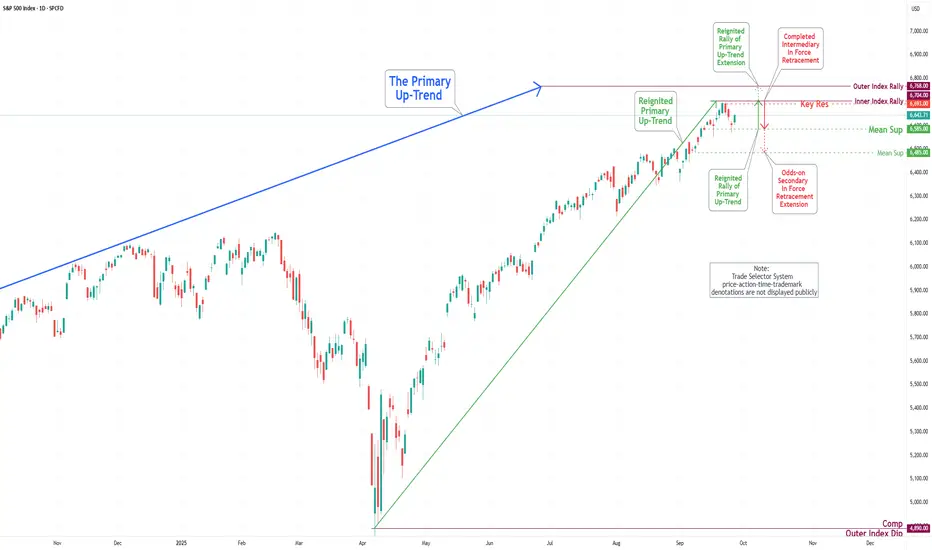
S&P 500 Daily Chart Analysis For Week of Sep 26, 2025Technical Analysis and Outlook:
During the aforementioned week's trading session, the S&P 500 Index experienced a notable decline after reversing near the Inner Index Rally level of 6704, which resulted in a vigorous drop to our designated Mean Support target of 6585. The index is currently moving towards the established Key Resistance target of 6693 and is positioned to fully complete the Inner Index Rally at 6704, presenting the potential for additional upward momentum that could extend to the Outer Index Rally level of 6768.
It is imperative to recognize, however, that upon reaching the Key Resistance target of 6693 and the Inner Index Rally at 6704 targets, we may observe a retest pullback toward the Mean Support level of 6585, with the possibility of a further decline extending to the Mean Support target at 6485.
Trade ideas
SP500 4H🔹 Overall Outlook and Potential Price Movements
In the charts above, we have outlined the overall outlook and possible price movement paths.
As shown, each analysis highlights a key support or resistance zone near the current market price. The market’s reaction to these zones — whether a breakout or rejection — will likely determine the next direction of the price toward the specified levels.
⚠️ Important Note:
The purpose of these trading perspectives is to identify key upcoming price levels and assess potential market reactions. The provided analyses are not trading signals in any way.
✅ Recommendation for Use:
To make effective use of these analyses, it is advised to manually draw the marked zones on your chart. Then, on the 15-minute time frame, monitor the candlestick behavior and look for valid entry triggers before making any trading decisions.

US500 Post PCE OutlookThe short term outlook for the US 500 remains constructively bullish, with a bias towards further upside. The primary factor supporting this view is the recent in line Core PCE data 2.9% YoY, which matched expectations. This result has successfully alleviated fears of a more aggressive US Fed tightening path. The market interprets this steady inflation reading as giving the Fed "room to be patient" with future rate adjustments, thereby sustaining appetite for equities which are seen as risk assets. While the path forward may be choppy with volatility contained around current levels the overall momentum is positive and measured. Critical upcoming catalysts that could drive the next major move include future inflation prints, jobs data, and the start of the Q3 earnings season.
Fundamental Analysis
The market's resilience is built upon several key fundamental pillars:
Inflation Stability: The August Core PCE Index meeting expectations is the most significant fundamental driver, reducing the immediate risk of a growth stifling, aggressive Fed policy shift.
Corporate Strength: Underlying support continues to come from robust corporate earnings and sustained strong consumer spending. These elements suggest that the corporate sector can maintain profit growth even in the current economic environment.
Fed Clarity: Clear communication from the Fed regarding its path has reduced policy uncertainty, which generally supports higher equity valuations.
Sector Dynamics: There is evidence of defensive flows and sector rotation, indicating that investors are positioning for sustained but selective growth within the US economy, favoring both large caps and defensives in a measured approach.
Technical Analysis
The technical picture supports a consolidation phase near record highs, with momentum favoring a potential future breakout:
Resistance: The first resistance zone is identified between 6,675 and 6,700. A decisive, sustained break above this level would signal the next major rally attempt.
Support: Immediate support lies in the 6,605 - 6,570 zone. Maintaining price action above this band is crucial for keeping the constructive, short-term bullish trend intact.
Volatility: Volatility remains contained, reflecting the market's stability and lack of panic following the inflation data. Monitor technical indicators for overbought signals that might precede a pause or consolidation, but the sentiment remains constructive as long as key macroeconomic data remains steady.
Analysis by Terence Hove, Senior Financial Market Strategist at Exness

S&P500 CHART UPDATE !!S&P 500 Analysis
The S&P 500 is trading near 6,650, moving strongly within its ascending channel.
Support: 6,400 – key level to hold for bullish momentum.
Resistance: 6,800 – a breakout could open the door toward 7,200.
The trend remains bullish, and staying above the midline keeps upside potential intact.
A breakdown below 6,400 may signal a short-term correction.

Famous Forex Traders and Their Journeys1. George Soros: The Man Who Broke the Bank of England
George Soros, born in 1930 in Budapest, Hungary, is arguably the most famous forex trader of all time. His journey from a refugee escaping Nazi-occupied Hungary to a billionaire financier is a story of resilience, intelligence, and audacious trading. Soros studied at the London School of Economics under the tutelage of philosopher Karl Popper, whose concept of “reflexivity” would later underpin much of Soros’ trading strategy.
Soros’ approach to forex trading was revolutionary. He believed markets are not always rational, and that human behavior could create trends and anomalies that could be exploited. This philosophy reached its pinnacle on September 16, 1992, known as Black Wednesday, when Soros famously “broke the Bank of England.” Anticipating that the British pound was overvalued and that the UK government would not be able to maintain its currency within the European Exchange Rate Mechanism, Soros shorted $10 billion worth of pounds. When the pound crashed, he reportedly made over $1 billion in profit in a single day.
Soros’ journey teaches traders the power of conviction and risk management. His success was not a product of luck; it was the result of meticulous analysis, understanding macroeconomic fundamentals, and having the courage to act decisively against prevailing market sentiment.
2. Stanley Druckenmiller: The Strategist Behind Soros
Stanley Druckenmiller, often described as one of the greatest traders of the 20th century, was Soros’ right-hand man during the Black Wednesday trade. Born in Pittsburgh in 1953, Druckenmiller’ journey into finance began with studying English and economics before diving into the world of investments.
Druckenmiller’ trading style emphasizes trend-following combined with macroeconomic insights. He often stresses that understanding the “big picture” — interest rates, fiscal policies, and global economic cycles — is key to successful trading. During his tenure at Quantum Fund, he achieved phenomenal returns, often averaging 30% annual returns over decades, a feat almost unheard of in any financial market.
What distinguishes Druckenmiller is his disciplined risk management. He believed in cutting losses quickly and letting winners run — a principle that resonates deeply with forex traders. His journey demonstrates that even within the high-risk world of forex, strategic planning and emotional discipline are essential.
3. Bill Lipschutz: The Currency King
Bill Lipschutz, born in 1956 in New York, is a name synonymous with currency trading. Unlike Soros or Druckenmiller, Lipschutz’ entry into trading was accidental. While studying at Cornell University, he inherited a modest sum and began trading stocks. However, after a significant loss early in his career, he realized that understanding the market psychology was as important as understanding the numbers.
Lipschutz transitioned to forex trading in the 1980s at Salomon Brothers, where he earned the nickname “The Sultan of Currencies.” His approach revolved around market sentiment and positioning, rather than purely technical or fundamental analysis. He emphasized that traders must understand not just the currency, but the forces driving central banks, governments, and large institutional players.
One of his key insights was the importance of risk perception versus actual risk. By controlling his exposure and understanding when markets overreacted, Lipschutz was able to generate consistent profits, making him one of the most respected forex traders globally. His journey illustrates that resilience after setbacks and continuous learning are vital for long-term success.
4. Andrew Krieger: The Aggressive Risk Taker
Andrew Krieger, born in 1956 in New Zealand, gained fame in the late 1980s for his aggressive and highly leveraged forex trades. Krieger worked at Bankers Trust, where he became notorious for his bold positions, particularly his massive short on the New Zealand dollar, known as the “Kiwi.”
In 1987, Krieger identified that the New Zealand dollar was overvalued relative to the U.S. dollar. Exploiting leverage far beyond the bank’s capital, he took positions worth hundreds of millions of dollars, which led to enormous profits when the currency depreciated. His ability to analyze macro trends and exploit market inefficiencies allowed him to achieve results that many considered impossible.
Krieger’s story is both inspirational and cautionary. While it demonstrates the potential of forex trading to generate huge profits, it also underscores the immense risks of leverage. Modern traders can learn from his audacity but must balance it with strict risk controls.
5. Paul Tudor Jones: The Master of Macro
Paul Tudor Jones, born in 1954 in Memphis, Tennessee, is renowned for his macro trading expertise, including currency markets. His career began after graduating from the University of Virginia, when he launched his own trading firm, Tudor Investment Corporation, in 1980.
Jones’ fame skyrocketed when he correctly predicted and profited from the 1987 stock market crash. While primarily an equity trader, Jones’ strategies often involve currencies, particularly in the context of macroeconomic shifts. His trading philosophy blends technical analysis, historical patterns, and market psychology, emphasizing flexibility and adaptability.
He is a strong advocate of risk management, famously stating, “The most important rule of trading is to play great defense, not great offense.” This principle applies directly to forex, where volatility can be extreme, and losses can compound quickly. Jones’ journey highlights the need to combine strategy with discipline to thrive in global markets.
6. Richard Dennis and the Turtle Traders
Richard Dennis, born in 1949 in Chicago, was a commodities and forex trader famous for the “Turtle Traders” experiment. Dennis believed that trading could be taught systematically and sought to prove this by training novices in his rules-based approach.
The Turtle Traders, under Dennis’ guidance, followed strict mechanical systems to trade currencies and commodities. The results were extraordinary: many of his students went on to become successful traders, demonstrating that disciplined, rules-based trading could outperform intuition alone.
Dennis’ legacy emphasizes that forex success is not only about intelligence but about discipline, rules, and psychological resilience. His journey underscores the importance of methodology and consistency in trading.
7. Kathy Lien: The Modern Forex Strategist
Kathy Lien, born in 1978 in New York, represents a modern generation of forex traders. With a PhD in international economics, Lien has leveraged her academic background to become a leading currency strategist and author.
Lien’ career spans trading at major banks such as JP Morgan and FXCM, where she honed her skills in both fundamental and technical analysis. She is renowned for translating complex market data into actionable trading strategies, particularly for retail traders.
Her philosophy focuses on risk-adjusted trading, macroeconomic insights, and disciplined execution. Lien also emphasizes the importance of continual learning and adapting to market changes — crucial in today’s fast-evolving forex landscape. Her journey inspires traders, especially women, to pursue excellence in a male-dominated field.
8. Lessons from Famous Forex Traders
Examining the journeys of these iconic traders reveals common threads that aspiring forex traders can emulate:
Risk Management is Paramount: Every successful trader prioritizes controlling losses over chasing profits.
Market Psychology Matters: Understanding human behavior in markets is as critical as analyzing charts or economic indicators.
Adaptability and Flexibility: Markets change, and strategies must evolve.
Discipline Over Intuition: Mechanical systems, rules, and structured approaches often outperform gut feelings.
Continuous Learning: Even legendary traders constantly refine their methods and knowledge.
Boldness Balanced with Strategy: High conviction trades yield high rewards, but reckless risk-taking can be catastrophic.
9. Conclusion
The journeys of famous forex traders illustrate that success in the currency markets is a blend of intellect, discipline, risk management, and psychological resilience. From Soros’ historic pound short to Lien’s modern strategies, each trader exemplifies unique paths and philosophies. Their stories serve as both inspiration and practical guidance for anyone seeking to navigate the complexities of the forex market.
Forex trading is not merely a pursuit of wealth; it is a test of strategy, patience, and mental fortitude. By studying the journeys of these iconic figures, traders can learn that success is rarely accidental — it is crafted through rigorous analysis, unwavering discipline, and a willingness to learn from every win and loss.

Currency as a Tool of Power1. Historical Roots: Currency as Sovereignty
Currency has always carried political symbolism. Ancient kingdoms used coins not only as units of trade but also as markers of authority. The image of a ruler on a coin reinforced legitimacy and sovereignty. The Roman denarius, stamped with the Emperor’s profile, became a sign of imperial unity across vast territories.
The Chinese dynasties pioneered paper currency as early as the Tang and Song periods. This innovation extended state power by standardizing economic exchange across provinces. Similarly, medieval Europe saw kingdoms fight wars not just with armies but also by debasement of coinage—reducing precious metal content to finance conflicts while eroding rivals’ trust.
Thus, from the beginning, currency was about more than economics—it was about political stability and dominance. Control over minting and distribution meant control over trade routes, taxation, and governance.
2. Currency and Empire: Financial Foundations of Power
Empires rose and fell on their ability to control currency. During the Age of Exploration, Spain and Portugal amassed silver and gold from the New World, fueling European dominance. Yet, overreliance on bullion caused inflation (the so-called “Price Revolution”) and weakened Spanish hegemony.
By contrast, the British Empire leveraged financial sophistication. London’s banking system, supported by the pound sterling, became the backbone of international trade in the 19th century. The empire’s naval dominance was matched by financial dominance: colonies used sterling, and global contracts were denominated in British currency.
This marked the evolution of a reserve currency system, where the strength of a currency allowed an empire to project influence far beyond its borders.
3. The U.S. Dollar: Modern Currency Hegemony
After World War II, the Bretton Woods Agreement (1944) established the U.S. dollar as the anchor of the global financial system. Currencies were pegged to the dollar, which itself was backed by gold at $35/ounce. Even after the U.S. abandoned the gold standard in 1971, the dollar retained its dominance due to trust in American financial markets, political stability, and military power.
The dollar became not just a currency but a global standard:
Trade Dominance: Most international commodities—oil, gas, metals—are priced in dollars (“petrodollar” system).
Financial Institutions: IMF and World Bank largely operate on dollar reserves.
Investment Flows: Global investors see U.S. Treasury bonds as the safest assets.
This dominance gave the U.S. extraordinary power: it could print currency to fund deficits, influence global liquidity, and impose sanctions by restricting dollar-based transactions.
4. Currency as Economic Weapon: Sanctions and Restrictions
Currency can be directly weaponized. In modern geopolitics, restricting access to currency flows is as potent as military intervention.
SWIFT System Control: The U.S. and EU can cut off nations from the international payment network, crippling trade.
Iran Example: When sanctions limited Iran’s access to the dollar system, its economy shrank drastically despite having vast oil reserves.
Russia (2022): Western nations froze Russia’s foreign exchange reserves and limited its ability to transact in dollars/euros, undermining financial stability.
Currency control enables “bloodless warfare”—crippling economies without direct conflict. It demonstrates how financial architecture is as much a battlefield as physical territory.
5. Currency and Global Trade Imbalances
A strong or weak currency shapes trade flows, giving nations leverage:
China’s Strategy: By managing the yuan’s exchange rate, China boosts exports while building vast dollar reserves.
U.S. Deficit Power: The U.S. can sustain trade deficits because its currency is the world’s reserve, allowing it to pay for imports with paper rather than real goods.
Currency Wars: Countries engage in competitive devaluations to make exports cheaper, leading to tensions and instability.
Thus, exchange rates are not just technical matters but instruments of industrial strategy and geopolitical rivalry.
6. Reserve Currencies and Trust as Power
For a currency to wield global power, it must be trusted. Trust depends on:
Economic Stability: Strong GDP, low inflation, predictable policies.
Financial Markets: Deep, liquid markets that allow global investors to park capital.
Military Backing: The ability to enforce international order.
The euro, launched in 1999, was designed to rival the dollar, but its influence remains limited due to political fragmentation. The Japanese yen and British pound play regional roles but lack global dominance.
China’s yuan (renminbi) is increasingly used in trade, especially with developing nations, but strict capital controls limit its reach. Still, initiatives like the Belt and Road and the creation of the Asian Infrastructure Investment Bank (AIIB) suggest Beijing’s intent to expand yuan influence.
7. Currency as Cultural and Psychological Power
Currency also carries symbolic weight. People worldwide recognize the U.S. dollar as a store of value, often hoarding it in unstable economies (e.g., Argentina, Zimbabwe). In such cases, the dollar acts as an alternative government, providing psychological stability when local systems fail.
Tourists, businesses, and migrants all rely on dominant currencies, reinforcing their prestige and soft power. A strong, trusted currency enhances national identity and global appeal.
8. Digital Currencies: The New Frontier of Power
The 21st century has introduced a new battlefield: digital and decentralized currencies.
Cryptocurrencies like Bitcoin challenge state monopoly over money. They are borderless, resistant to censorship, and appealing in nations with weak currencies. However, volatility limits their mainstream role.
Central Bank Digital Currencies (CBDCs) represent the state’s countermeasure. China’s digital yuan is the most advanced, aiming to bypass the dollar system and enhance domestic surveillance.
U.S. and EU are exploring CBDCs cautiously, aware that digital currency could reshape financial flows, privacy, and power distribution.
If widely adopted, digital currencies could redefine currency as a tool of power, shifting influence from states to either tech platforms or transnational coalitions.
9. Currency and the Future Multipolar World
The 20th century was marked by unipolar dominance of the U.S. dollar. The 21st may become more multipolar, with multiple reserve currencies coexisting: dollar, euro, yuan, and possibly digital currencies.
Key trends shaping the future:
De-dollarization: Countries like Russia, China, and Middle Eastern powers are reducing reliance on the dollar.
Commodity-Backed Trade: Proposals for oil or gold-backed trade currencies.
Regional Blocs: African and Latin American nations considering shared currencies to reduce dependency.
Technological Shifts: Blockchain, digital wallets, and cross-border payment systems eroding U.S. control.
In this scenario, currency will continue to be a battlefield for influence, independence, and survival.
10. Ethical and Social Dimensions of Currency Power
Currency dominance is not neutral—it comes with consequences:
Dependency: Developing nations tied to foreign currencies lose policy autonomy.
Inequality: Global south often pays the price of financial crises originating in the global north.
Exploitation: Control over currency systems allows powerful nations to extract value from weaker economies.
Thus, the debate around currency power is also a debate about justice, sovereignty, and fairness in global finance.
Conclusion: The Eternal Struggle for Monetary Power
Currency is more than money—it is a weapon, a shield, and a stage for power struggles. From the Roman denarius to the British pound, from the U.S. dollar to the digital yuan, nations have used currency to expand influence, enforce dominance, and reshape the world order.
In the future, battles over currency will not only determine economic prosperity but also geopolitical survival. Whoever controls the dominant currency controls the rules of global trade, investment, and even war.
The story of currency as a tool of power is not over. It is evolving—toward a world where trust, technology, and multipolar rivalry will decide whose money rules the global stage.
Pullback long - H4Trend is bullish -> looking for long setup
We had a pullback to the EMA support
Trendline has been broken
Entry: breakout candle
Stop: low of the breakout candle

S&P 500 Wave Analysis – 26 September 2025
- &P 500 index reversed from support level 6600.00
- Likely to rise to resistance level 6700.00
S&P 500 index recently reversed up from the key support level 6600.00 (which also reversed the index in the middle of September) coinciding with the 20-day moving average and the 38.2% Fibonacci correction of the upward impulse from last month.
The upward reversal from the support level 6600.00 continues the active short-term impulse wave 3 of the intermediate impulse wave (5) from the start of August.
Given the strong daily uptrend, S&P 500 index can be expected to rise further to the next resistance level 6700.00 (which reversed the price earlier this month).

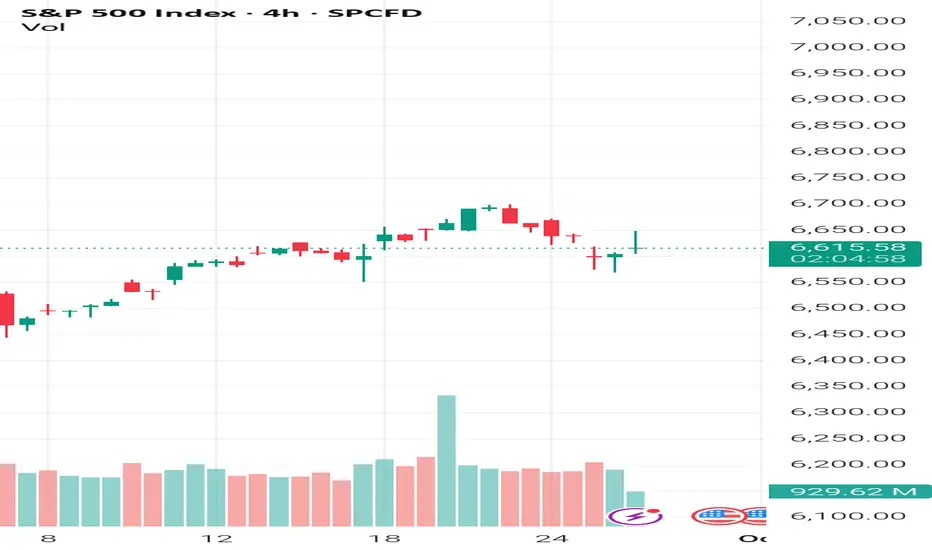
S&P 500 needs a correctionLooking at the volume, we see that the price is rising but the volume is declining in line with it. This indicates a high probability of a correction, in my view. Short the S&P 500 to 6146, where I expect at least an attempt to form a new bottom. Let the bears do their thing; an update will follow.
⚠️ Not financial advice.

Post PCE thoughts.PCE data in line with expectations, personal income and spending slightly up, all in all, when I saw the data, I felt it would potentially be good for the S&P and also the USD. But both the S&P and the USD are nonplussed.
The GBP has positive momentum, but it's not something I can hang my hat on while the rest of the currencies are behaving incoherently. All in all, i'd like to place a risk on trade, but I don't have conviction in the direction of the currencies over the next few hours.
Which means I'll close the book on a week of only trade, which stopped out. Mildly disappointing but I look forward to the new week.
Weekly Review and currency overview to follow. Wishing you a lovely weekend.
SPX .Bullish pattern/short termNeed to watch for failed signals/upside and maybe we even get a failed pattern and a dump.Lets see
SPX into the open.Friday 26th SeptemberRecoiling after an oversold sell off.Looks like it might test that downtrend.lets see what happens
3 Dangers of Trading DOUBTDoubt.
It’s that little idiot in your head that whispers,
“What if you’re wrong?” or “Maybe this isn’t for you.”
It’s what stops you from achieving greatness.
It’s what keeps you in uncomfortable “comfort zones”
It’s what keeps you with the herd mentality of not doing anything.
And with trading, it’s the most dangerous trait to derail your hard earned work and progress.
Let’s stop the doubt and conquer those demons.
#1: DOUBT leads to Missed Opportunities
Have you ever hesitated on taking a trade?
Have you ever doubted your trading system?
Have you ever doubted your process?
Yep, that’s doubt working its dark magic.
Doubt makes you second-guess your analysis. It causes you to miss golden opportunities.
I am a big believer of risking money per trade in a way that it feels like pennies.
So whether it be 2%, 1% or even 0.5%.
Just think about this…
What do you have to lose? Very little right?
And whether you’re trading the JSE, Dow Futures or gold – you can manage your risk.
So, you might as well go ahead and risk little to make a little bit more.
The doubt might be there, but when you find that you’re taking the trades and winning and growing your portfolio more often than not – Doubt will disappear.
#2: DOUBT makes you Lose Confidence
Doubt and confidence are mortal enemies in life and with trading.
When doubt sets in, it gnaws away at your self-belief.
All of a sudden, you’re not just doubting your trades; you’re doubting yourself. And this destroys your integrity as a person.
And in trading, confidence is key.
Confidence is what will take you into battle with a plan and knowing how to protect yourself.
It allows you to execute trades with precision, even when there is a touch of uncertainty.
Doubt is like instead of grabbing a sword, you grab a feather duster.
So you need to learn how to build and maintain confidence in your trading.
How do you do that? Celebrate your performance, winning streaks, manage your losses and keep at it.
Doubt might try to shake your confidence, but resilience will keep you standing tall.
#3: DOUBT will lead you to change your System
Doubt doesn’t just mess with your mind; it messes with your system.
You start adding and removing elements.
You start changing and acting more on a discretionary manner.
When you start doubting your strategy, you’re tempted to tweak, tinker, and completely overhaul your approach.
These changes will make you feel like you’re back to the start of your journey.
And the inconsistency, doubt and confusion will manifest into another losing strategy.
Your trading system is your blueprint for success.
It’s built on research, experience, and fine-tuning.
But when doubt infiltrates, it can cause you to question the very foundation of your strategy.
Before you know it, you won’t even have a strategy anymore.
You’ll just act on impulsive trades. And this is one of the MAIN reasons traders blow their accounts.
Patience, Passion and Persistence are the keys to SUCCESS.
FINAL WORDS:
You now have the power to overcome doubt.
Save this article, print it and let’s stop doubting.
Missed Opportunities:
Doubt makes you hesitate and miss out on profitable trades.
Loss in Confidence:
Doubt erodes your self-belief, making you hesitant and indecisive.
Alter in Your Current Trading System:
Doubt leads to impulsive changes, disrupting your trading strategy.
Remember, every trader faces doubt.
It’s how you handle it that sets you apart.
Embrace confidence, trust your system, and watch your trading soar.
SPX500 – Markets Brace for GDP and PCE-Driven VolatilitySPX500 – Overview
More Fedspeak, More Questions
Wall Street points to a soft opening on Thursday as investors digest Fed Chair Jerome Powell’s caution on stretched equity valuations, a warning that injected a note of restraint after this year’s strong market rally.
Traders are bracing for high volatility, with a heavy lineup of Fed speakers today and key U.S. data releases ahead: the final estimate of Q2 GDP later today and the PCE inflation report tomorrow.
Stronger-than-expected GDP could dampen rate-cut expectations and pressure equities, while weaker data would support a more dovish outlook.
Technical View
The SPX500 remains in a range-bound setup, awaiting a catalyst for the next directional breakout.
Bearish Scenario:
A confirmed 1H close below 6,634 would signal a downside break, targeting 6,597 → 6,577.
Negative sentiment could accelerate if GDP prints stronger than expected, reinforcing a bearish bias.
Bullish Scenario:
Stability above 6,635 keeps price consolidating between 6,635 – 6,663.
A confirmed 1H close above 6,663 would trigger bullish momentum toward 6,698.
Key Levels
Pivot: 6,635
Resistance: 6,663 – 6,698
Support: 6,615 – 6,598 – 6,577
The SPX500 is poised for data-driven volatility. Watch GDP and PCE prints for a breakout cue:
Strong GDP → bearish break below 6,634.
Softer data → bullish breakout above 6,663.

Powell cutting rates? But why would he?📉 Powell cutting rates? 100% priced in. Even talk of 1–2% slashes. But why would he?
Let’s look at what the media ignores:
🇮🇳 Reports suggest India plans to cut its US Treasury holdings by up to 50% by 2025. That could mean roughly $450B hitting the market. Who’s going to buy that debt? The Fed? They’re already running negative equity — something that would be called insolvency for any private company.
Lowering rates would allow the US government (and its billionaire buddies) to borrow even more cheap money — not to fix the economy, but to speculate, pump Bitcoin, and trash the dollar further. Inflation? Even worse.
The US economy shows all the symptoms of a recession: layoffs rising, real wages falling, manufacturing shrinking. Official GDP numbers still look positive, but let’s not forget those “revisions” that always come later. Translation: the data is constantly massaged.
So what’s the real goal? Probably to juice the housing market. But let’s be honest: US mortgage rates today are just average by historical standards. Russia’s rates are higher, yet their currency and balance sheet look healthier because they don’t live off endless money printing.
The core problem is clear: reckless dollar printing to protect billionaire portfolios. And Powell? If he truly had conviction, he wouldn’t touch the rate at all.

BullThis is not the time for weak bull hands. Despite this weeks dump we'll finish near 662-663 tomorrow.

$SPX Tomorrow’s Trading Range 9.26.25
This is tomorrow’s trading range for SPX - Look at that Island gap in the upper part. What do you think? End of the rally?
Rates were cut, equities are overvalued and it’s time to reverse this beast. Just my opinion - trade the chart not my opinion.
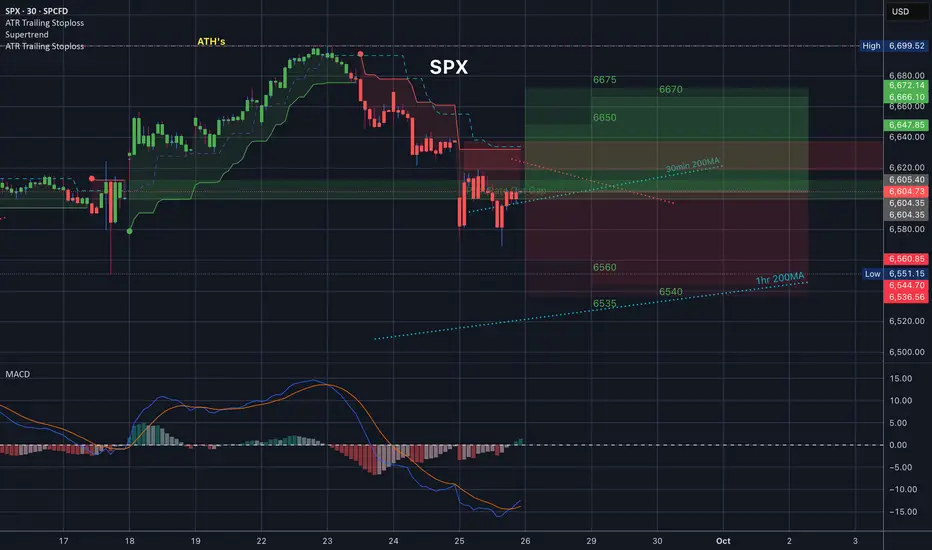
S&P 500 (SPX) Daily Technical & Macro Outlook🔎 S&P 500 (SPX) Daily Technical & Macro Outlook
🖼 Chart Technicals
Price closed 6600.97 (-0.10%), showing hesitation at a key fib confluence zone.
Breakdown from the short-term rising channel is confirmed with the red rejection wick.
Current price is testing the 0.786 fib (6627) and flirting with 0.702 (6599).
Key supports: 6570 (highlighted in yellow) and 6440.
Resistance overhead: 6699 (Fib 1) → 6808 (1.618 extension).
⚠️ The highlighted circle zone (crossing trend lines) suggests a decision point—either reclaim trend support or fail into deeper retracement.
🌍 Macro Environment & Catalysts
Fed policy & rate expectations: Recent inflation prints remain sticky; Powell comments could tilt the market either way.
U.S. fiscal situation: Government funding and deficit concerns add background risk.
Oil & commodities: Rising crude keeps inflation fears alive → bearish for equities.
Earnings season (upcoming Q3): Tech leaders will dictate momentum. Strong guidance = bullish recovery; misses = accelerated downside.
Global geopolitics: War threats and tariff disputes (e.g., U.S.–China tech rivalry) remain volatility triggers.
📊 Probability Outlook
Bullish case (40%)
Buyers defend 6570–6599 support zone.
Bounce could retest 6699, with breakout extension to 6807–6907.
Macro tailwind: Dovish Fed pivot or strong earnings beats.
Bearish case (60%)
Failure to hold 6570 = accelerated drop to 6440, then 6234.
Momentum shift shows sellers reclaiming control after a steep summer rally.
Macro headwind: Hot CPI/PCE data or Fed reasserting higher-for-longer stance.
🎯 Trade Alignment with Macro (Max Profit Setup)
Directional Bias: Short-term bearish unless 6699 is reclaimed.
Trade Idea (Options Swing):
Bearish put spread: Buy SPX 6570 puts, sell 6400 puts (3–4 weeks out).
Defined risk, profit zone aligns with 6440/6234 fib confluence.
High RR if macro bearish catalysts hit (CPI, Fed hawkish tone).
Hedge (Upside Risk): Small OTM calls at, 6800 can protect against squeeze.
📝 Final Take
SPX sits at a macro crossroads: holding above, 6570 keeps the bull case alive, but momentum favors downside. Traders should prepare for volatility into macro events, with 6570 → 6440 as a high-probability retracement path.
⚡️In summary: Until bulls reclaim 6699, the market leans bearish. Options spreads provide the best way to capture macro-driven swings while limiting risk.

SPX500 Bearish Breakout!
HI,Traders !
#SPX500 made a bearish
Breakout of the rising support
Line and we are bearish biased
Therefore, after retesting the sell cluster area
at 6643.11 So we will be expecting a Further
bearish move down !
Comment and subscribe to help us grow !

SPX is absolute in the garbage now! Great inverse playI've been saying this for a few weeks now and all those who bought at the top are now official bag holders. There's a lot more bleeding that will happen. First, SMA9 crossed (check), next we'll see aggressive drop crossing SMA50, maybe some consolidation, and if it drops below SMA200, we're in for some interesting times. Don't stress, here's your play.....check out CBOE:UVIX , CBOE:MSTZ for inverse plays. There's still some nice upside. When they say, don't sell, you sell otherwise you'll be exit liquidity! I've seen this way too many times. Best of luck!
Pull back tease, but still bearing SPX!There's a bit of a pull back taking place, but I'm not buying it! There's a lot of f&ckery taking place and no lipstick will make this pig look pretty. Fundamentals are weak and volatility is spiking, long overdue! Nice inverse plays CBOE:UVIX CBOE:MSTZ

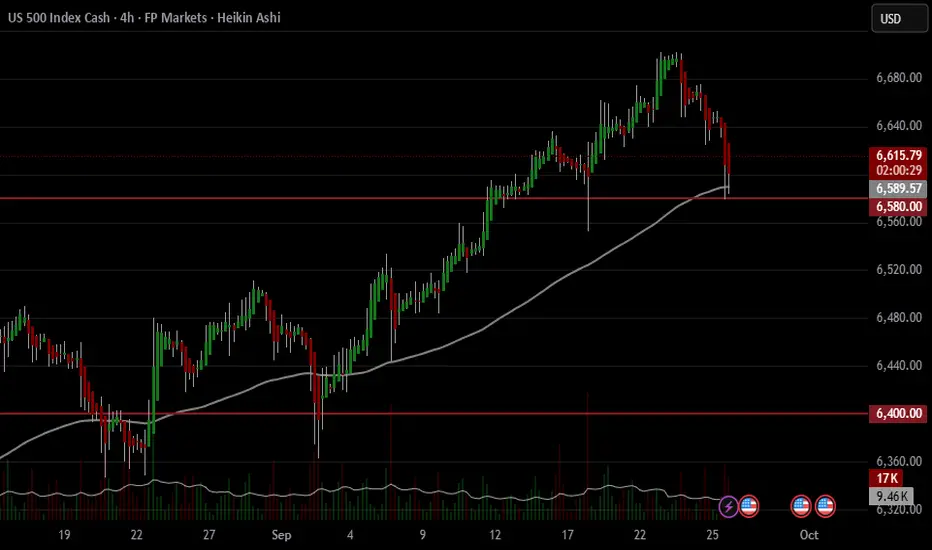
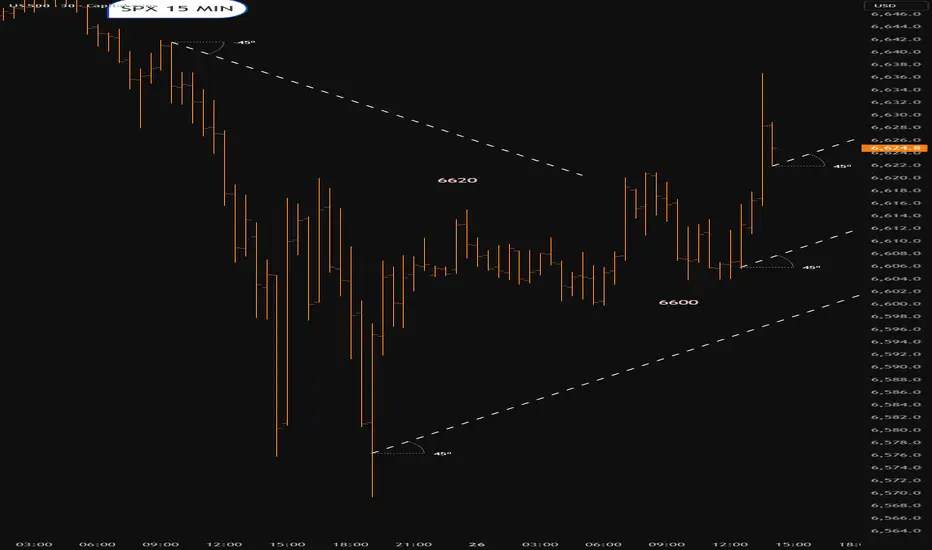
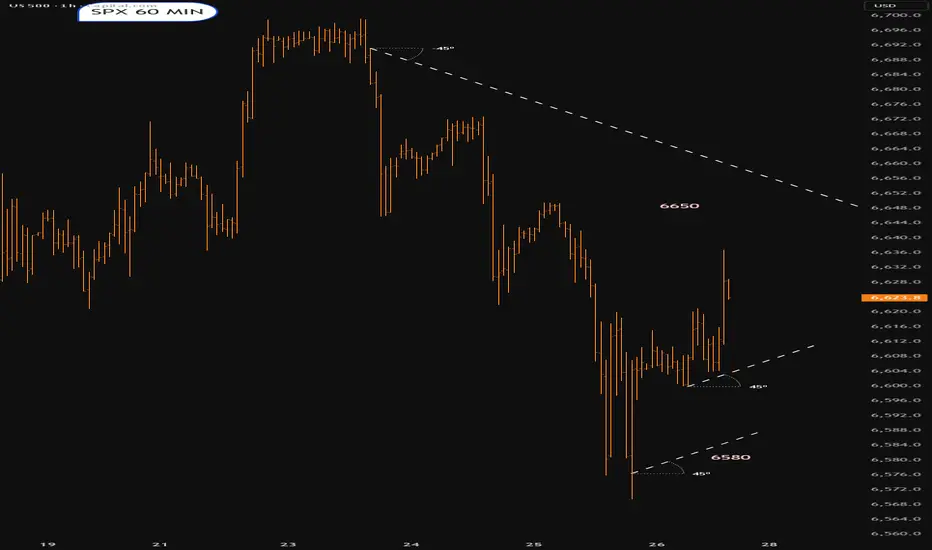
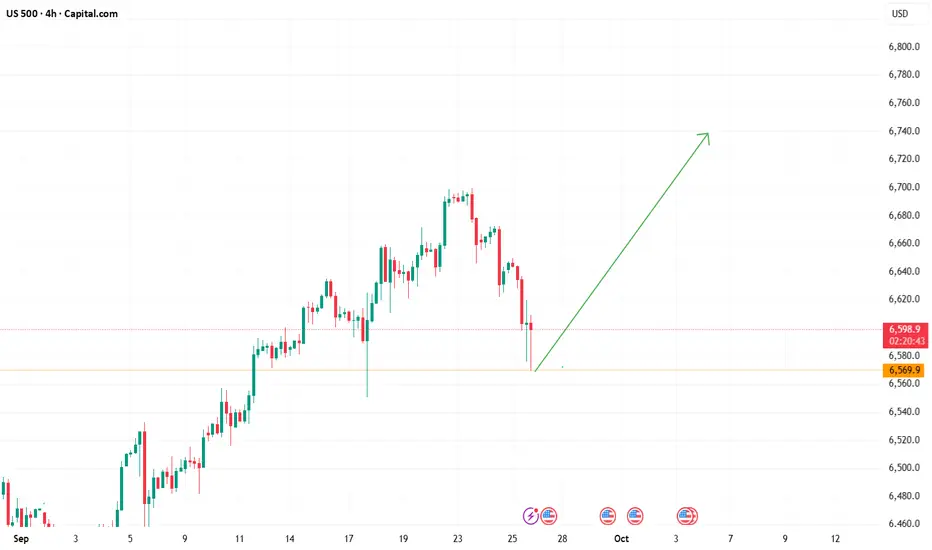
US500 Rally end?The S&P 500 is at a key moment right now, testing the 6580 support area after a sharp pullback from recent highs.
In my view, if this level breaks decisively with strong selling pressure, the market could head toward the 6400 zone, which has acted as an important support area in the past.
As long as 6580 holds, a bounce is still possible, but for now the risk seems tilted to the downside if we see a clear breakdown.
NOT FINANCIAL ADVICE.
Comment below with the ticker you’d like me to analyze next!
And don’t forget to leave a boost if you’d like to see more trading ideas like this :)