BUY SPX - S&P500- Amazing low risk high reward trade!Based on our deep analysis we can see that SPX - S&P500 will head to the upside. Great time to buy - it has broken major resistance levels + trends.
Trade ideas

SPX 500 extends recovery as traders watch US-China situationAfter breaking above 6677 yesterday, the S&P 500 created a higher high on the intraday charts, and so today's gains were a continuation of that move. But the index has now arrived into the next potential resistance area between 6720-6740, which was a key short-term support zone before the breakdown we saw on Friday. Could we see some volatility around this zone now?
Risk appetite returned overnight, with US index futures climbing to new weekly highs, even though European markets showed a more mixed performance. In currencies, the US dollar index retreated against most major peers, surrendering part of its recent gains. Market sentiment this week reflects a cautious blend of optimism and restraint. Expectations for Federal Reserve rate cuts remain the key driver, underpinning risk appetite even as gold extends its record-breaking rally beyond $4,200.
Investors appear largely unfazed by renewed US–China trade tensions, brushing off President Trump’s latest warning on cooking oil imports. Meanwhile, solid US bank earnings have bolstered confidence in corporate resilience, keeping equities supported despite the ongoing US government shutdown. Adding to the upbeat tone this morning, French political tensions eased after Prime Minister Sébastien Lecornu announced a delay to his contentious pension reform plan.
But with the US-China tensions back at the forefront, could investors start taking profits on their long equity trades to cause a bit of selling pressure now?
by Fawad Razaqzada, market analyst with FOREX.com

Crash still to come . eps 2As i said in last analyse . As long as 6760 hold which equal 720 Gann angle
we are going dn
first target was hit @ 6530
then ...
the price has rebound from 6530 which = 630 Gann angle
again , if 6760 hold we are going to 2nd target @ 6350 which = 540 angle
* If you like . give a push , for more charts
Good Luck
Breakdown in SPX is a possibility Observation on SPX
1) Since 25TH April the SPX was bouncing on its 20 Ema . In fact if you bought every time SPX touched the 20 EMA you would have made money .
2) The 20 Ema acted as a support 6 times .
3) But notice the last three bounces were weaker and weaker .
4) 7 time the 20 Ema broke with increasing volume .
Conclusion the probability of a break down is very high almost 75%
Trump’s Decision Shakes Global Financial MarketsTrump’s Decision Shakes Global Financial Markets
On Friday, 10 October, President Trump made an unexpected statement about the possible introduction of 100% tariffs on Chinese goods, triggering sharp price swings across global markets:
→ Stock markets: The S&P 500 index tumbled by more than 3%, hitting its lowest level in over a month.
→ Currency markets: The US dollar slumped sharply against other major currencies.
However, on Sunday, Donald Trump softened his tone on Truth Social, suggesting that trade relations with Beijing “will be absolutely fine”. Vice President JD Vance echoed this sentiment, adding that the United States is ready for talks if China is “prepared to act reasonably”.
This shift in rhetoric from US officials helped markets recover, with the S&P 500 index rebounding sharply at Monday’s open, reclaiming much of Friday’s losses.
Technical Analysis of the S&P 500 Chart
In our previous analysis of the 4-hour S&P 500 chart (US SPX 500 mini on FXOpen) on 4 October, we identified an upward channel (shown in blue) and expressed several concerns:
→ The price was approaching the upper boundary of the channel, where long positions are often closed for profit.
→ The latest peak slightly exceeded the October high (A), suggesting a potential bearish divergence.
→ The news blackout caused by the government shutdown created an “information vacuum”, which could quickly turn sentiment negative if filled with adverse developments.
The lower boundary of the blue channel offered only temporary support near 6,644 points on Friday before the price broke downwards. Doubling the channel width provides a projected target near 6,500, which coincides with Friday’s low.
Given these factors, it can be assumed that the lower line of the blue channel now acts as the median of a broader range following Friday’s sell-off. This suggests that in the coming days, the S&P 500 index may stabilise as demand and supply find temporary balance along this line.
Looking further ahead, the situation may resemble that of early April, when after a panic-driven market drop (also triggered by Trump’s tariff comments), the S&P 500 not only fully recovered but went on to reach new highs.
Key Levels:
→ 6,705 – a level that has acted as both support and resistance this autumn;
→ 6,606 – the boundary of the bullish gap.
This article represents the opinion of the Companies operating under the FXOpen brand only. It is not to be construed as an offer, solicitation, or recommendation with respect to products and services provided by the Companies operating under the FXOpen brand, nor is it to be considered financial advice.
W Pattern In SPX/USD Good day or night fellow traders and followers!
I see a W pattern on the 4hr chart in SPX/USD. Who wants to make around 176 points? I know I do so if price can break out over the break-line @ 6,691.6 then it's going to 6868.9 area like it or not, as it looks like Institutional buying coming in.
Follow the rules wait for 4hr chart to show price clearing the break-line on a 4hr candle close before going long. Don't bother with chop if it occurs. Waiting is the stress free way to insure direction.
Best of luck in all your trades $$$

SPX500 | HULL MA & Fibo Confluence Setting Up the Move!🎯 SPX500: The "Polite Thief" Strategy - Stealing Profits Like a Gentleman 🎩💰
📊 Market Overview
Asset: SPX500 (S&P 500 Index CFD)
Trade Type: Swing/Day Trade Opportunity
Bias: Bullish 🐂
Strategy Style: Multi-Layer Entry (The "Thief Method")
🔍 Technical Setup
The Plan: We're eyeing a bullish confirmation with a clean retest/pullback at the 38.2% Fibonacci level, aligned beautifully with our HULL Moving Average. This confluence zone is screaming "buy the dip" louder than your portfolio manager at a market crash! 📈
🎯 Entry Strategy Options:
Option 1: The "Polite Thief" Multi-Layer Approach
Instead of going all-in like it's a Vegas buffet, we're using calculated limit orders:
📍 Layer 1: 6620
📍 Layer 2: 6640
📍 Layer 3: 6660
📍 Layer 4: 6680
Feel free to add more layers based on your account size and risk appetite!
Option 2: Market Execution
Jump in at any current price level if the setup confirms during live hours.
🛡️ Risk Management
Stop Loss: 6580
⚠️ Disclaimer: Dear Ladies & Gentlemen (Thief OG's), this is MY stop loss based on MY analysis. You're the captain of your own ship! 🚢 Set your risk parameters according to YOUR comfort level and account size. Risk management is YOUR responsibility.
💎 Profit Target
Target Zone: 6860
This level represents our "Electric Shock Wall" 🔌⚡ - a confluence of:
Strong historical resistance
Overbought territory potential
Bull trap zone (where late entries get caught)
Exit Strategy Note: I'm not your financial advisor! 💼 When you see green, secure those gains at YOUR discretion. The market doesn't care about our targets - take profit when YOU feel comfortable!
🌐 Related Pairs to Watch
Keep your eyes on these correlated instruments:
📈 AMEX:SPY (S&P 500 ETF) - Moves in lockstep with SPX500; watch for volume confirmation
📈 NASDAQ:QQQ (Nasdaq-100 ETF) - Tech-heavy index; bullish momentum here supports SPX strength
📈 AMEX:DIA (Dow Jones ETF) - Broader market sentiment indicator
📈 TVC:VIX (Volatility Index) - Inverse correlation; falling VIX = bullish for equities
💵 TVC:DXY (US Dollar Index) - Typically inverse to equities; weakening dollar supports stocks
Key Correlation: When tech leads (QQQ pumping), SPX usually follows. Watch for VIX to stay subdued below 15 for sustained bullish momentum.
📝 Key Technical Points
✅ 38.2% Fibonacci retracement acting as dynamic support
✅ HULL Moving Average confluence strengthens the setup
✅ Multi-layer entry reduces average cost and timing risk
✅ Clear risk/reward structure with defined zones
✅ Resistance zone identified for disciplined exits
⚡ The "Thief Strategy" Philosophy
We're not robbing the market - we're borrowing profits with permission! 😉 The layered entry approach allows us to build positions like a professional, not gamble like a reckless amateur. Scale in, scale out, and live to trade another day!
✨ If you find value in my analysis, a 👍 and 🚀 boost is much appreciated — it helps me share more setups with the community!
⚠️ Final Disclaimer
IMPORTANT: This "Thief Style" trading strategy is for educational and entertainment purposes only! 🎪 This is NOT financial advice. I'm sharing my personal analysis and trade ideas - what you do with your money is 100% YOUR decision. Trade at your own risk, manage your own capital, and never risk more than you can afford to lose. Past performance doesn't guarantee future results. Always do your own research! 🔍
#SPX500 #SP500 #TradingIdeas #SwingTrading #DayTrading #TechnicalAnalysis #FibonacciRetracement #SupportAndResistance #RiskManagement #TradingStrategy #StockMarket #IndexTrading #ThiefStrategy #LayeredEntry #PriceAction #MarketAnalysis #TradingCommunity #ChartAnalysis

US500 (S&P 500) Technical Forecast: At a Critical Crossroad🎯 US500 (S&P 500) Technical Forecast: At a Critical Crossroad
The US500 trades at 6,672.1, testing a major technical confluence. Our analysis points to a tense equilibrium between bulls and bears, with the next directional move set for a significant breakout.
📊 Multi-Timeframe Synthesis & Market Structure
Daily (Trend Bias): The long-term trend remains cautiously bullish above the 6,600 support (50 EMA & prior resistance break). However, price action is compressing, indicating a loss of momentum and a potential coiling for a volatile move.
4H & 1H (Swing Setup): A potential Double Top pattern is forming, with the neckline near 6,640. The 4H RSI shows a pronounced bearish divergence, signaling weakening buying pressure. This is a primary warning for swing traders.
Intraday (15M/5M - Precision): Immediate resistance is firm at 6,690 - 6,700 (psychological level). Support sits at 6,660. A break below 6,660 targets the 6,640 neckline. The 5M Anchored VWAP is capping rallies.
🧠 Key Technical Narratives & Theories
Elliott Wave & Wyckoff: The structure from the last low suggests we may be in a complex Wave 4 correction or the final phase of a Wyckoff distribution (Upthrust After Distribution). A break below 6,640 would confirm this bearish narrative.
Gann & Harmonic Levels: Key Gann support converges with the 0.382 Fibonacci retracement level near 6,620-6,630. This is the next major target if sellers overpower the 6,640 level.
Ichimoku Cloud: On the 4H chart, price is trading within the Kumo (cloud), indicating a loss of trend direction and a battleground between buyers and sellers.
⚖️ Momentum & Volume Assessment
RSI (14): Reading 49 on the 1D, neutral but bearish-diverged on lower timeframes.
Bollinger Bands (20): Price is hugging the middle band, and bands are squeezing, indicating a period of low volatility that often precedes a high-volatility expansion.
Volume & VWAP: Recent attempts to push higher have been on declining volume, a classic sign of a potential bull trap. Anchored VWAP from the recent swing low is now resistance.
🛠️ Trade Plan & Levels
Swing Short Idea: Sell on a confirmed break below 6,640 (close on 1H), targeting 6,620 and then 6,580. Stop loss above 6,710.
Intraday Short Idea: Sell on a break below 6,660 or rejection from 6,690, targeting 6,640. Stop loss above 6,705.
Intraday Long Idea: Only consider buys on a strong break and hold above 6,700 with rising volume, targeting 6,730. Stop loss below 6,680.
💡 The Bottom Line
The US500 is showing cracks in its bullish armor. The burden of proof is on the bulls to reclaim 6,700. Until then, the path of least resistance appears to be lower, with a break of 6,640 likely triggering a deeper pullback. Manage risk carefully in this volatile setup.
Disclaimer: This is technical analysis, not financial advice. Trade at your own risk.

TradingView Storytellers: Share Your Videos, Inspire TradersCalling all creators, chart wizards, and video storytellers.
👋 Hey traders !
We know many of you aren’t just analyzing the markets and trading — you’re teaching, creating, and inspiring others. We see you!
And now's your chance to get your content in the spotlight — share your best work with us. Top submissions will get featured front and center for the TradingView community.
👉 How to take part:
1️⃣ Share a short video (new or one you already have) that shows how you’re using your favorite TradingView features.
2️⃣ Submit it by filling out our quick questionnaire.
That’s it! Your work could be shared with thousands of traders around the world, inspiring others and helping grow our community of creators.
🎁 As a little thank you, we’ll be gifting three free Premium annual plans to standout submissions. And who knows — you might even end up collaborating with us in the future.
👉 Fill out the questionnaire
S&P500 Volatility remains elevated, ahead of earnings resultsMonday’s Rally Recap:
The S&P 500 rebounded strongly, recovering over half of Friday’s losses. The main driver was more positive trade rhetoric, with signs the US is open to compromise—softening the tone from Friday’s comments.
A secondary boost came from AI optimism, as OpenAI signed a major chip deal with Broadcom (+9.88%), lifting tech sentiment.
Current Market Setup:
Despite Monday’s gains, S&P 500 futures are down -0.38% this morning, as:
US-China tensions escalated again—China sanctioned US units of a Korean shipping giant, a counter to US trade pressure.
Market volatility persists, with the dollar and Treasuries rising, and oil pulling back.
Government shutdown enters Day 14, disrupting IPO timelines and withholding macroeconomic data, adding uncertainty.
Focus Ahead:
The start of US earnings season today is crucial: JPMorgan, Goldman Sachs, Wells Fargo, BlackRock, Citigroup, and Johnson & Johnson all report. Their results will likely set the tone for Q4 expectations and influence near-term direction.
Underneath market movements, there's a sense of longer-term repricing as investors hedge against policy uncertainty and inflation ("debasement trade").
Bottom Line for S&P 500:
Volatility remains elevated. Monday’s rebound was fueled by sentiment, but renewed geopolitical risk, lack of macro data, and earnings uncertainty are keeping futures under pressure today. Market likely to trade cautiously until earnings results provide clearer direction.
Key Support and Resistance Levels
Resistance Level 1: 6680
Resistance Level 2: 6703
Resistance Level 3: 6728
Support Level 1: 6547
Support Level 2: 6522
Support Level 3: 6487
This communication is for informational purposes only and should not be viewed as any form of recommendation as to a particular course of action or as investment advice. It is not intended as an offer or solicitation for the purchase or sale of any financial instrument or as an official confirmation of any transaction. Opinions, estimates and assumptions expressed herein are made as of the date of this communication and are subject to change without notice. This communication has been prepared based upon information, including market prices, data and other information, believed to be reliable; however, Trade Nation does not warrant its completeness or accuracy. All market prices and market data contained in or attached to this communication are indicative and subject to change without notice.

SPX: S&P500 An Economical Reset Again?Technically, the chart is vivid and self-explanatory.
The RSI (14) is implicating an obvious Negative Divergence before the last downturn and the chart recent structure.
The US treasury has no other option but printing more and more bucks, or cutting the interest rates. I don't know any other financial instruments.
Fundamentally, no market structure can soar or fall eternally.
I have had a look on BTC and Gold Futures. Gold has some room during the coming years. Yet, regarding bitcoin, according to futures I prefer not to be too optimistic.
The implications at the moment are only some assumptions and the future remains a uncertain. This is a systematic luck guess and bet.
We have several barometers and tools based on which we can Approximate the possibilities through a few scenarios and nothing more.
Eventually, we need to check those factors and barometers and practice several reasonable scenarios on our capital.
This is not a financial advice, but it is a serious warning against perils if an over-financialization phenomenon following almost a century from that black era of high unemployment and economical downturn that the US experienced in 1930s.
DYOR
Please like and follow and have your comments inhere.

SPX500 ShortElite analysis
Price has come to fill the Gap
Reacting in the smaller time frame to execute a short
Targeting lower liquidity pools
(Sessions, CIC LP, NW LP)
2nd Possibility
Takes NW Liquidity and reacts to the down side

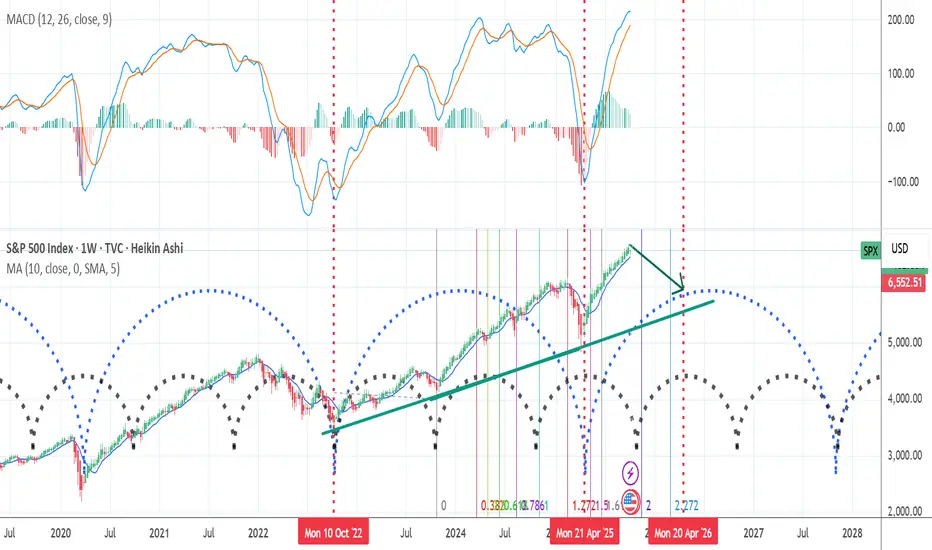
S&P 500 Bear Market in 2026The Stock market is going to send Crypto into a Bear market in 2026.
It just broke it's weekly cycle count and it's currently painting a bullish divergence. This means only one thing - we are going into a blow-off top within the next 2 months.
We are going to top above 7000 area, and in case we don't have a proper retracement into the Weekly Cycle low within November, we are going to make a blow-off top in December/January.
2026 Year will be profit taking year and the stock market is expected to retrace 20%, while Bitcoin will go down by more than 50%.
It's the last leg of the bull and it's time to get allocated in the market.

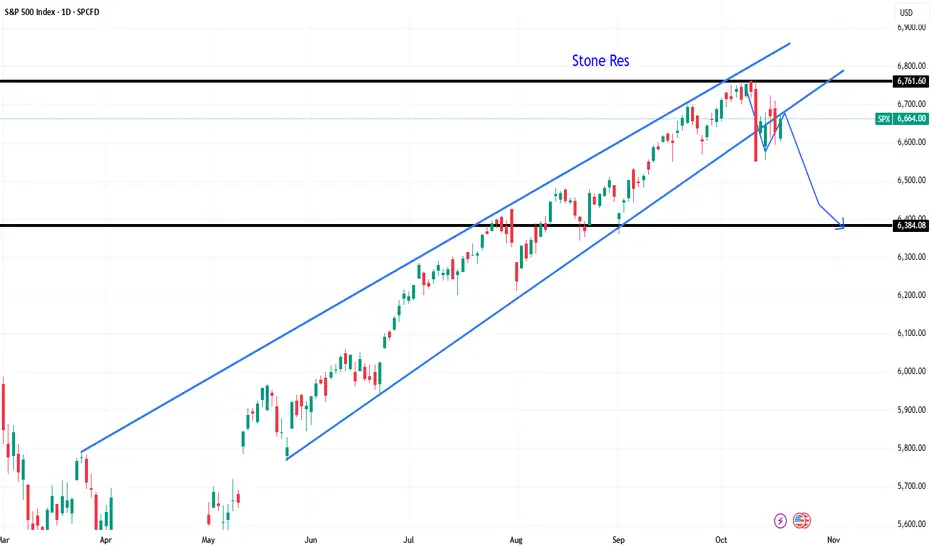
Market Pulse: Cracks in the Bull?We kick off the week with the S&P still riding its two-month uptrend, supported by the 55-day MA at 6541. But signs of fatigue are emerging.
📉 Amazon is slipping below its 200-day MA 📊 NVIDIA’s recent high at 195.62 hovers near the 197 Fibonacci extension and the 200 psychological level
Technically, the uptrend holds—and if 6765 the recent high breaks, the bull may charge on. If the 55-day MA erodes, brace for a correction.
🔍 Keep chart levels in focus 📌 Tighten stops ⚠️ Not investment advice
#TechnicalAnalysis #SP500 #Amazon #NVIDIA #MarketUpdate #TradingStrategy #RiskManagement #Fibonacci #BullMarket #ChartWatch #FinanceTwitter #LinkedInFinance

SPX | Daily Analysis #5Hello and welcome back to DP,
**Yesterday’s Review and News**
In the previous trading day, the market experienced fluctuations of approximately $118. It initially climbed during the Asian and London sessions. However, during the New York session, the market showed significant downward movement, breaking key support levels and trend lines.
Regarding news, the most notable event was the phone call between Trump and Putin, with a scheduled meeting to discuss the Ukraine conflict. The price approached the 6720 level, but sellers prevented the index from reaching and breaking the last pivot point, causing a sharp decline. The price broke through the important candle we mentioned earlier and eventually stopped at 6540.
**1H – 4H Time Frame**
Today, the market showed weakness during the Asian session (breaking the previously mentioned candle) and the early London session. However, by mid-day in London, the price found support and began moving upward. If buyers maintain this support, the price could potentially reach the 6700 level.
**Trade Idea**
At this time, the best strategy is to wait for the price to approach the 6700 area and then consider selling the index to target lower levels.
- For informational purposes only – not financial advice. © DIBAPRISM -
Issued: Amir D. Kohn

BUY SPX - S&P500- Profitable trade opportunity!Based on our deep analysis we can see that SPX (S&P500) will head to the upside. Great time to BUY - it is currently in a uptrend and is holding on to powerful support levels. The next target is the resistance level to the upside. This is a great low risk high reward trade. BUY NOW!

US500 OutlookFundamental Analysis
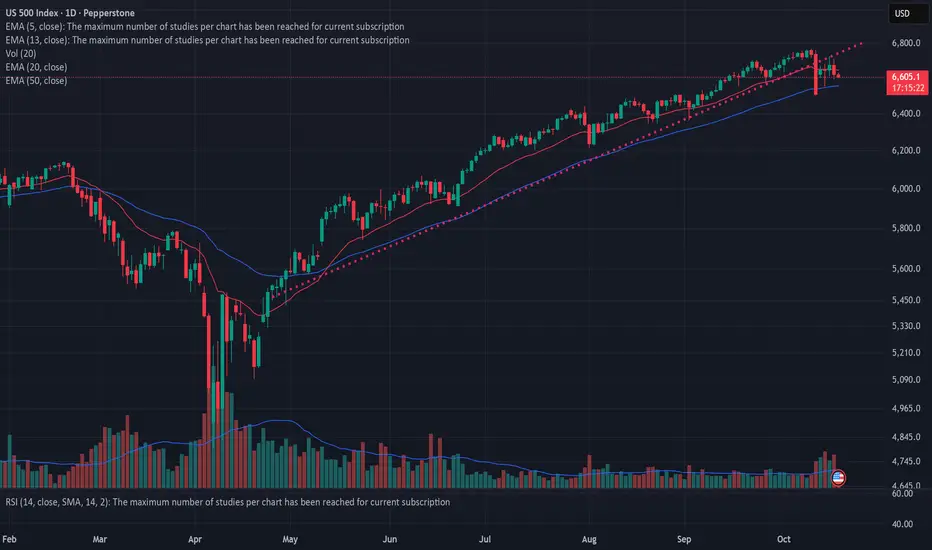
The US500 remains firmly supported by robust large-cap earnings and underlying resilience in the technology and consumer sectors. The index's significant one-year gain of 26% reflects strong corporate balance sheets and continued optimism for economic stability. Recent upward momentum is fueled by strong bank earnings and persistent hopes for Federal Reserve rate cuts. However, near-term sentiment is challenged by elevated volatility stemming from renewed US-China trade tensions and the ongoing government shutdown, alongside warnings that the market is "stretched" in valuation.
Technical Analysis
US 500 closed above 6,650, confirming a continued long term bullish momentum. However, short term technical sentiment is mixed as the index struggles to sustain rallies above its EMA21, which is acting as a cap. Immediate resistance is clustered near the recent all-time highs 6,765. Key support is identified at 6,600 down to the critical downside buffer at 6,550. A breach of the 6,550 support level could signal a definitive end to the current uptrend.
Analysis by Terence Hove, Senior Financial Markets Strategist at Exness

SPX500 Bullish Breakout!
HI,Traders !
#SPX500 is going up now
And the price broke the
Key horizontal level
Around 6695.82 and
The breakout is confimred
So we are bullish biased
And we will be expecting
A further bullish move up !
Comment and subscribe to help us grow !


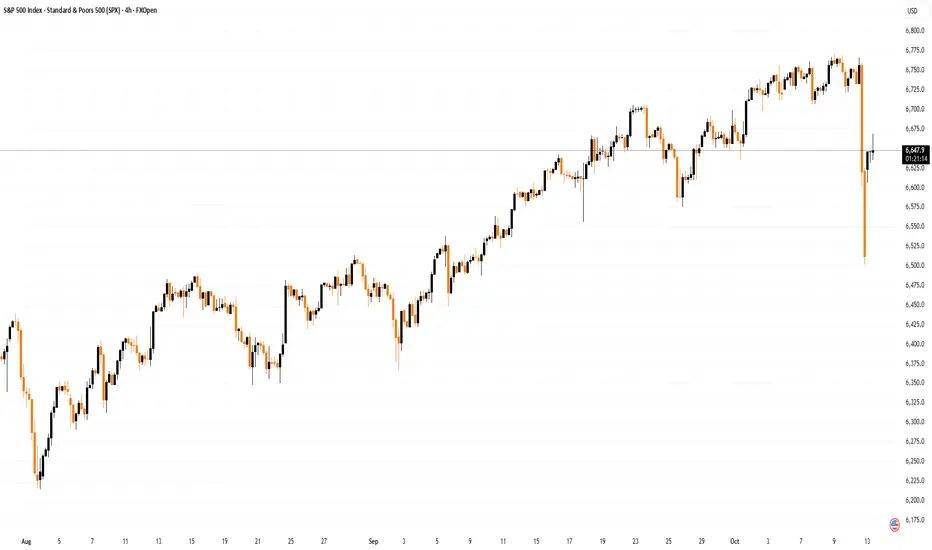
US 500 Index – Limited Correction Or Sentiment Reversal?With all the talk in the financial press last week of a potential AI bubble, soaring volatility in the precious metals market, and an on-going US government shutdown, perhaps it was understandable that traders were a little on edge going into Friday. So, when President Trump’s new threats of 100% tariffs on China were posted on social media late in the afternoon the reaction was a big downside correction, which saw the US 500 drop around 3.6% from its all-time highs of 6769 seen just a day earlier to a low of 6508.
Since then, comments from President Trump and Vice President Vance over the weekend regarding China have seemed to be more conciliatory in tone, signalling an openness to get back to the negotiating table and hammer out a deal in some form. This has seen all markets breath a small sigh of relief and led the US 500 to open higher, currently trading up 2.2% around 6650 (0800 BST). However, whether this positivity continues may depend on multiple factors, including the technical outlook (more on this below).
While trader sensitivity to the next round of comments from the US and Chinese administrations regarding the on-going trade tensions could remain high, they may also be keen to receive the latest Q3 earnings from the major US banks, with JP Morgan, Goldman Sachs and Citigroup reporting on Tuesday (before the open), then Bank of America and Morgan Stanley reporting on Wednesday (before the open). While the focus may be on assessing actual performance against expectations, it could also be important to hear the outlook for future revenue, the direction of US economic growth and the size of bad debt provisions.
Federal Reserve Chairman Jerome Powell also speaks on Tuesday at 1720 BST and with the US government shutdown delaying the release of the most recent inflation updates (CPI/PPI) which were due this week until later in October, any comments he makes regarding the inflation outlook or the potential for an October Fed rate cut could take on extra significance.
Technical Update: Limited Correction or Sentiment Reversal?
Headline-driven price sell-offs like the one experienced on Friday (Oct 10th) are unpredictable, underscoring the importance of disciplined risk management. If you're long of an asset during such volatility, having well-placed stop-losses is crucial to limit downside exposure, especially when liquidity starts to reduce, as it likely did ahead of today’s US holiday. These events serve as a reminder that protecting your trading capital is just as important as delivering profitable outcomes.
After such a sharp sell-off, the question is whether it marks a brief, exaggerated correction within a broader uptrend or signals a deeper negative sentiment shift that could lead to further price weakness.
The answer may well depend on how the price of the US 500 reacts in the upcoming sessions. Whether support levels hold, momentum stabilises, and buyers return or whether the price decline deepens and the next support levels give way.
The jury may still be out on this, but as the chart above shows, judging the potential key support and resistance levels could help gauge the next directional risks. A closing break of either side may offer signals to the next phase of price activity.
If the Sell-Off Reflects a Negative Sentiment Shift:
Friday’s sharp decline may have already breached some initial support levels, raising the risk of a more extended phase of price weakness.
The daily Bollinger mid-average (currently 6668) is typically viewed by traders as a support level in an uptrend and this level was broken on a closing basis within Friday’s decline. Despite this morning’s rally, 6668 could now act as a resistance, and if it remains intact, could keep upside activity in check for now.
While 6668 resistance holds on a closing basis, this morning’s recovery may be viewed by some as a reactionary bounce following Friday’s sharp decline, leaving possibilities of renewed selling pressure later in the week.
If this proves to be the case, closing breaks below potential support at 6550, a level which is equal to half the rebound from Friday’s low, might lead to renewed downside pressure. This may open tests of 6490, the 50% retracement of the August 1st to October 9th rally, with a closing break below this level, suggesting scope for moves toward 6224 which is the 61.8% retracement.
If the Sell-Off Proves to be a Limited Correction:
While Friday’s decline was sharper and larger than any since the June 2025 lows, traders may now be watching whether current price strength can close back above the 6668 Bollinger mid-average.
While not a guarantee of renewed price strength, past declines since June 23rd 2025, have seen US 500 prices recover to close back above this line, leading to resumed attempts at upside strength. A closing break back above 6668 may once again open attempts to push to higher levels.
If confirmed, a break above resistance at 6668 may lead to further upside back toward 6769, which is the October 9th all-time high. Should this level give way, further strength may extend toward 6866, which is the 38.2% Fibonacci extension of last week’s sharp decline.
The material provided here has not been prepared accordance with legal requirements designed to promote the independence of investment research and as such is considered to be a marketing communication. Whilst it is not subject to any prohibition on dealing ahead of the dissemination of investment research, we will not seek to take any advantage before providing it to our clients.
Pepperstone doesn’t represent that the material provided here is accurate, current or complete, and therefore shouldn’t be relied upon as such. The information, whether from a third party or not, isn’t to be considered as a recommendation; or an offer to buy or sell; or the solicitation of an offer to buy or sell any security, financial product or instrument; or to participate in any particular trading strategy. It does not take into account readers’ financial situation or investment objectives. We advise any readers of this content to seek their own advice. Without the approval of Pepperstone, reproduction or redistribution of this information isn’t permitted.

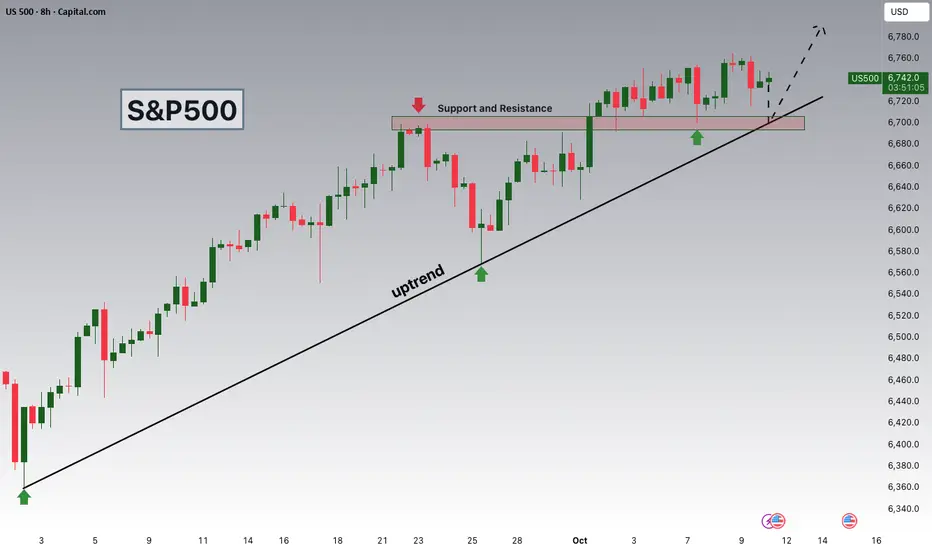
S&P 500 Watching 6,700 Support as Seasonal Tailwinds Strengthen.Hey Traders,
In today’s session, we’re keeping a close eye on US500 for a potential buying opportunity around the 6,700 zone. The S&P 500 remains firmly in an uptrend, with price currently in a healthy correction phase approaching a key support and trend confluence near 6,700.
Beyond the technical setup, seasonality adds a bullish layer — over the past 15 years, the S&P 500 has advanced 14 times in October to early November, averaging significant gain during this window.
If history rhymes, the current pullback could offer a compelling buy-the-dip opportunity into one of the market’s strongest seasonal periods.
Trade safe,
Joe.
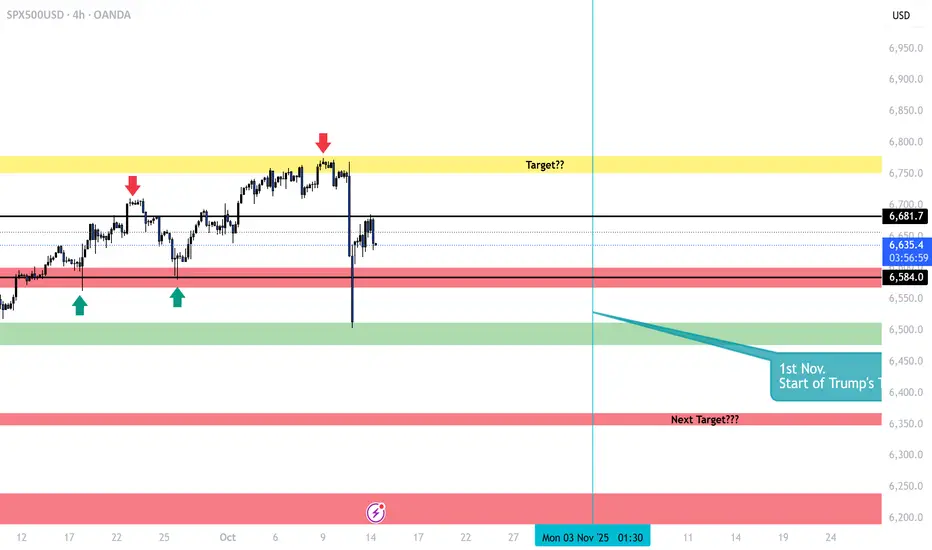
SPX | Daily Analysis #2Hello and welcome back to DP,
**Review and News**
Yesterday, at the start of the week, the SPX opened with a significant upside gap, largely driven by a tweet from former President Trump on Friday. His statement—"Don’t worry about China and Xi, they don’t want a recession for their economy, and neither do we"—helped restore investor confidence, pushing them back into the market, particularly into this index. However, shortly after, Trump reiterated that tariffs would still be implemented on November 1st, which is expected to have a considerable impact.
This morning, President Xi reaffirmed his stance, saying, "China will fight to the end, but the doors for negotiation are always open." As seen on the chart, the price has moved within a range between $6,681 and $6,584.
**4-Hour Price Action**
As indicated by the chart, the price range between $6,681 and $6,584 seems to be holding steady for now. One scenario suggests the market is in a consolidation phase. The shape of this consolidation will depend on the future performance of the market. It could either form a diagonal pattern or remain within a box range, as investors battle against short-sellers.
Using Fibonacci retracement, it appears the price may extend to the 0.236 line at $6,706. If this Fibonacci level holds, the market could face a downturn, potentially targeting the next support level indicated by the red box below the chart.
**Trend Analysis**
As shown, the trend illustrates a clear relationship with price movement. The price opened above the trend line, then expanded below the next trend level, showing respect for it. This movement suggests that downward pressure remains, with the market's direction depending on the break of the current trend line.
Personally , I believe the market may head south, but it won’t be a straightforward move. The decline could be unpredictable and happen quickly, or it may unfold in more gradual, choppy moves. One thing to be certain of is that retail traders are betting against the market, mainly due to the gap being filled. However, caution is advised when trading this index. It’s important to wait for confirmation before making any decisions.
[VNFORECASTER][SPX] The price action of SPX in next cycle The price action of SPX in next cycle on Oct 11, 2025
The price action of SPX index can go down quickly.