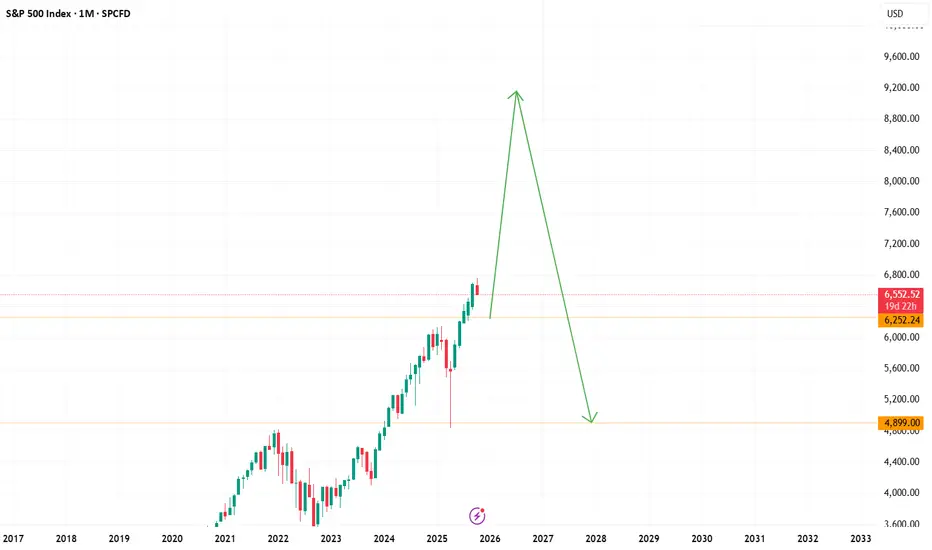
Bigger Market Correction ahead??? We can see a bigger correction in markets???
Its a nice probability. Its that happened could be a great opportunity to longs entry before we can see a new leg up in markets until the Q2-Q3 2026 for the end of 5 or 6 years current liquidity cycle .
Then we can spect the beggining of the bigger bear market that we ever see in our times. (nobody know's)
This its not finantial advice, just a trading idea for entertaiment and educational porpuose, dont follow this idea! Keep your owns idea in play , do your own reaserch and manage properly your money. The markets have bigger risks escenarios right now.
Trade ideas

S&P 500 (SPX) Simple Break Down The S&P (SPX) is sitting at a key turning point. Here’s what to watch for next:
If price drops below 6553, we could see it keep falling toward 6469 and if that breaks, then possibly down to around 6398.
But if price pushes above 6763, the next big target area could be 7237–7274.
So basically:
👉 Below 6553 = likely drop
👉 Above 6763 = likely climb
Right now, we’re in a tight spot where either direction could open up a strong move.
If you’re unsure how to trade around these levels or what kind of pullback makes sense, shoot me a quick DM
I can walk you through how I’m looking at setups and risk zones in plain English.
Mindbloome Exchange

October 13 - October 17 2025I decided to go through and consolidate my charts this week to make for easier decision making. Friday’s sell off was a sign of weakness in a market that was already showing strain. While the drop on resumed trade war threats was swift, the rest of the market had a muted response. Heading into this week, we should see another big move and I will try to be open to trading either side depending on how this develops.
1. Macro
Gold is still in its uptrend and that is unlikely to change anytime soon. I don’t have it charted here, but Gold’s volatility index CBOE:GVZ spiked during Friday’s session, however buyers seemed to be absorbing the volatility since it still closed up over 1%. Gold has already made a new ATH today and I do not expect to see the trend change this week.
The dollar TVC:DXY seems to be near the top of its deviation from the flat EMA. I think we will see the dollar move lower which could boost Gold, Stocks, or both. Next, we saw TVC:US03MY remain relatively flat during Friday’s sell off while TVC:US10Y moved sharply lower during the session, making the TVC:US10Y -US03MY spread very tight once again. Since real yields are still edging up and the 3M bond stayed flat during the panic, that leads me to believe the bond market volatility was contained and may not be indicative of a true risk-off reaction.
One reason why US Treasuries will continue to catch a bid is that as forward inflation expectations continue to slide (bottom left chart), the real return is still attractive compared to bonds from other major countries. We’ll see if the renewed trade sparring will change the forward inflation exceptions trend since the data from TIPS is delayed, however for now I’ll continue to base my perception on what I’m currently seeing on the chart.
Lastly, Oil is continuing to see an average decline. Hopefully middle eastern peace efforts are successful, which could keep the price subdued. On the bottom chart I have combined the average of MCX:COPPER1! and Corn CBOT:ZC1! into a single line compared to TVC:DXY , which aims to show real demand (and/or inflation) pressure against the Dollar’s relative strength. Here we can see commodities took a hit on Friday but the trend is still very strong to the upside. Since forward inflation expectations are down and the dollar is flat, this may be pointing to the presence of real demand, which should be bullish for equities.
2. Risk
Even when looking at the past six months on a line chart, the pullback, Friday’s drop was significant. As I mentioned last week, there are important risk-health items to watch for here. I’m now just charting the High Yield OAS - Investment Grade OAS spread, which was already starting to move up before Friday’s sell off. This data is only reported once per day for the previous session, so the impact on corporate bond yields is not yet known. This will be very important to pay attention to, as it could signal true aversion to risk.
Next, the $ES1!/GOLD spread is declining and should continue until Gold enters a re-accumulation phase. Anyone’s guess when that will be so for now I think it’s safe to assume that Stocks will continue to underperform Gold, and if Friday’s drop was any indication of which side is in control, it serves as confirmation that stocks are sensitive to bad news. Buyers seem to be the ones getting absorbed.
The third chart on the top shows that although CME_MINI:NQ1! has been outperforming CBOT_MINI:YM1! since the market bottomed, the momentum seems to be stalling out. I’ll be looking at the sectors to find any further signs of sustained rotation.
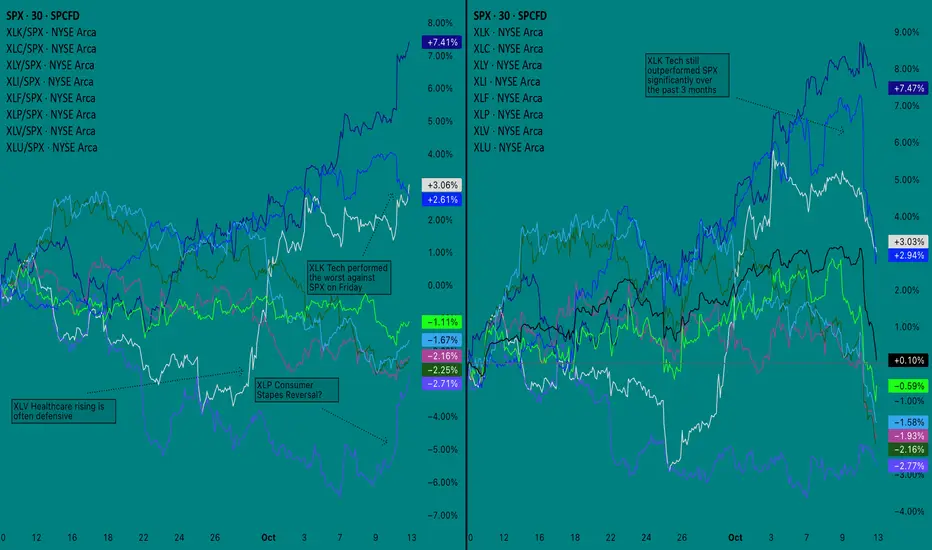
3. Sector Analysis
My notes are best explained in the screenshot but my comment is that most of the decline on Friday came from AMEX:XLK (Tech sector) selling off. Other sectors performed better against SPX, with AMEX:XLP (Consumer Staples) seemingly breaking out of a decline, however as you can see from the chart on the right, it has still been the worst performer against the other indices over the past three months.
One session is not enough to change the trend, however it will be important to watch for continued rotation out of tech and into other sectors. This could cause CME_MINI:NQ1! to decline against CBOT_MINI:YM1! as I suggested earlier, and would signal the market is positioning for a more sustained downturn - likely caused by disappointing growth.
4. Bias
This is the chart I have tried to condense the most. I have switched to just using Line Break as my main chart for ES, which I found performed better than Renko when combined with my other indicators. On the lefthand side, I am using Session CVD but got rid of my other indicators and made a CVD Momentum indicator, which tracks the momentum of CVD rising or falling over an anchor period (1 week). I’m still using a range chart calculation for this chart, currently set to 20R.
On the right, I am using what I’ll call my Volatility Dashboard, however it does not start producing a useful signal until premarket. Based on Volatility, it can be said with certainty that dealers went long on puts right before the sell-off began.
From a technical standpoint, the price was in a rising wedge and dumped after it made a higher high that did not reach the upper trend line. Rising channels are generally bullish, however the extent of Friday’s free fall could mean that even if the price quickly recovers, it may be forming a top similar to what we saw last December. This is why risk indicators like corporate bond spreads, sector performance, and changes to the macro structure will be important to monitor over the coming days.
—
Conclusion
For this week, all I can say with certainty is that I think there will be some good opportunities. Here is what I believe can be safely assessed from this analysis:
1. Stocks remain under pressure, however “smart money” will require more time to rotate out of tech, leading to repeated retests of the top of the range.
2. Tailwinds for stocks are potential real demand in agriculture and industrial material that is not impacting the market’s forward inflation expectation.
3. “Smart Money” will sell volatility (puts) into pullbacks if the price is set to be driven higher, or will do the opposite, buying volatility (puts) and selling calls on low volume rips
This is why I will be looking for more confirmation before taking a side, as the market’s goal now is to clear out liquidity. When it comes to the larger trend, I tend to think that stocks do not seem to be showing strength over the larger macro structure, however that does not necessarily dictate that the index will come down another 8%. Instead, I think at the very least we will stay in a flat range for the time being.
I do not think the market is ready to go on a bull run, nor do I think the environment is showing a risk-off bias that is strong enough to warrant stocks going straight down. If we meet resistance near the top of the range, I’ll look at volatility positioning and CVD for the signal to go short. Conversely, if we make a higher low I will go long on calls to the top of the range.
Good luck to all and thanks for reading!
SPX Technical Levels to watchSPX (S&P 500) Technical Levels Quick Breakdown
Current Price: 6,552.51 (as of Oct 10, 2025 close, down 2.71%; futures suggest mild rebound at Oct 11 open).
Key Levels (Classic Pivots):
Support: S1 $6,576 | S2 $6,562 (watch for breakdown below S2 toward $6,500).
Resistance: R1 $6,613 | R2 $6,637 (clearing R1 eyes $6,700 round number).
Pivot: $6,600 (neutral gravity point).
Key Indicators (Daily Timeframe):
RSI(14): 18.6 (deeply oversold—potential bounce setup above 30).
MACD(12,26): -34.8 (strong sell signal, bearish momentum).
Moving Averages: All sell (e.g., 5-day SMA $6,602; 50-day $6,717; 200-day $6,619—price well below, confirming downtrend).
Overall: Strong sell across MAs and indicators, but oversold RSI flags exhaustion risk for a relief rally. Watch volume on any upside push.
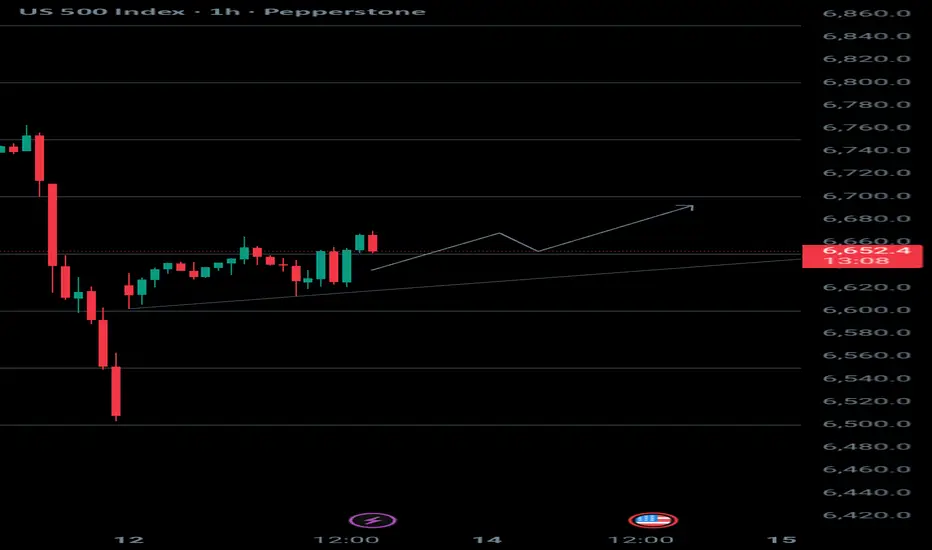
US 500The US 500 has just broken through the 6650 level again. After testing support and closing above it, the trend is to target the next level, 6700.
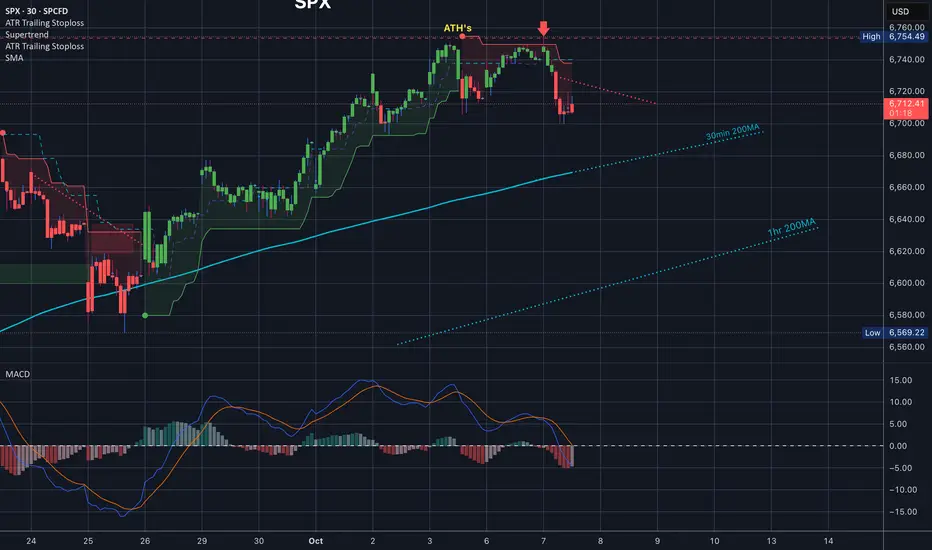
$SPX $ES_F SUPERTREND is an indicator you should learnSP:SPX $ES_F SUPERTREND is definitely an indicator you should learn how to use.
What's funny is it doesn't act the way you likely originally think it works, so learning to read it well can give you a huge edge. Look at where we got smacked down today, right at supertrend. We got the signal Friday, moved up to it yesterday, tested it today and got smacked down.
So beautiful!! So if you have Super trend and the 35EMA you have everything you need. For ES Traders you should be checking these levels on Regular Trading hours not Electronic, once in a while.
Here we go! The rally begins, ladies and gentlemenAccordding with TS: Don’t worry about China, it will all be fine! Highly respected President Xi just had a bad moment. He doesn’t want Depression for his country, and neither do I. The U.S.A. wants to help China, not hurt it!!! President DJT

The next markets move will be agrresive, crypto will follow!SPX6300 then massive rally 5 months in a row, then crash to Trump's "buy now" low.
Nov-DEC-Jan-Feb-March will be green.
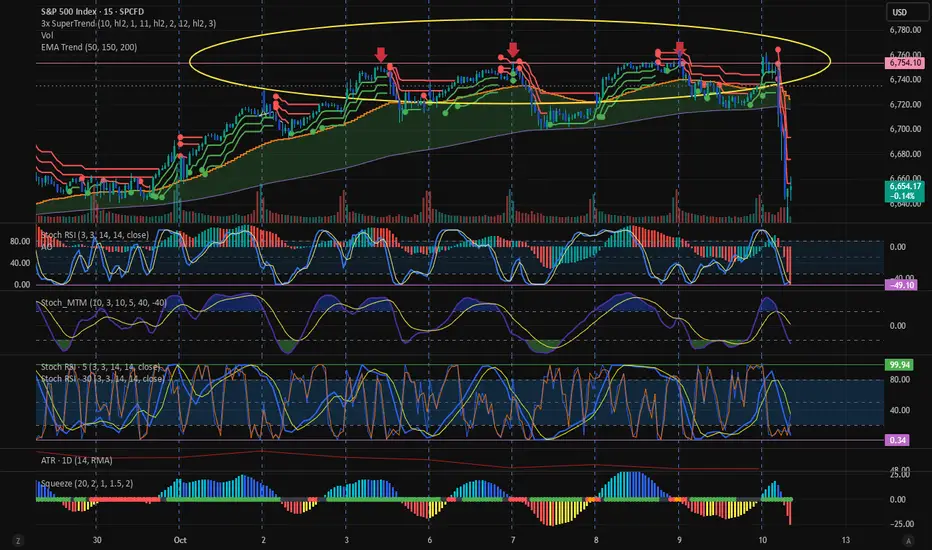
Today Fundamental Analysis Confirmed my Technical AnalysisSee my previous post where I stated that we were getting rejected the triple top was confirming the market was rolling over at least in the short term. Today Trump stating that China was becoming openly hostile caused a sell off. But the tape was telling the tale before it happened.
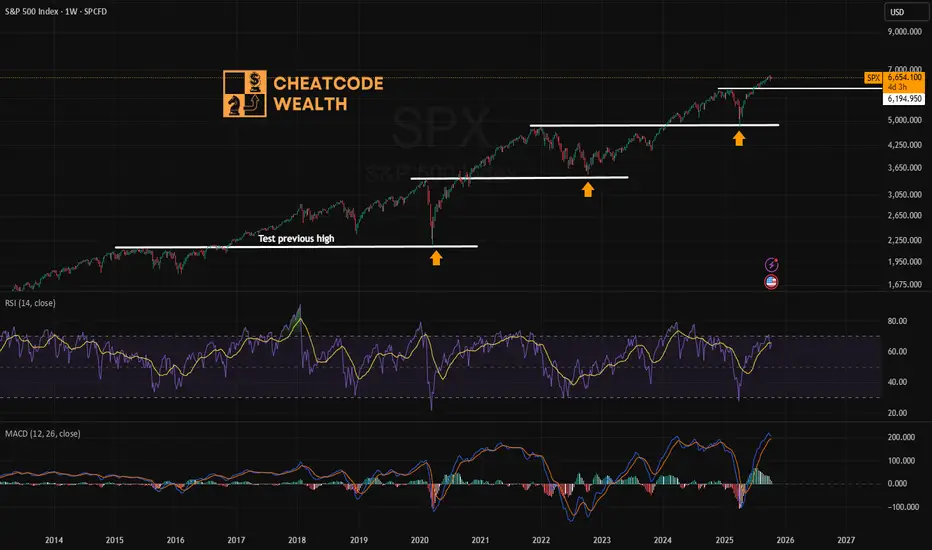
SP500 path forward: volatility and retest of previous highsAssuming that previous patterns continue, and they may not, the SP500 will eventually retest its previous new highs, but likely not in the near future, short of a volatility event.
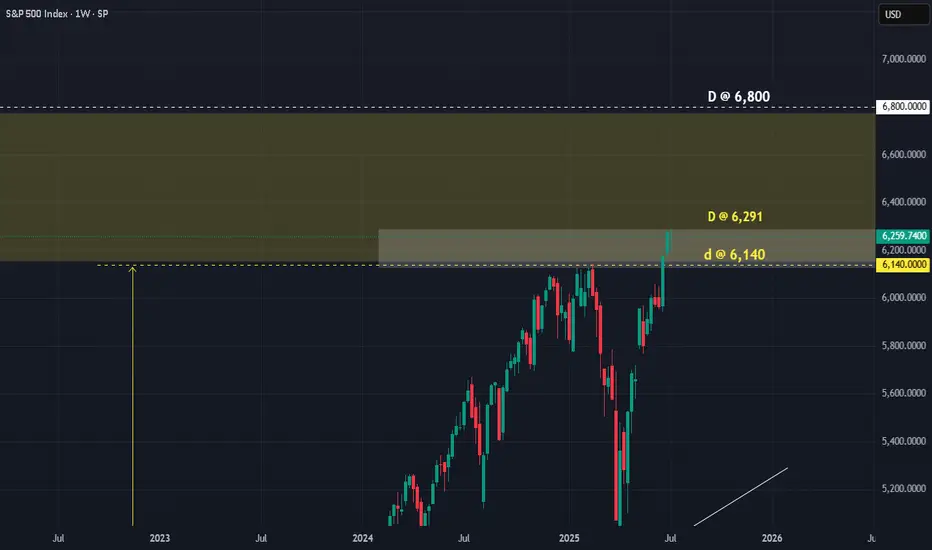
SPX : How to play this DPrice has now reached our target as anticipated. The question is, when do we SELL?
Anyway, for those who follow the D, I am sure it has saved you guys a lot of trouble. At least you know where/when to start SELLING. Many others who started selling EARLy had all lost their money.
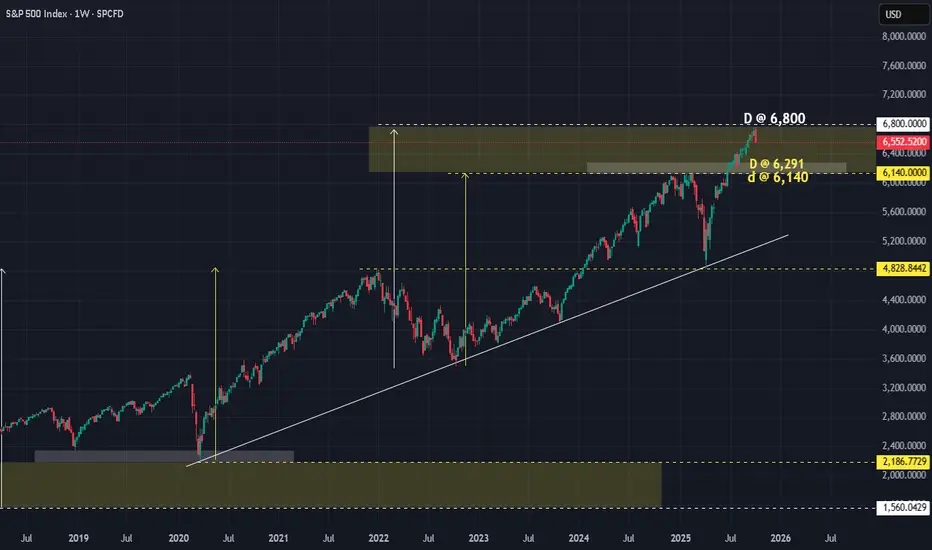
As we can see, there are 3 D's. Price can still move UP to 6,800. Bear that in mind. Or has already reached the max at 6,291!!!
Price is at where they are, there are 2 choices:
a) SELL now and SL @ 6,300
b) SELL when price touched the lower D @ 6,140 with SL @ 6,291
Whichever way, the R/R is still FANTASTIC.
It is true that MARKET MAKER might still take advantage and try to screw short sellers. But even they would find it hard at the D. For even they need to respect it a bit.
If you know your D, you trade safer.
Good luck.
SPX : Remember what I wrote on 14 Jul 2025Long ago, I put up this chart.
Thanks to Trump, it is finally a reality.
Price has nowhere else to go but DOWN.
This is the kind of MONEY you can make by being patient.
Good luck.
DJI and SPX ---- ;-)
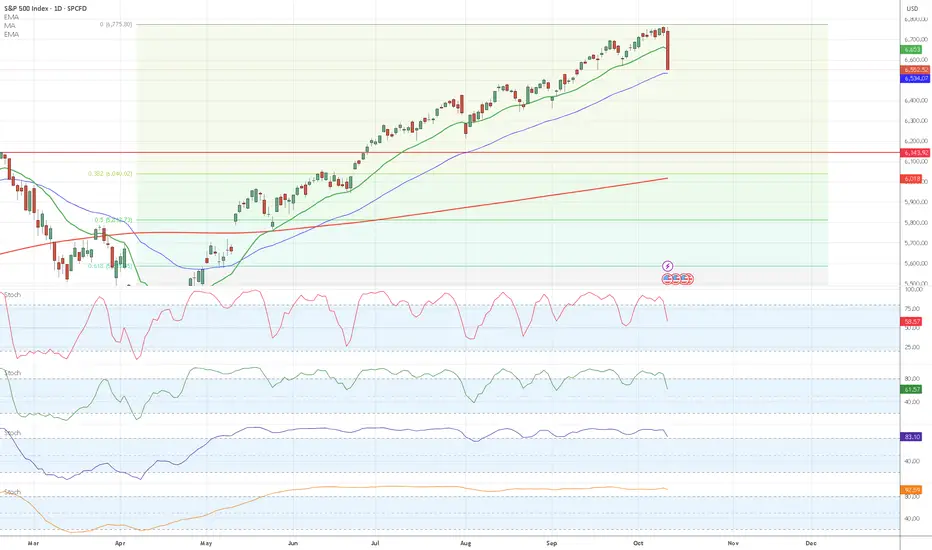
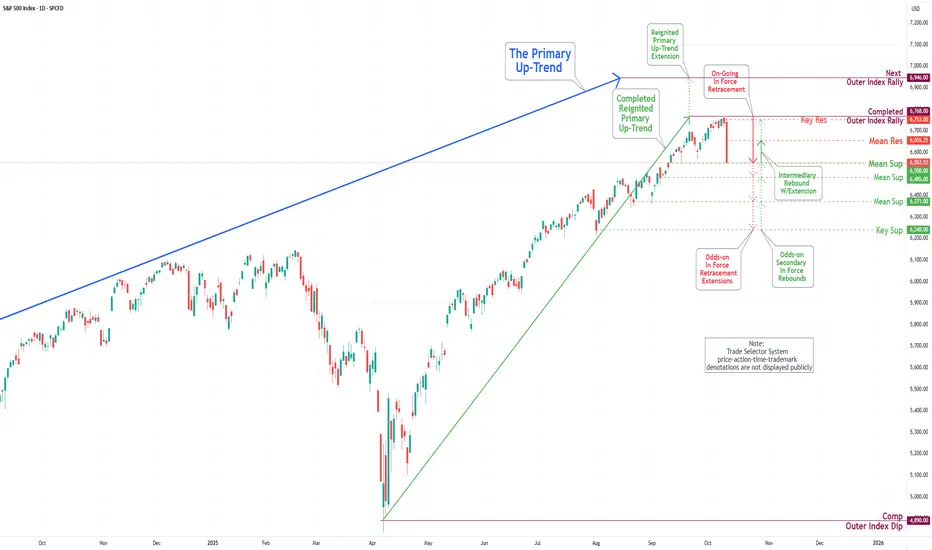
S&P 500 Daily Chart Analysis For Week of Oct 10, 2025Technical Analysis and Outlook:
During the previous week's trading session, the S&P 500 Index experienced a notable decline in price activity after reaching the Key Resistance level of 6750 and the Outer Index Rally at 6946.
At present, the index is positioned just above the newly established Mean Support level of 6550, which indicates the potential for further downward momentum. This trend could extend to subsequent Mean Support levels of 6485, 6371, and the Key Support level at 6240.
It is imperative to recognize that the index may exhibit a strong rebound following its price contact at the Mean Support level of 6550. Furthermore, there exists the possibility of an upward extension that could reach the Key Resistance target of 6753.
Global Market Time Zone ArbitrageExploiting Temporal Gaps in Financial Trading.
Introduction
In the world of finance, time is money—literally. Global markets operate across multiple time zones, from Tokyo to London to New York, creating a continuous 24-hour trading cycle. This nonstop nature of global finance gives rise to an intriguing phenomenon known as “time zone arbitrage.” It refers to the opportunity traders have to profit from differences in asset prices across markets that open and close at different times. These discrepancies often occur due to variations in liquidity, news flow, investor sentiment, and economic data releases.
While traditional arbitrage exploits price differences between identical assets in different locations or exchanges, time zone arbitrage takes advantage of temporal inefficiencies—how the same information is priced differently at different times of day across the globe. Understanding this concept requires a grasp of market interconnections, regional behaviors, and how global events ripple through the timeline of financial markets.
1. The 24-Hour Trading Clock
Global financial markets never sleep. When the Asian markets wind down, Europe takes over, followed by the U.S. sessions, which eventually hand back momentum to Asia. This rotation ensures that trading activity continues around the clock, covering key financial hubs:
Region Major Markets Trading Hours (GMT) Overlap With
Asia-Pacific Tokyo, Hong Kong, Singapore 00:00 – 08:00 Europe (partial)
Europe London, Frankfurt, Paris 07:00 – 15:30 Asia (early), U.S. (midday)
North America New York, Chicago 12:00 – 21:00 Europe (early)
The overlapping hours, especially between London and New York, see the highest liquidity and volatility. However, when one market closes and another opens, temporary inefficiencies can occur. These are the breeding grounds for time zone arbitrage opportunities.
2. Defining Time Zone Arbitrage
Time zone arbitrage is a strategy that seeks to profit from price differences created by timing gaps between global markets. For instance, when an event occurs after the close of one market but before another opens, the latter reacts first. Traders anticipating how the closed market will respond once it opens can position themselves ahead of that reaction.
Example:
Suppose a major tech company listed on both the New York Stock Exchange (NYSE) and the Tokyo Stock Exchange (TSE) releases strong earnings after NYSE closes. The Tokyo market opens several hours later and reacts immediately to the news, pushing prices higher. A savvy trader could buy shares in Japan and later sell in New York when it opens, assuming the NYSE-listed shares will follow the same upward adjustment.
This approach doesn’t involve “insider information”—it’s about acting faster within a global time structure.
3. The Mechanisms Behind Time Zone Arbitrage
a. Information Lag
Financial information doesn’t reach all investors at the same time. Even though digital news travels instantly, the interpretation and pricing of that information vary across regions.
Asian traders may react differently to U.S. Federal Reserve comments than their European counterparts.
Markets that close early might “miss” a late-breaking development, creating temporary mispricing.
b. Fund Valuation Delays
Mutual funds, ETFs, and index funds in certain markets are priced based on closing prices, which creates valuation lags. For example, U.S. mutual funds investing in Asian equities may value their holdings at stale prices, ignoring overnight moves in Asian markets. Arbitrageurs can exploit this discrepancy through stale price arbitrage, a form of time zone arbitrage.
c. Cross-Listed Securities
When the same company’s stock trades on multiple exchanges (e.g., London and New York), time zone differences can create arbitrage windows. Traders monitor price deviations and use derivatives or foreign exchange tools to hedge risk while exploiting temporary inconsistencies.
d. Currency Influence
Because cross-border trading involves multiple currencies, forex market movements play a critical role in time zone arbitrage. Exchange rates fluctuate continuously, impacting how international assets are priced in local currencies.
4. Real-World Examples of Time Zone Arbitrage
i. Japan-U.S. Market Arbitrage
When Wall Street closes, the Nikkei often reacts to the S&P 500’s performance overnight. Traders who anticipate these reactions can use index futures to capitalize on correlations between the two.
ii. Asian ETFs in U.S. Markets
Many U.S.-listed ETFs (like the iShares MSCI Japan ETF) track Asian indices. However, when the U.S. market opens, Asian exchanges are closed. If U.S. traders expect the Asian market to open higher the next day (based on global cues), they can buy the ETF in anticipation—earning profits when the ETF’s price aligns after Asia opens.
iii. Currency Futures
Currency markets, particularly USD/JPY or EUR/USD, exhibit strong correlations with regional stock markets. Traders use these as time-zone proxies, trading currencies in one time zone to predict or hedge equity movements in another.
iv. Gold and Commodities
Commodities like gold trade continuously across exchanges, but price adjustments often occur in waves. If Asian demand pushes gold higher overnight, U.S. traders can anticipate a catch-up rally during their session.
5. Institutional Exploitation and Algorithmic Trading
Modern arbitrage has largely become the domain of institutions equipped with algorithmic trading systems. High-frequency trading (HFT) algorithms scan multiple markets, currencies, and time zones to detect fleeting inefficiencies.
Key techniques include:
Latency Arbitrage: Exploiting milliseconds of delay between data feeds from exchanges in different time zones.
Cross-Exchange Hedging: Simultaneously buying in one market and selling in another as prices converge.
AI-Powered Prediction Models: Using sentiment analysis and global event tracking to forecast market reactions in different time zones.
Because these opportunities exist for only seconds to minutes, manual traders rarely succeed without advanced technology.
6. Risks and Limitations
Despite its appeal, time zone arbitrage isn’t without challenges:
a. Execution Risk
Price discrepancies may vanish before the trade is executed, especially in high-frequency environments. Latency and order execution speed are critical.
b. Currency Risk
Cross-border transactions expose traders to exchange rate volatility. A profitable price move could be offset by an unfavorable currency fluctuation.
c. Transaction Costs
Commissions, spreads, and taxes can erode the small profit margins typical in arbitrage strategies. Institutions often rely on large volumes to make such trades worthwhile.
d. Market Correlations
With globalization, asset correlations have increased, reducing inefficiencies. Arbitrage opportunities are rarer and shorter-lived.
e. Regulatory Barriers
Different countries have distinct trading regulations, taxes, and capital controls. Navigating these legal frameworks requires compliance expertise.
7. Time Zone Arbitrage in Different Asset Classes
a. Equities
Cross-listed stocks and ETFs provide the most direct time-zone arbitrage routes. Example: ADRs (American Depository Receipts) and their foreign counterparts often show price mismatches.
b. Bonds
Fixed-income markets move slower but still present opportunities. Global bond ETFs can react late to sovereign yield changes, creating short-term valuation gaps.
c. Currencies
Forex markets operate 24/7, making them the backbone of time zone arbitrage. Traders use currency pairs as early indicators for equity and commodity moves.
d. Commodities
Oil, gold, and copper often see price leadership shifts between Asia, Europe, and the U.S. as regional demand and supply updates roll out.
e. Cryptocurrencies
Crypto markets are open 24/7, yet time-zone trading patterns persist due to regional investor behavior. Asian sessions often set the tone for early momentum, while U.S. traders influence volatility later in the day.
8. Case Study: The Asia–U.S. Price Reaction Cycle
Consider a simplified chain reaction:
U.S. closes higher on positive economic data.
Asian markets open hours later and react to the U.S. optimism by rallying.
European markets open next, digesting both U.S. and Asian sessions, adding or adjusting momentum.
The U.S. reopens, responding to global sentiment formed overnight.
Traders who understand this cyclical information flow can position themselves to profit. For instance, buying Asian index futures before the open after a strong U.S. session often yields short-term gains—an example of inter-temporal correlation arbitrage.
9. The Future of Time Zone Arbitrage
Technological advancement is both a blessing and a curse for arbitrageurs. On one hand, machine learning and big data analytics enhance detection of global mispricings. On the other, automation has drastically reduced the lifespan of opportunities.
Emerging technologies shaping the future include:
Quantum computing for ultra-fast data analysis.
AI-driven sentiment analysis tracking news flow across time zones.
Decentralized trading platforms reducing latency barriers.
Moreover, as financial institutions seek a “follow-the-sun” trading model, with teams operating in shifts across continents, time zone arbitrage could evolve into real-time global arbitrage networks.
10. Conclusion
Time zone arbitrage stands as a testament to the interconnectedness of modern finance. It reveals how geography and time, despite technological progress, still shape global asset pricing. By leveraging differences in market hours, traders exploit short-lived inefficiencies caused by delayed reactions to information.
However, succeeding in this space requires precision, speed, and understanding of cross-market correlations. What began as a manual strategy has now evolved into a highly automated, algorithm-driven endeavor dominated by institutions.
In essence, time zone arbitrage is the art of turning time itself into a tradable asset—where every second counts, and every sunrise in Tokyo or sunset in New York opens a new chapter of global opportunity.
THE NEXT MOVE WILL BE PARABOLIC! CRYPTO GOING TO FOLLOW!We are in a bubble phase, the next move will be big until start of Q2 2026.

Is this real or not? SP500 and VIXA quick overview. SPY now under it's 18ma. Vix breaking out and holding above 18 dollars is an ominous sign. High Yield continues to fall. Gold probably makes another high.

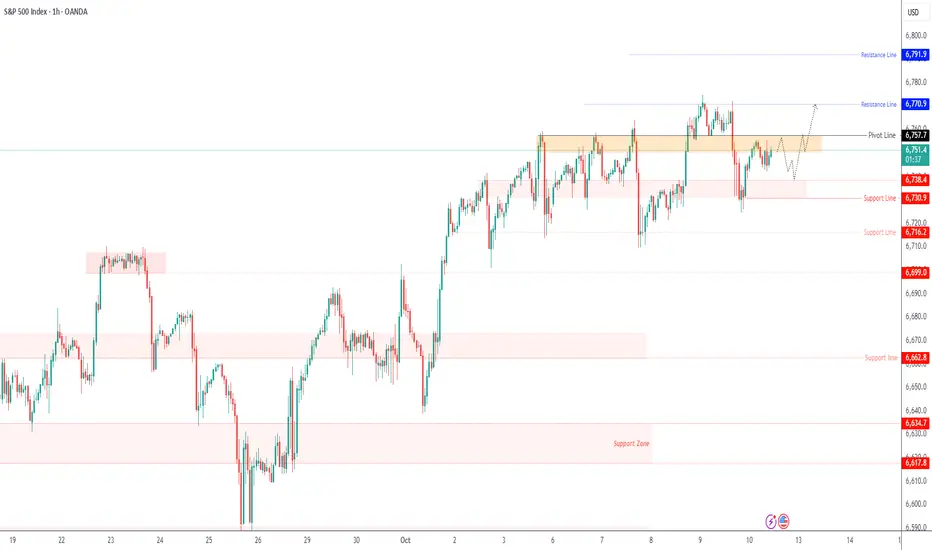
SPX500 – Futures Rebound Amid Shutdown Uncertainty and AI RepricSPX500 – Overview | Futures Rebound After Market Pullback
U.S. stock futures edged higher on Friday after the S&P 500 and Nasdaq Composite retreated from record highs.
Investors are re-evaluating the AI-driven rally, rate-cut expectations, and the ongoing government shutdown, now entering its ninth day.
The shutdown’s continuation delays key U.S. economic data releases, increasing uncertainty around the Federal Reserve’s policy outlook.
Technical Outlook
The price tested its support zone and rebounded, but momentum remains mixed.
To confirm renewed bullish strength, SPX500 must break above 6,757, which would open the way toward 6,770 → 6,791.
As long as the price trades below 6,757, short-term bearish pressure may persist toward 6,738 → 6,730.
A confirmed break below 6,730 would extend the correction toward 6,716 and signal further downside potential.
Pivot Line: 6,757
Resistance: 6,770 · 6,791
Support: 6,738 · 6,730 · 6,716
Summary:
SPX500 is consolidating after the pullback, with near-term bias depending on a break of 6,757 or 6,730.
Traders should expect volatility as the shutdown drags on and the market reassesses Fed policy expectations.
S&P 500 & the Presidential Cycle: Bear Market in 2026?The U.S. presidential cycle is a cyclical approach to the stock market suggesting that S&P 500 performance tends to follow a recurring pattern over the four years of a presidential term. This cycle reflects the relationship between political decisions, fiscal and monetary policy, and investor psychology.
Historically, the first year of the term (post-election) is marked by economic and fiscal adjustments, often accompanied by moderate gains. The second year, known as the “midterm year,” is usually more hesitant: markets tend to be volatile amid political uncertainty and potential unpopular reforms.
This second year of the presidential cycle is typically the weakest of the four and the most prone to a significant S&P 500 consolidation — corresponding in our case to the year 2026.
In contrast, the third year of the term almost always stands out as the most favorable for equities, as the administration seeks to boost growth ahead of the next election campaign, often through more accommodative fiscal or monetary measures. Finally, the fourth (election) year tends to remain positive on average, although performance often flattens as electoral uncertainty increases.
From this perspective, 2026 will mark the second year of Donald Trump’s presidential cycle — traditionally the most fragile for equity markets. From a technical standpoint, the S&P 500 has recently reached major resistance zones near its historical highs after a strong post-election rally. Several momentum indicators now show signs of exhaustion, while Shiller’s P/E ratio stands at historically elevated levels, indicating stretched valuations.
In this context, it is plausible that 2026 will bring a phase of consolidation for the S&P 500, or even a more pronounced correction. Institutional investors may adopt a more cautious stance, awaiting greater clarity on fiscal trajectories, Federal Reserve rate policy, and the impact of new government measures. This cooling phase would be natural after several years of sustained growth and could form a healthy foundation for the next bullish impulse, traditionally observed ahead of the pre-election year — 2027.
DISCLAIMER:
This content is intended for individuals who are familiar with financial markets and instruments and is for information purposes only. The presented idea (including market commentary, market data and observations) is not a work product of any research department of Swissquote or its affiliates. This material is intended to highlight market action and does not constitute investment, legal or tax advice. If you are a retail investor or lack experience in trading complex financial products, it is advisable to seek professional advice from licensed advisor before making any financial decisions.
This content is not intended to manipulate the market or encourage any specific financial behavior.
Swissquote makes no representation or warranty as to the quality, completeness, accuracy, comprehensiveness or non-infringement of such content. The views expressed are those of the consultant and are provided for educational purposes only. Any information provided relating to a product or market should not be construed as recommending an investment strategy or transaction. Past performance is not a guarantee of future results.
Swissquote and its employees and representatives shall in no event be held liable for any damages or losses arising directly or indirectly from decisions made on the basis of this content.
The use of any third-party brands or trademarks is for information only and does not imply endorsement by Swissquote, or that the trademark owner has authorised Swissquote to promote its products or services.
Swissquote is the marketing brand for the activities of Swissquote Bank Ltd (Switzerland) regulated by FINMA, Swissquote Capital Markets Limited regulated by CySEC (Cyprus), Swissquote Bank Europe SA (Luxembourg) regulated by the CSSF, Swissquote Ltd (UK) regulated by the FCA, Swissquote Financial Services (Malta) Ltd regulated by the Malta Financial Services Authority, Swissquote MEA Ltd. (UAE) regulated by the Dubai Financial Services Authority, Swissquote Pte Ltd (Singapore) regulated by the Monetary Authority of Singapore, Swissquote Asia Limited (Hong Kong) licensed by the Hong Kong Securities and Futures Commission (SFC) and Swissquote South Africa (Pty) Ltd supervised by the FSCA.
Products and services of Swissquote are only intended for those permitted to receive them under local law.
All investments carry a degree of risk. The risk of loss in trading or holding financial instruments can be substantial. The value of financial instruments, including but not limited to stocks, bonds, cryptocurrencies, and other assets, can fluctuate both upwards and downwards. There is a significant risk of financial loss when buying, selling, holding, staking, or investing in these instruments. SQBE makes no recommendations regarding any specific investment, transaction, or the use of any particular investment strategy.
CFDs are complex instruments and come with a high risk of losing money rapidly due to leverage. The vast majority of retail client accounts suffer capital losses when trading in CFDs. You should consider whether you understand how CFDs work and whether you can afford to take the high risk of losing your money.
Digital Assets are unregulated in most countries and consumer protection rules may not apply. As highly volatile speculative investments, Digital Assets are not suitable for investors without a high-risk tolerance. Make sure you understand each Digital Asset before you trade.
Cryptocurrencies are not considered legal tender in some jurisdictions and are subject to regulatory uncertainties.
The use of Internet-based systems can involve high risks, including, but not limited to, fraud, cyber-attacks, network and communication failures, as well as identity theft and phishing attacks related to crypto-assets.

US500 Remains BullishUS500 is currently near record levels. The index maintains robust overall performance, with monthly and yearly gains standing above +3.00% and +15%, respectively. This strength is fundamentally driven by broad based bullish sentiment, confidence in strong corporate results, and particularly the ongoing technology sector leadership and AI-related dealmaking, which recently propelled the index to new all-time highs.
Fundamental Analysis
The market's optimism is tempered by underlying caution. Persistent inflation in the services sector remains a key concern, fueling expectations that the Federal Reserve may be compelled to keep interest rates higher for longer, a factor that could limit short-term upside momentum. Despite this, the index's current technical posture remains positive.
Technical Analysis
From a technical perspective, the US500 is in a strong upward trend, but the index is showing signs of being overbought after its recent surge. The immediate key support level is noted at 6,570 points. Looking ahead expect the bullish momentum to continue in the medium term, targeting 6,805 as the next potential resistance milestone. Conversely, the index might enter a period of consolidation or retreat, with projections near 6,485 points and a possible longer-term below 6,000.

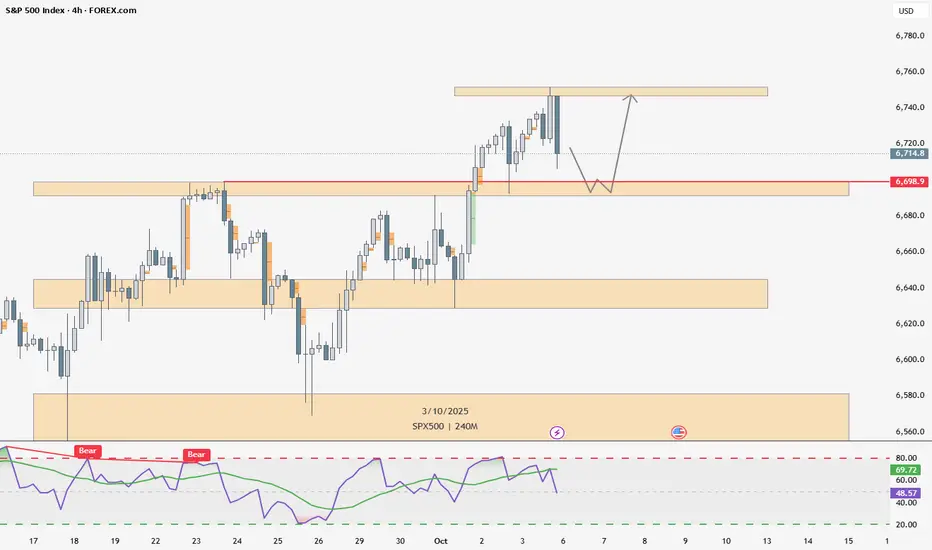
SPX500 Analysis SPX500 Analysis 📈
On the daily timeframe, SPX500 has broken the previous Higher High (6698.9), creating a new Break of Structure (BOS).
On the 4H chart, price is currently making a bearish retracement — I expect it could pull back into the demand zone between 6698.9 and 6691.4.
I’m waiting for confirmation to go long from that area,
with a target at the upper supply zone between 6751.8 and 6746.9
US500 SELL?Market has been bullish for a long time, and there seems to be a possible reversal on daily.
Based on 4HR TF, the market seems to be forming a possible reversal pattern which could lead to a possible reversal.
We could see SELLERS coming in strong should the current level hold.
Disclaimer:
Please be advised that the information presented on TradingView is solely intended for educational and informational purposes only.The analysis provided is based on my own view of the market. Please be reminded that you are solely responsible for the trading decisions on your account.
High-Risk Warning
Trading in foreign exchange on margin entails high risk and is not suitable for all investors. Past performance does not guarantee future results. In this case, the high degree of leverage can act both against you and in your favor


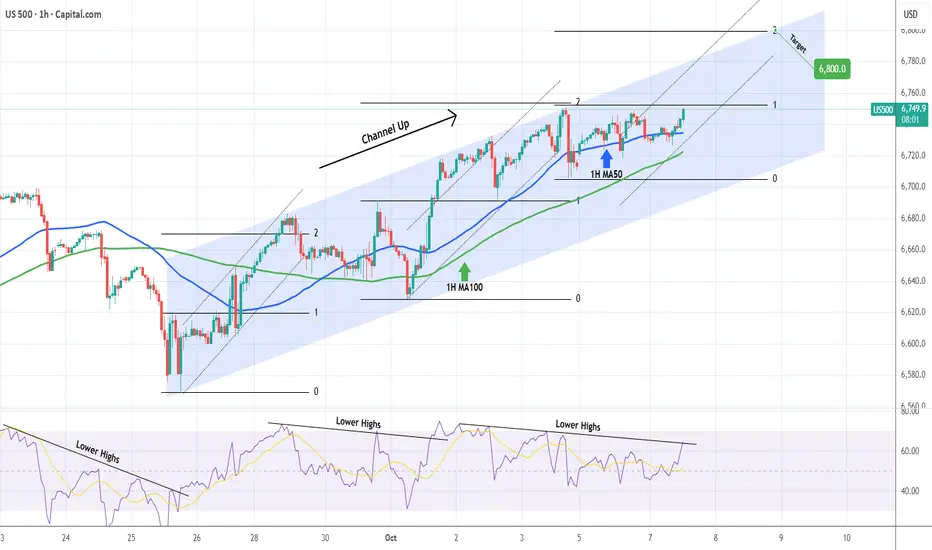
S&P500 Found the Support it needed for 6800.The S&P500 index (SPX) gave us an excellent bottom buy signal last week (September 30, see chart below), rebounding straight after and quickly hitting our 6720 Target:
This time we focus on a much shorter term Channel Up pattern that has emerged, which has just given us another buy signal as it is currently bouncing on its 1H MA50 (blue trend-line).
As long as the 1H MA100 (green trend-line) holds and the 1H RSI breaks above its Lower Highs trend-line, we expect the index to seek a new Higher High on the 2.0 Fibonacci extension at 6800.
-------------------------------------------------------------------------------
** Please LIKE 👍, FOLLOW ✅, SHARE 🙌 and COMMENT ✍ if you enjoy this idea! Also share your ideas and charts in the comments section below! This is best way to keep it relevant, support us, keep the content here free and allow the idea to reach as many people as possible. **
-------------------------------------------------------------------------------
💸💸💸💸💸💸
👇 👇 👇 👇 👇 👇