Bulls don't get too comfortable....fundamentals still not goodHave been tracking the swings recently and macros and it's worth noting that the fundamentals of the economy are still weak. The upcoming rate reduction is already priced in, and it won't change the employment / defaults / private credit environment and inflation. Expect a dip very very soon and red across the board. The economy is being propped up with hot air and it's just not sustainable. All the macros are screaming red and people are ignoring until it's too late.
#SQQQ could be an interesting hedge, but would pull out now from any long positions as the AI bubble is showing big cracks and people are deciding to look the other way until they get wiped out.
Trade ideas
The Bears last standThis level and slightly higher needs to hold otherwise we're going to test the highs and possibly go much further. If there is no reversal today, we will be closing over the 18ma for two days in a row and that is certainly bullish. The Vix needs to get over 20 for a reversal to start having legs. Gold is just sideways. Oil is coiling up for a larger move - possibly down. BTC looks like it can go lower.

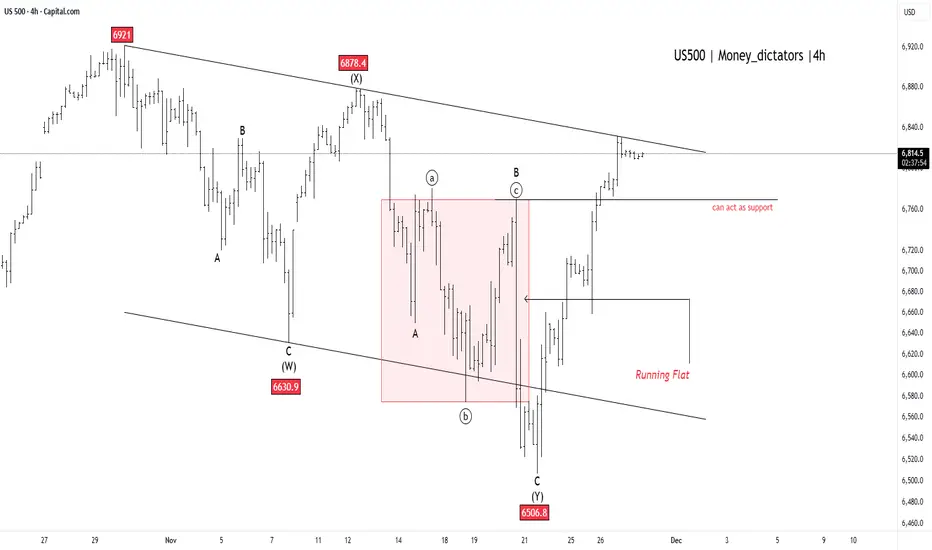
US500 - Breakout to New All-Time Highs!US500 suggests the market has put a definitive end to its recent downward movement, signaling that a major bullish trend is set to continue. This complex correction, which the chart labels as complete at the 6506.8 low, looks resolved. The index has since staged a powerful rebound and is currently pressing right up against the major upper trendline resistance, which defined the limits of the entire corrective phase.
A clear and sustained move above this key trendline will provide final confirmation that the correction is over and that a significant new upward wave has begun. The previous area of congestion around 6760 is now expected to act as strong support for the index, preventing any minor pullbacks from turning into a deeper decline. With the current price around 6,812.61 and the all-time high at 6,920.34 , the index is technically well-positioned to challenge and surpass this record high soon.
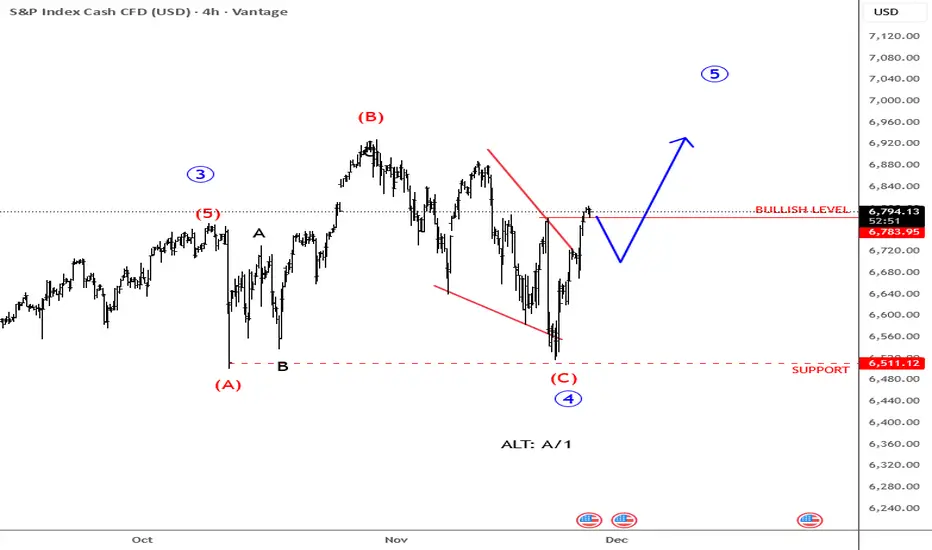
SP500: Ready to Break Out and Forge New All-Time Highs S&P 500 indicates that the recent complex downward correction is complete, having bottomed at 6501.7.
The market is currently rallying and is testing the major upper trendline resistance. The analysis projects a minor, temporary pullback to gather momentum, potentially to the 6775.0 area. Following this consolidation, a decisive breakout above the trendline is anticipated. This will confirm the launch of a major new upward wave, expected to drive the S&P 500 to new all-time highs above 6928.
Stay Tuned :)
@Money_Dictators

SP500 Resumes The Uptrend After Bears Stops At Key LevelUS stock market moved lower recently, and we’ve seen one of the biggest declines in the last few months, with lower highs and lower swing lows for the last couple of weeks, but there is still a chance that this is basically a diagonal formation on SP500, either in wave C or alternatively already in wave A or wave 1. But so far looks more like a completed C wave of a flat due to the current strong rebound, which can be the beginning of a new wave 5 headed towards new highs; What’s important in the near future, in our opinion, is that as long as the market trades above 6512 support, there is a real chance that there will be more upside in the near-term. At least three wave rally is what I would be looking for.
GH
SPX500: Tight Consolidation Before Breakout — Key Levels AheadSPX500 | Technical Overview
New York Fed President John Williams signaled Friday that a near-term rate cut is still possible, noting that labor-market weakness is now a greater risk than inflation.
Traders have increased the odds of a 25 bps December rate cut to 69%, up from 44% a week ago.
Technical Outlook
SPX500 remains volatile, but the broader momentum still leans bearish.
Price is currently consolidating between 6635 and 6610, waiting for a clear breakout direction.
A 1H or 4H close below 6610 will strengthen the bearish trend toward 6578, with further downside possible.
A break and stability above 6635 would open the door for a move toward 6670, and later 6705.
Key Levels
Support: 6610 · 6579 · 6507
Resistance: 6635, 6670 · 6704

Hellena | SPX500 (4H): LONG to resistance area of 6775.Dear colleagues, according to the last forecast the price is at the support level, but as it turned out, the correction in wave “4” is a bit more complicated than I thought.
Wave “4” consists of three waves “ABC” and should be over soon. The upward movement is still in priority, but I will target the not so distant resistance area of 6775.
Once it is reached, we will think about how to reach higher levels.
Manage your capital correctly and competently! Only enter trades based on reliable patterns!

SPX500: Thanksgiving Range — 6815–6842 Controls the MarketOANDA:SPX500USD continued to push higher exactly as projected yesterday.
Market activity is expected to be quieter today due to the Thanksgiving holiday, which typically reduces volatility across U.S. indices.
Technical Outlook
For today, the price is likely to consolidate between 6815 and 6842 until a breakout occurs.
Bearish Scenario:
A 1H close below 6813 will open the path toward 6771, with 6797 acting as the first reaction zone.
Bullish Scenario:
While trading above 6813, the price may retest 6842, and a break above this level could extend toward 6870.
Pivot Line: 6813
Support: 6797 · 6771
Resistance: 6842 · 6870

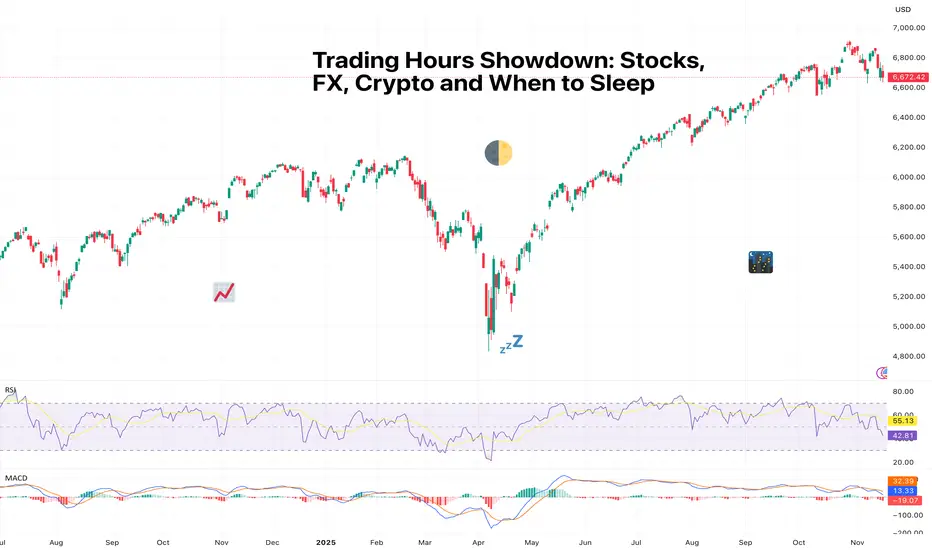
Trading Hours Showdown: Stocks, FX, Crypto and When to SleepSome markets close, some don’t, and some don’t care that you need rest.
If financial markets were people, they’d each have wildly different sleeping habits. Stocks tuck themselves in usually at 4 p.m. (that is, where they originate from), FX stays up all night but insists it’s “fine,” and crypto is that friend who messages you at 3 a.m. with a life-changing idea (and a 12% move for fun).
Understanding when each market is awake, liquid, and volatile is one of the most underrated skills a trader can have. It’s not just about timing entries; it’s about managing risk while you’re away from your devices.
Let’s break down the global sleep schedule and why your portfolio should care.
🌅 Stocks: The 9-to-5ers of the Financial World
US stocks like routine. They open at 9:30 a.m. ET, close at 4 p.m., and observe weekends and holidays like well-behaved citizens.
There’s also pre-market and after-hours trading, but liquidity dries up real fast and moves tend to be exaggerated.
Why it matters:
Limited hours = overnight gap risk
Most volume typically happens in the first and last 30 minutes
Big news after hours can cause violent opens the next day
Stops can’t protect you when price jumps over your level
Every trader eventually experiences the heartbreak of a perfect setup ruined by an overnight earnings surprise. Consider it a rite of passage.
🌍 Forex: The Market with No Bedtime
FX ( forex or foreign exchange) trades 24 hours a day, five days a week, rotating through global sessions:
Asia (Tokyo)
Europe (London)
US (New York)
That’s a 120-hour work week with no break. Think of it like a global relay race where someone is always awake and analyzing inflation differentials.
Why traders love it:
Continuous liquidity = fewer gaps
Beautiful macro-driven trends
Volatility waves follow session overlaps (London–NY especially)
But…
FX weekends could be silent killers. You’re unprotected from Friday close to Sunday open. That’s plenty of time for geopolitical headlines, surprise events, central bank drama, or a country deciding to unpeg its currency.
🔥 Crypto: The Market That Never Sleeps or Blinks
The cryptocurrency market trades 24/7/365. No days off, no weekends, no holidays, no rest. Just pure, unfiltered price action around the clock.
This sounds great until you realize you can never fully unplug. Bitcoin BITSTAMP:BTCUSD does not respect your circadian rhythm.
Why it’s unique:
No “overnight gaps” because it never closes
But liquidity gaps may appear during low-volume hours
Late-night moves can be extreme due to thin order books
Leverage unwinds can trigger liquidation cascades at 3 a.m.
Global retail participation exaggerates emotional spikes
Crypto doesn’t gap like stocks, but it drifts, snaps, and rips through levels and can make your stomach churn.
🧭 Liquidity: The Real Story Behind the Sleep Schedule
Across markets, the one concept that ties them all together is liquidity. That is, how deep the order book is and how efficiently your trades can execute.
Stocks
Thick liquidity during US hours
Thin, jumpy after-hours
Prone to large news-driven gaps
Forex
Deep liquidity almost 24 hours a day
Most volume during London–NY overlap
Macro news instantly reflected in price
Crypto
Liquidity pockets vary wildly
Exchanges differ in depth
Weekends and Asia-over-US crossovers can trigger whipsaws
😴 The Question of Sleep (And How Traders Manage It)
Traders eventually learn a few things about trading various asset classes.
If you:
Hate surprises → Avoid overnight stock positions
Love macro trends → FX is your playground
Enjoy volatility → Crypto keeps things interesting
Value sleep → Choose an asset class that aligns with your time zone and day trade it
Choosing a market to trade isn’t just about your strategy, but also about your lifestyle.
Volatility doesn’t just depend on the asset. It depends on when you’re watching.
Off to you : How do you deal with trading different assets in different time zones? Are you a niche player or a broader market maven? Share your comments below!
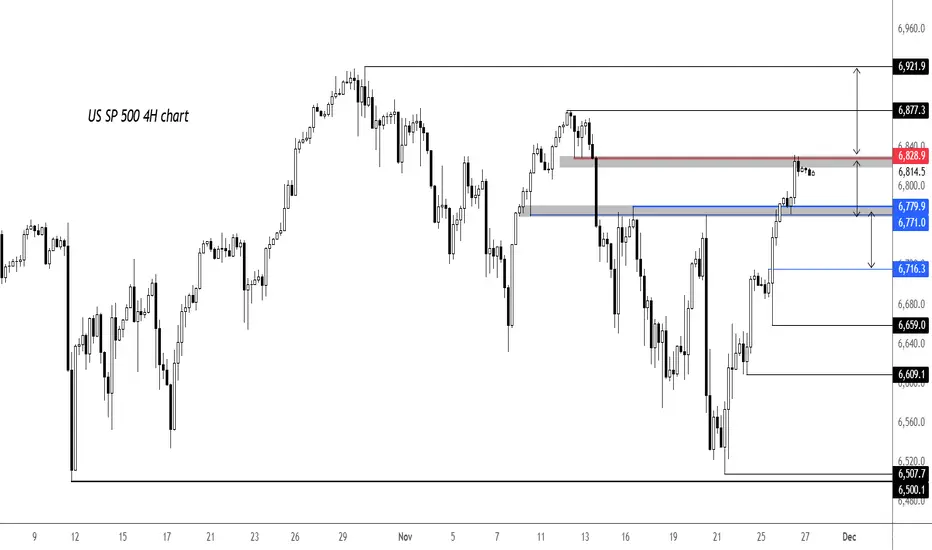
S&P 500 levels to watchFollowing the big recovery, lots of short-term levels have been reclaimed this week but with US markets closed today, index futures have been fairly quite and easing back down ever so slightly. Key support is now seen around 6771-6780 on our US SP 500 chart (derived from the underlying ES prices). Below that, 6716 is the next support. Bulls will get in trouble if 6659 - most recent low - breaks. On the upside, 6829 is first hurdle, marking the point of origin of the previous drop. Ideal location for the bears to step back in if they want to regain control of price action. Lose that, 6877 is next upside target then the all time high at 6922.
By Fawad Razaqzada, market analyst with FOREX.com
Don’t Let Panic Drive Your Decisions, The Market Reward PatienceDon’t Let Panic Drive Your Decisions — Because The Market Rewards Patience
The last few days in the S&P 500 were the perfect reminder of how quickly sentiment swings — and how dangerous emotional trading can be.
* Nov 20: Headlines screamed about an “AI Bubble Burst,” triggering panic selling.
* By Nov 21: Market declined +3.5%, wiping over $2 trillion in market value.
* By Nov 26: The same market recovered $2.6 trillion, pushing the S&P 500 back above 6800
* S&P 500 is now just 1.6% away from all-time highs (6921).
Anyone who sold in fear on Nov 20–21 is now sitting on regret, while disciplined investors who stayed calm are comfortably in profit.

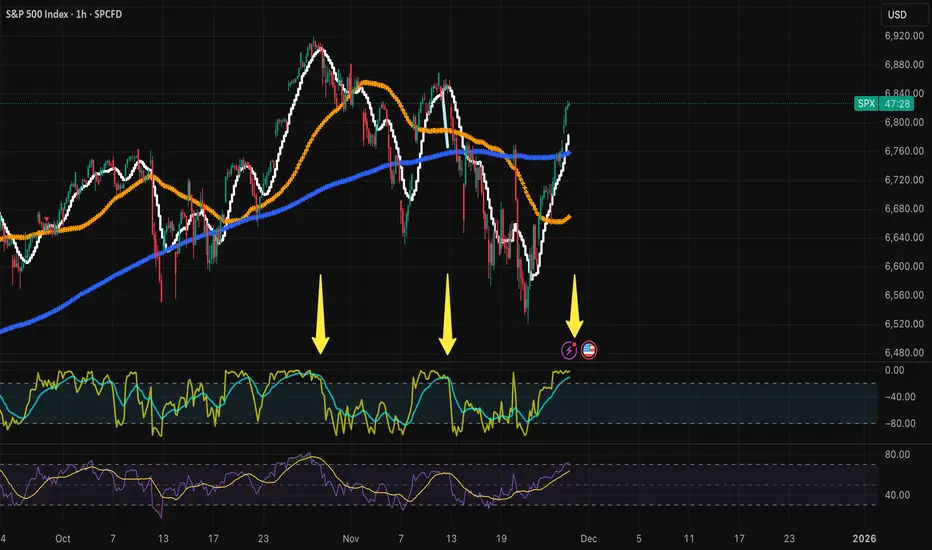
Bullish S&P 500 - Elliott Wave Count The S&P 500 (SPX) decline since 10/29/25 has the choppy look of an Elliott wave – Double Zigzag correction. If this wave count is correct, it implies the SPX could rally in the last week of November 2025.
Intraday momentum supports this theory. The 30 – minute RSI has several bullish divergences going into the bottom made on 11/21/25. This implies selling has exhausted.
Upside price action could occur in the next few trading days.

The S&P 500: The Last Stand Into Year-EndThe 2025 bull market has culminated as presented in my previous post.
The major structure topped on October 28th, with a secondary, weaker high on November 12th. What remains now is the distribution phase into the final weeks of the year—where the market decides whether it will stabilize and potentially from a double top or begin its descent into 2026.
1. Location in Structure
Price is currently trading beneath the declining angle drawn from the October and November tops.
This angle declines at $4 per day, and has acted as the defining rhythm of the post-top decline.
Top of the year: October 28
Lower high: November 12
Current position: Beneath the angle → inside potential distribution
2. The Two Paths
The market has two paths from here:
A. Bullish Path — December Rally Trigger
To challenge the November 12th high, the S&P must close above the angle.
A confirmed break of the angle → opens the path to
📈 6,860 in the first week of December
This would represent a counter-trend rally back into the underside of the broader 2025 cycle structure.
B. Bearish Path — Rejection = Lower Prices
If price rejects at the angle, it signals:
distribution is underway
momentum remains weak
the November highs are secure as the final secondary top
In this case, lower prices into December follow naturally.
3. The Message of the Structure (And more Charts to keep up on)
The larger cycle has already ended.
We are now watching the small-scale geometry that governs how the year will close:
beneath the angle → distribution
above the angle → December rally
SUMMARY
What remains now is the micro-geometry that will determine how the year closes:
Beneath the declining angle → distribution continues
Above the angle → a December rally opens toward 6,860
While the market could attempt to press toward new highs, the probability is very low — and would be surprising given the current economic backdrop and the clear contraction emerging from a dominant sector of the market.
The structure, motion, and fundamentals all argue that the 2025 peak is already in.

Bearish Shark - Retest All time highs? Speculating on another run up to retest all time highs for OANDA:SPX500USD before capitulation or significant retracement event, depending on rate cuts and or QE news of course.

$SPX - Turkey WeekI made this turkey with my strong hand:
Bulls seek to close >6700
Bears seek to contain <6700, IDEALLY <6600
OUTLOOK = choppy, bumpy, and fun - keep it small, keep it tight like a tiger
Feel free to comment or add input 💪
Inside modified pitchfork anchors on macro
cyan trend line = .618
fusia = median
LARGER TF POSTED BELOW

$SPX next move higherSP:SPX 5510 is my short TP level and level to go long. It hit perfectly on Friday and now we are 200 points higher. Price action is still bullish (despite the bearish weekly candle last week). 5826 is next magnetic level. And a break above the trendline will see ATH before next of year.
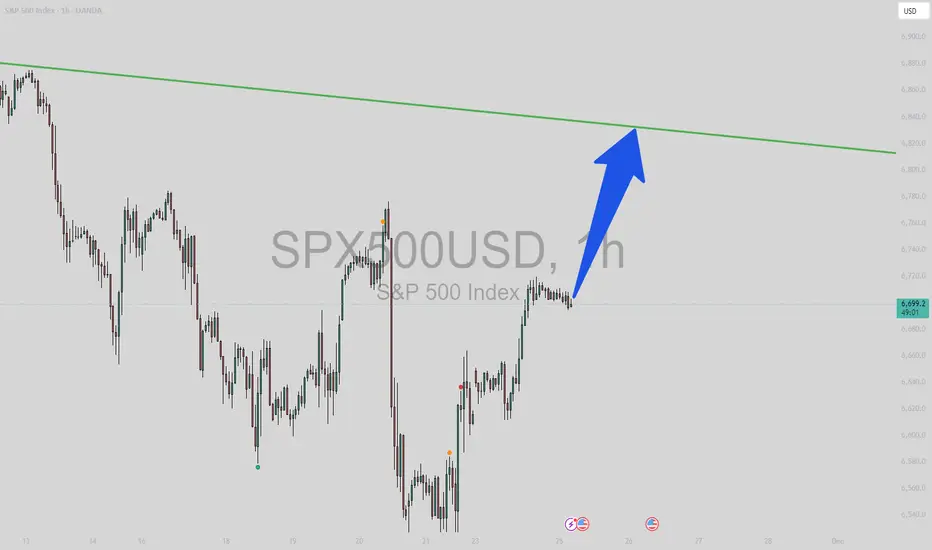
More upside for SPX500USDHi traders,
Last week SPX500USD went up again just as I've said in my previous outlook.
Next week we could see a correction down and more upside for this pair.
Let's see what the market does and react.
Trade idea: Wait for a correction down. After a change in orderflow to bullish you could trade longs.
This shared post is only my point of view on what could be the next move in this pair based on my technical analysis.
But I react and trade on what I see in the chart, not what I've predicted or expect.
Don't be emotional, just trade your plan!
Eduwave

S&P 500 – DTF Technical & Fundamental AnalysisS&P 500 – DTF Technical & Fundamental Analysis
⚠️ S&P 500 Update – Short-Term Bullish, But Overall Structure Shows Weakness
The S&P 500 recently experienced a short-term bullish move after retesting the key support level at 6,500, which is now acting as a major support following the reversal. This rally was largely driven by major technology and AI-related firms, especially Alphabet. Strong earnings and leadership in generative AI have boosted investor confidence, propelling the index to new highs.
Despite this, technical factors suggest caution. On the daily timeframe, the overall market structure after the bullish trend is forming lower highs and lower lows, indicating that buyers are losing momentum. This rally could be temporary, largely representing liquidity grabs above previous highs rather than a true trend reversal. From a technical perspective, 6,500 is a critical support zone. If this level holds, the S&P 500 could continue the short-term bullish move. However, if this level breaks with high volume, a deeper correction may follow, potentially targeting the next major demand zone around 6,370.
The market remains highly reactive to both technical triggers and fundamental news, so caution is advised. Watch key levels closely and wait for confirmed structure before taking positions.
⚠️ Risk Disclaimer
This analysis is for educational purposes only and is not financial advice. Trading CFDs and Forex involves high risk. Always trade responsibly and manage your risk.

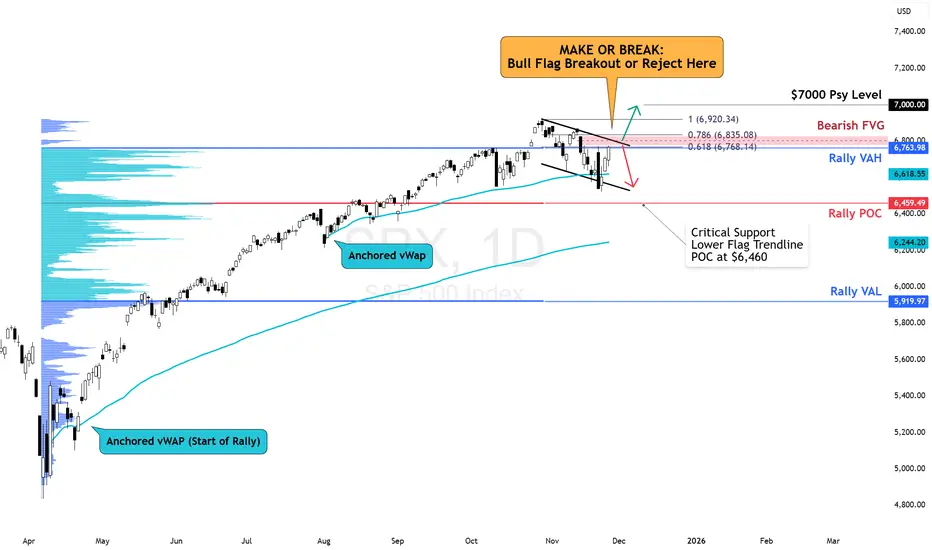
SPX Make or Break: Bull Flag or FVG RejectionSPX is in a make or break situation. Break this bull flag, and we could head header to touch the $7,000 psychological level. Reject here, and we could see lower at $6,500.
After reclaiming the anchored vWAP, SPX is pushing into a stacked zone of resistances:
Upper Bull Flag trendline
Bearish Fair Value Gap
0.618 Fib Retracement
Upside trigger:
– Break and hold above the FVG + 0.786 (≈ 6835–6920).
– Target = retest of highs / 7000.
Downside trigger:
– Failure at FVG
- Breakdown of bull flag
- Move towards Rally POC at 6459
S&P500 - US markets closed, liquidity thinUS Thanksgiving Holiday
US markets closed, liquidity thin globally.
Expect muted volumes, potential for exaggerated moves in FX and rates due to reduced participation.
Key Support and Resistance Levels
Resistance Level 1: 6830
Resistance Level 2: 6848
Resistance Level 3: 6866
Support Level 1: 6770
Support Level 2: 6756
Support Level 3: 6735
This communication is for informational purposes only and should not be viewed as any form of recommendation as to a particular course of action or as investment advice. It is not intended as an offer or solicitation for the purchase or sale of any financial instrument or as an official confirmation of any transaction. Opinions, estimates and assumptions expressed herein are made as of the date of this communication and are subject to change without notice. This communication has been prepared based upon information, including market prices, data and other information, believed to be reliable; however, Trade Nation does not warrant its completeness or accuracy. All market prices and market data contained in or attached to this communication are indicative and subject to change without notice.

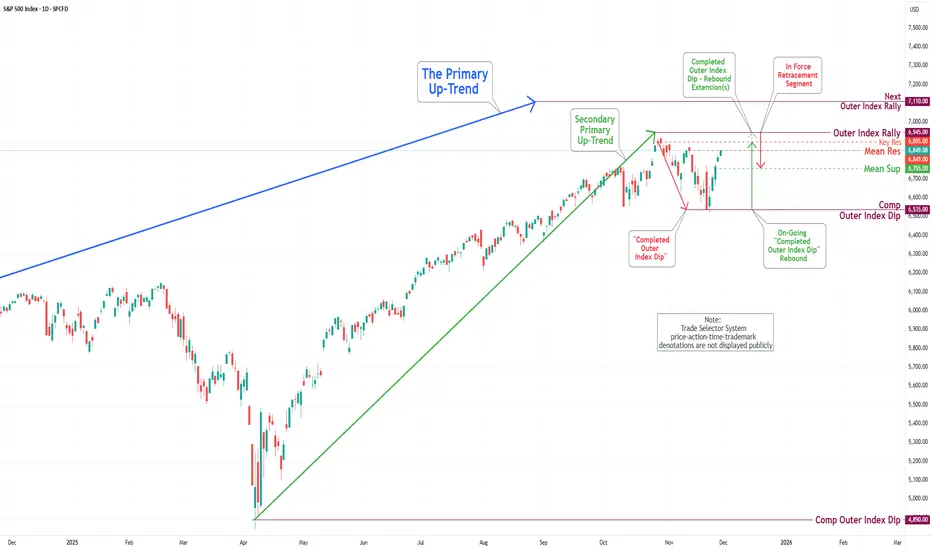
S&P 500 Daily Chart Analysis For Week of Nov 28, 2025Technical Analysis and Outlook:
In this abbreviated weekly trading session, influenced by a significant U.S. holiday and a cooling issue at the CyrusOne data centers at CME, the S&P 500 Index posted notable gains, reaching our primary target, the Mean Resistance at 6,849.
At present, this position suggests the potential for further upward movement, with primary targets established for a continuation of the robust trend toward Key Resistance at 6,895, followed by an extended target identified as the Outer Index Rally at 6,945.
Nevertheless, it is crucial to recognize that, given the prevailing market dynamics, there exists a considerable likelihood of an In-Force pullback from the aforementioned price targets.
US500 Bullish: Entry: 6,700 – 6,720US500 – Institutional Intraday Analysis (Athena Protocol v7.3)
Exchange: IC Markets
Current Price: ~6,791.00
Current Time: 01:57 UTC-5
Timeframe: 90m
1. Market Bias: Bullish (but overstretched and vulnerable to a liquidity tap)
Bias Explanation
This chart screams: “Yes, we are bullish, but please… someone sweep me properly before I continue.”
Let’s break it down.
Goldbach Levels
Strong PO3 clustering around 6561 and 6723–6804, but price is now far above these baselines.
– Algo signals on the 27 and 81 rows: BR → FV, RB → OB, -RB → -OB
These represent continuation patterns, not reversal ones.
– The 243 & 729 rows show FV → MB and LV → -LV, again supportive of continuation after retracement.
Conclusion: Goldbach models favor bullish continuation after a pullback.
They do not support longing at current highs.
Visible Range Volume Profile
– Major HVN at ~6,690–6,720
– Low-volume void above price → explains the straight-line rally.
– But current price at 6,791 is sitting in a thin-volume zone = susceptible to deep intraday pullbacks.
Session Volume Profile
– Sessions are printing higher Value Area Highs and Lows → trending structure.
– But today’s session POC is lagging behind price → inefficiency = retracement likely.
CVD
– CVD is flat-to-slightly declining despite price rising.
This is one of Athena’s biggest red flags:
Displacement not supported by real buy flow = engineered move.
COT (Non-Commercial USD positions)
Massively bearish sentiment:
– % Short = 73%
– Net positions = –14,933, worsening from –13,145
– Big players increased shorts, decreased longs.
This is why pullbacks on US500 have been savage lately.
Macro Snapshot
– FOMC cautious but not dovish; market pricing soft-landing narrative.
– Trump’s fiscal plans support equities short-term.
– But rising Middle East tensions + Treasury issuance linger as downside catalysts.
Overall Bias: Bullish trend, but the smarter long is taken after the sweep.
2. Key Interpretation
– Market is too high, too fast.
– CVD + COT warn that this pump is weak-handed.
– Volume profile signals a retest toward 6,720 or even 6,660 before further rally.
Bias: BUY ONLY — but only after liquidity raids.
Not at the highs. Never at the highs. Not even if you’re feeling lucky.
3. Smart Money Buy Levels
A. Aggressive Buy Limit
Entry: 6,745 – 6,755
SL: 6,708
TP1: 6,793
TP2: 6,820
TP3: 6,855
Rationale:
– First micro-inefficiency beneath current structure.
– Will likely fill on the first intraday pullback.
– Partial mitigation of the OB at the current high.
Win Probability: ~58%
Works if momentum continues without deep sweep.
B. Conservative Buy Limit (Primary Institutional Level)
Entry: 6,700 – 6,720
SL: 6,660
TP1: 6,780
TP2: 6,815
TP3: 6,860
Rationale:
– This is the visible range HVN and prior volume shelf.
– The ideal level where algos reload.
– Matches Goldbach’s 81 PO3 level + session POC cluster.
Win Probability: ~72%
Most reliable for today’s trading.
C. Very Safe Buy Limit (Institutional Raid Zone)
Entry: 6,645 – 6,660
SL: 6,588
TP1: 6,720
TP2: 6,780
TP3: 6,840
Rationale:
– Deep sweep of equal intraday lows.
– Cleans out all short-term long stops.
– Aligns with Goldbach 729 and 243 baseline structures.
– Best RR, but may not fill unless NY session gets heavy liquidity injection.
Win Probability: ~81%
The highest-probability setup but lowest fill probability.
4. Why These Plays Work
Technical Confluence
– US500 is extended into low-volume weeds.
– CVD shows buyers exhausted.
– Goldbach signals agree with continuation but ONLY after the retrace.
– Volume profiles indicate untested demand zones below.
Macro Confluence
– Equities remain favored but heavily crowded.
– Short-term short squeeze may have just finished.
– COT data screams: “Market too high. Needs a flush.”
So we wait… and buy the flush.
5. Best Trading Session
– London AM → NY Opening Range
These sessions consistently deliver the retracements US500 refuses to give in Asia.
6. Athena’s Final Words
US500 right now is like a caffeinated intern: sprinting full-speed without checking whether their shoelaces are tied.
Spoiler: they’re not.
Let the kid trip, scoop up the dip, and ride the rebound.
This is educational analysis, not financial advice.

Will SPX Make New All Time Highs? We dive into the recent technical setup of the S&P500.
We are on the verge of triggering a new massive bullish patterns.
The backdrop of soft commodities. soft yields, softer dollar and the December 10 rate cute.
We have the tailwinds in place for higher price.
I would like to see some sideways chop to make this rally more sustainable, but bull market bounces are very fierce especially when they come from failed bearish patterns.
