S&P 500 Wave Analysis – 21 November 2025
- S&P 500 index reversed from strong support level 6555.00
- Likely to rise to resistance level 6800.00
S&P 500 index recently reversed from support area between the strong support level 6555.00, lower daily Bollinger Band and the 50% Fibonacci correction of the upward impulse from August.
The upward reversal from the support level 6555.00 stopped the previous minor ABC correction 2 from the end of October.
Given the clear daily uptrend, S&P 500 index can be expected to rise to the next resistance level 6800.00 (former top of wave (3) from October).
Trade ideas

S&P500 H4 | Bearish Reaction off Key ResistanceMomentum: Bearish
Price is currently below the ichimoku cloud.
Sell entry: 6,706.19
- Strong pullback resistance
- 61.8% Fib retracement
- 100% Fib projection
Stop Loss: 6,790.06
- Swing high resistance
Take Profit: 6,602.91
- Swing low support
High Risk Investment Warning
Stratos Markets Limited (tradu.com/uk ), Stratos Europe Ltd (tradu.com/eu ):
CFDs are complex instruments and come with a high risk of losing money rapidly due to leverage. 70% of retail investor accounts lose money when trading CFDs with this provider. You should consider whether you understand how CFDs work and whether you can afford to take the high risk of losing your money.
Stratos Global LLC (tradu.com/en ): Losses can exceed deposits.
Please be advised that the information presented on TradingView is provided to Tradu (‘Company’, ‘we’) by a third-party provider (‘TFA Global Pte Ltd’). Please be reminded that you are solely responsible for the trading decisions on your account. Any information and/or content is intended entirely for research, educational and informational purposes only and does not constitute investment or consultation advice or investment strategy. The information is not tailored to the investment needs of any specific person and therefore does not involve a consideration of any of the investment objectives, financial situation or needs of any viewer that may receive it. Past performance is not a reliable indicator of future results. Actual results may differ materially from those anticipated in forward-looking or past performance statements. We assume no liability as to the accuracy or completeness of any of the information and/or content provided herein and the Company cannot be held responsible for any omission, mistake nor for any loss or damage including without limitation to any loss of profit which may arise from reliance on any information supplied by TFA Global Pte Ltd.

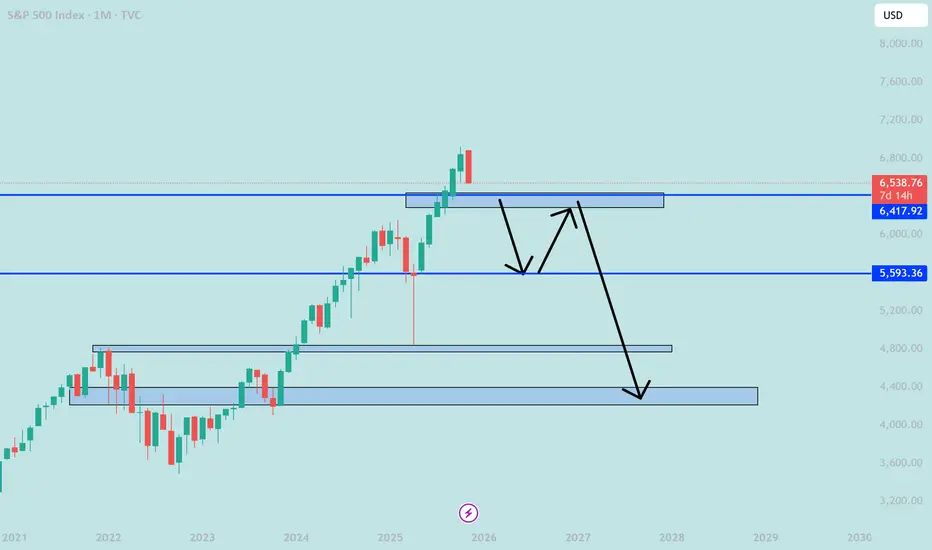
monitoring SPX 6400 supportmonitoring SPX 6400 support
prepare for recession next year
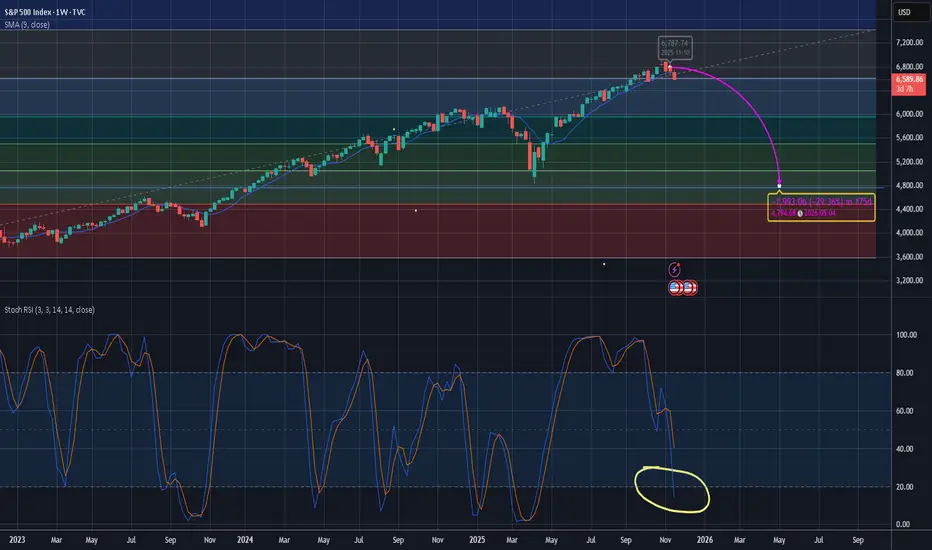
6900 drop to 4400 drop by 36%
I believe I need a lower target later like 3870
$SPX. What was confusing about this?? Literally no one that reads TA should have not seen this. MacD Crossing the centerline on the DAILY is classic

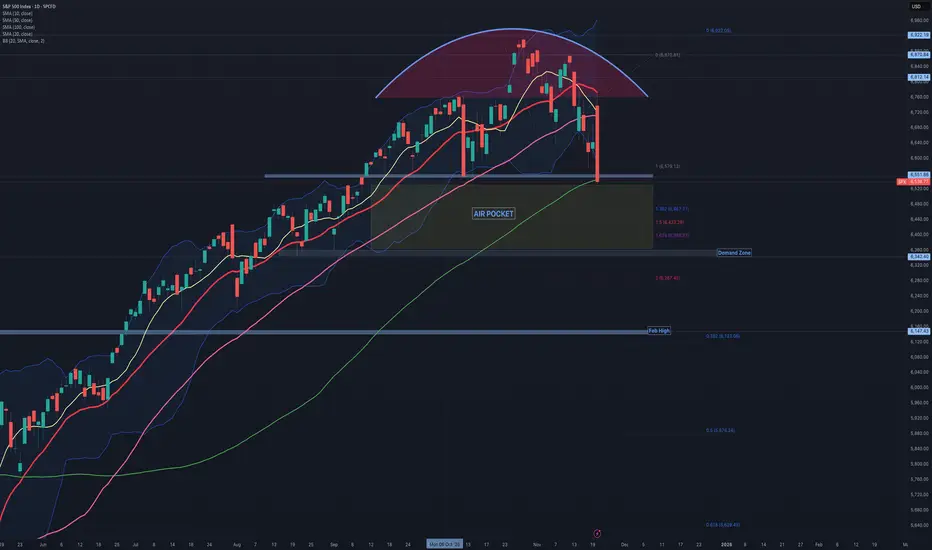
$SPX: A worrying Intraday Turnaround!While everyone, even the taxi driver, was celebrating NVDA's positive earnings report, the SP:SPX suddenly reversed. After touching the 20-day simple moving average, it dropped sharply with no buyers stepping in. With a 3.5% swing between the intraday high and low, the SP:SPX closed slightly below the horizontal support level at 6,550 and the 100-day moving average.
It's unfortunate that the right shoulder is missing, as it would otherwise form a perfect head and shoulders pattern—though it might be more accurately described as the head of a one-armed head and shoulders. Jokes aside, the technical outlook for the SP:SPX has significantly deteriorated. The market's bullish sentiment has evaporated, making it more challenging to establish a bottom.
If the S&P 500 doesn’t recover and consolidate support around 6,550 by Friday—an extremely important level that also aligns with the 1:1 extension below—we could face an “Air Pocket” of approximately 175 points. Within this Air Pocket area, we have extensions at 1.382, 1.5, and 1.618. The 14-period RSI is approaching oversold conditions, but it's not quite there yet.
SPX Possibly Breaking SupportPreviously support held on this Higher Low, but it is now creating a bear trend by showing us a Lower High, and now breaking support to possibly create a Lower Low. Wait for a retest on the support which will act as resistance, or on the trendline for a low risk short entry. Feel free to drop your thoughts/opinions!

7K End Of Year $SPX Rally into Bearish Deep Crab Plummet? Let's see if this pattern plays out with the Administration touting "money printing" to stimulate the economy, while jobs and the economy are in major decline. Not trading or investment advice. Entertainment only.

S&P500 remain under pressure, support at 6580Equities remain under pressure, with the S&P 500 down 0.92% yesterday, marking:
3rd straight decline (first since September)
Worst 3-day stretch since April (-2.61%)
Futures down another ~0.5% this morning
The index has now broken below its 50-day moving average for the first time in 139 sessions—its longest stretch above the level since 2007—adding to technical downside pressure.
Drivers of the Selloff
AI trade concerns continue to weigh:
Nvidia -1.88%, Philadelphia Semi Index -1.55%
JPMorgan’s Daniel Pinto warned of AI-rich valuations posing broader market risk.
Broad selling across the S&P:
407 decliners, most in 5 weeks
Equal-weight S&P -1.31%, Russell 2000 -1.96%, both at lowest since August
Credit risk sentiment deteriorated:
US HY +5bps, IG +1bps wider
Amazon priced $15bn in new bonds, adding to supply pressure
Mega-cap Tech
Mag-7 only slightly lower (-0.08%), saved by:
Alphabet +3.11% on Berkshire stake news
Apple sentiment mixed:
Design group loss, but strong China iPhone 17 sales (+37%) provided support
Crypto Risk Pressure
Bitcoin -3.3%, touching its lowest since April
Down ~4% YTD 2025
Down nearly 30% from highs 6 weeks ago
Modest rebound this morning helping stabilize risk tone
Macro Tone
Mass layoffs surged in October (Cleveland Fed) → signs of labour softening
Focus shifts to Thursday’s delayed September jobs report for confirmation
Trading Takeaway
Tone remains fragile, but S&P futures and Bitcoin stabilizing suggest some cooling of the global selloff.
Break of the 50-day MA is a key technical negative; next support levels likely in focus.
AI sector weakness + broader macro softening remain dominant headwinds today.
Key Support and Resistance Levels
Resistance Level 1: 6707
Resistance Level 2: 6757
Resistance Level 3: 6785
Support Level 1: 6580
Support Level 2: 6554
Support Level 3: 6530
This communication is for informational purposes only and should not be viewed as any form of recommendation as to a particular course of action or as investment advice. It is not intended as an offer or solicitation for the purchase or sale of any financial instrument or as an official confirmation of any transaction. Opinions, estimates and assumptions expressed herein are made as of the date of this communication and are subject to change without notice. This communication has been prepared based upon information, including market prices, data and other information, believed to be reliable; however, Trade Nation does not warrant its completeness or accuracy. All market prices and market data contained in or attached to this communication are indicative and subject to change without notice.

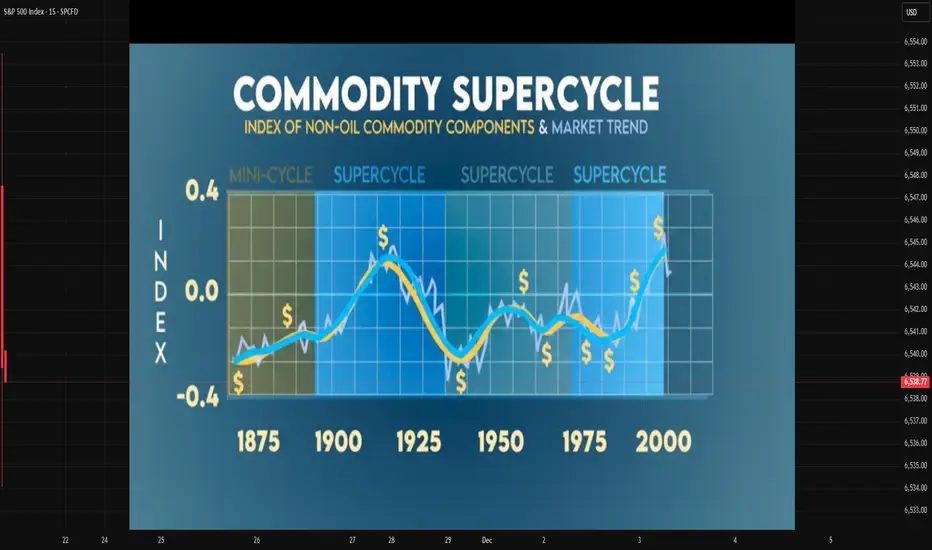
Commodity Supercycle Trends1. Understanding the Concept of Supercycles
Commodities traditionally move in cycles based on supply–demand fluctuations, but a supercycle is different in scale and duration. Price trends in supercycles tend to:
Last for 10–20 years
See sustained upward trajectories
Be driven by massive structural demand
Cause large-scale capital investments and supply expansions
Supercycles usually involve multiple commodities rising together, including crude oil, copper, aluminum, iron ore, wheat, corn, and rare earth metals.
2. Historical Commodity Supercycles
Economists identify four major commodity supercycles in the past 150 years:
a. Late 19th-Century Industrialization Supercycle (1890s–1910s)
This era coincided with the rapid industrial expansion in the US and Europe. Demand surged for coal, metals, and agricultural output to support railway construction, electricity expansion, and manufacturing.
b. Post-WWII Reconstruction Supercycle (1945–1970)
After World War II, Europe and Japan undertook large-scale rebuilding. This sharply increased the demand for energy, steel, and industrial metals. The global population was also rising rapidly, driving agricultural commodity consumption.
c. China-Led Supercycle (2000–2014)
Perhaps the most notable modern supercycle, driven by:
China’s industrialization and urbanization
Massive infrastructure investment
Globalization and trade expansion
Strong energy demand, especially crude oil
Metals like copper, iron ore, and aluminum saw exponential price growth during this period.
d. The “Green Transition” and Renewables Supercycle? (2020s–ongoing)
There is debate over whether the post-2020 environment constitutes a new supercycle. Still, strong demand for battery metals, rare earth elements, lithium, nickel, copper, and silver—essential for clean energy technologies—suggests a potential long-duration upward trend.
3. Drivers Behind Commodity Supercycles
Supercycles are created by mega-trends rather than short-term economic fluctuations. Key drivers include:
a. Industrialization and Urbanization
Emerging economies (e.g., China in the 2000s, India in the 2020s) undergo phases where construction, manufacturing, and infrastructure grow at a rapid pace. This increases demand for:
Steel and iron ore
Cement
Base metals
Energy fuels
b. Technological Shifts
New technologies can reconfigure commodity demand:
Electric vehicles → lithium, nickel, cobalt
Solar energy → silver, polysilicon
Semiconductor demand → rare earths
Technological revolutions often create entirely new commodity markets.
c. Population Growth and Changing Consumption Patterns
Growing populations increase demand for:
Food grains (wheat, rice, corn)
Protein (soybean, livestock feed)
Energy (oil, natural gas)
Urban lifestyles also increase per-capita metal and energy consumption.
d. Underinvestment in Supply
Supercycles often begin after years of:
Low commodity prices
Reduced mining investment
Capacity shrinkage
Supply chain disruptions
When demand picks up suddenly, supply cannot catch up, causing prices to surge.
e. Monetary and Fiscal Stimulus
Loose monetary policy or money supply expansion can raise:
Inflation
Liquidity in markets
Investment in commodity funds
This increases speculative and real demand for commodities.
4. The 2020s: Are We in a New Commodity Supercycle?
Analysts worldwide debate whether the 2020s reflect the start of a new supercycle. Several powerful forces suggest this possibility:
a. Energy Transition and Green Technologies
The transition to a low-carbon global economy hugely increases demand for:
Copper (electric grids, EVs)
Lithium (EV batteries)
Nickel, cobalt (battery chemistry)
Silver (solar panels)
Rare earths (wind turbines, electronics)
Estimates show the energy transition may require 3–10 times more metals compared to the current baseline.
b. Supply Constraints
This decade faces:
Mine depletion
Scarcity of high-grade ores
Stringent environmental rules
Slow permitting processes
Geopolitical resource nationalism (Africa, Latin America)
Supply shortages amplify price pressures.
c. Geopolitical Shifts
Conflicts and tensions between major powers affect commodity flows:
US–China rivalry impacts rare earths
Middle East tensions influence oil
Russia’s sanctions affect natural gas and metals
Realignment of supply chains supports longer-term price elevation.
d. Climate Change Disruptions
Extreme weather affects:
Agricultural output
Mining operations
Shipping routes
More frequent droughts, floods, and storms disrupt supply and raise volatility.
5. Major Commodities Likely to Dominate the Coming Supercycle
1. Copper
Considered the “new oil” of the green economy, copper demand is expected to surge due to:
EVs requiring 2–4 times more copper
Renewable energy grids
Electrification of industries
2. Lithium
A core input for batteries, with demand expected to grow 10–15x by 2035.
3. Nickel and Cobalt
Key metals for high-density battery chemistries.
4. Crude Oil
Despite renewable energy growth, oil demand remains strong due to:
Aviation
Petrochemicals
Industrial use
Slow transition in developing countries
5. Natural Gas and LNG
Seen as a “bridge fuel” in the transition away from coal.
6. Agricultural Commodities
Food prices are rising due to climate volatility and rising global population.
7. Precious Metals (Gold, Silver)
Investors hedge against inflation, currency depreciation, and geopolitical uncertainty.
6. Investment and Trading Implications
a. Long-Term Opportunities
A supercycle supports multi-year rallies in:
Mining stocks
Metal ETFs
Energy companies
Commodity indices
b. Volatility Will Remain High
While long-term trend is upward, short-term fluctuations will be sharp due to:
Interest rate swings
Policy changes
Currency volatility
c. The Role of Emerging Markets
India, Indonesia, Vietnam, and parts of Africa are entering new phases of:
Industrialization
Infrastructure spending
Urbanization
This will add structural demand to the global commodity landscape.
d. ESG and Sustainability Constraints
Environmental regulations limit new mining capacity, pushing prices higher.
7. Conclusion
Commodity supercycles represent long-term, structural shifts in global economic dynamics. They arise when powerful forces—industrialization, population growth, technology transitions, geopolitics, and supply constraints—drive sustained commodity demand. The world today is experiencing pressures that resemble previous supercycle conditions, especially with the rise of green energy, supply chain restructuring, and climate-driven disruptions. Whether or not this evolves into a full-fledged supercycle, commodities like copper, lithium, nickel, crude oil, natural gas, and agricultural products are likely to experience elevated demand and significant price appreciation in the years ahead. Understanding these trends helps investors and policymakers strategize effectively in a resource-constrained and rapidly evolving global economy.
SPX500 Will Go Down!
HI,Traders !
#SPX500 made a retest
Of the horizontal resistance
Level of 6678.85 from where
We are already seeing a
Bearish reaction so we are
Locally bearish biased and
We will be expecting a
Further local move down !
Comment and subscribe to help us grow !

SPX US🌎The first wave of the current impulse has ended, and we are now in the second.
The second wave's target has been met—the gap has been closed.
A breakout of 6870 will confirm that we are entering the third wave.
This marking fits well with the New Year's rally.
Also, the expectation of a Fed rate cut, as well as the end of the shutdown, will support the bullish momentum.

VIX may give the clueSPX popped from the NVDA earnings and may continue higher, but as long as we're below the 18 daily, the bias is down. The Vix is still above it's 18 ma and 20 support zone. Gold - choppy and in no man's land here. Oil - choppy. Nat Gas, maybe a nice short in this area. BTC could drop a little then rally higher.

SPX500 – Key Breakout Levels Ahead of NFP | Bearish Below 6734SPX500 | OVERVIEW
Stocks soar on Nvidia earnings relief as the company delivered forecasted quarterly revenue well above Wall Street expectations, easing recent concerns over AI-sector valuations that had contributed to a market pullback.
Markets now shift focus to the U.S. Non-Farm Payrolls (NFP) report, which is expected to generate strong volatility across indices.
Technically:
Stocks rally after Nvidia’s strong earnings forecast, easing some AI-valuation concerns. Markets now await the NFP report, which could fuel major intraday volatility.
Below 6734: Bearish continuation toward 6670 → 6635 → 6610
Above 6754: Bullish breakout toward 6800 → 6844
Pivot: 6734
Support: 6670 · 6635 · 6610
Resistance: 6769 · 6800 · 6844
SPX500 stays bearish under 6734, and only a strong candle close above 6754 will confirm bullish momentum.

SPX500 Softens as Tech Valuation Concerns Rise Before EarningsSPX500 | Overview
U.S. futures slipped lower as traders shifted into risk-off mode, driven by renewed concerns over stretched AI and tech valuations ahead of Nvidia’s earnings, set to be released after the market close tomorrow.
Sentiment remains cautious, and price action continues to respect the current bearish structure.
Technically:
SPX500 maintains a bearish momentum while trading below 6670, with downside targets at 6635 and 6610.
A break below 6610 would extend losses toward 6578.
A bullish recovery will only be possible if the price closes a 1H or 4H candle above 6670, which would open the path for a move toward 6706 and potentially 6722–6754.
Key Levels
Pivot Line: 6670
Support: 6635 · 6610 · 6578
Resistance: 6706 · 6722 · 6754
Outlook:
SPX500 remains bearish below 6670, targeting 6635–6610.
A confirmed 1H/4H close above 6670 would shift momentum toward 6706–6722, signaling the first sign of a bullish reversal.

#SPX Intraday Institutional Update. 18 November 2025**S&P 500 – Intraday Institutional Update | 18 November 2025**
The index continues to hover in an extremely uncomfortable elevation zone (~6,870–6,920) after failing multiple times to sustain above the psychologically significant 6,900 round. On the 4-hour timeframe, price action is manifesting as a sequence of indecisive, high-wick candles with diminishing real-body progression — a classic hallmark of structural instability at extreme deviation levels.
Key observations from a risk-desk perspective:
- The S&P 500 remains ~480–510 points detached above the 9-period monthly moving average, a magnitude of extension that historically compresses aggressively once bidirectional order flow reasserts itself.
- 4H momentum profiles (RSI, StochRSI, MACD histogram) are flattening to negatively sloping while price refuses to commit directionally — a textbook precursor to sharp liquidity-driven resolution.
- Equal-high retests over the past 72 hours coupled with expanding H4 range ATR but contracting realized volatility underscore fading conviction among fast-money participants.
- Micro-composite breadth (NYSE advance-decline line, % of stocks above 50-day MA) continues to deteriorate beneath the surface, widening the divergence with price.
From a professional standpoint, the current configuration is one of the more precarious “equilibrium-at-extremes” setups we have monitored in the post-2022 regime. The balance of probabilities now leans toward a violent mean-reversion episode rather than an orderly consolidation. Positioning should reflect heightened caution: elevated gamma exposure, concentrated long positioning in systematic vehicles, and still-rich implied volatility term structure all point to asymmetric downside risk in the very near term.
A decisive 4H close below 6,835 would likely trigger stop clusters toward 6,650–6,680 initially, with risk of acceleration toward the 6,400–6,500 zone if monthly support layers fail to attract defensive capital.
Institutional risk committees are strongly encouraged to re-evaluate gross and net exposure, widen hedging coverage, and prepare contingency capital for volatility expansion.
**Tags**
#SP500 #ES_F #Equities #USMarkets #RiskManagement #MarketStructure
#TechnicalAnalysis #Momentum #Breadth #Volatility #GammaExposure
#InstitutionalInvesting #PortfolioConstruction #Hedging #MacroTrading
#SystematicStrategies #VolatilityTargeting #CTAs #RiskParity
#GlobalMacro #AssetAllocation #QuantFinance #TradingDesk
#GoldmanSachs #JPMorgan #MorganStanley #BankofAmerica #Citi
#UBS #DeutscheBank #Barclays #HSBC #BNPP #SocGen #RBC
#Citadel #Millennium #Point72 #TwoSigma #DEShaw #AQR
#Bridgewater #BlackRock #Vanguard #StateStreet #PIMCO #FidelityInvestments
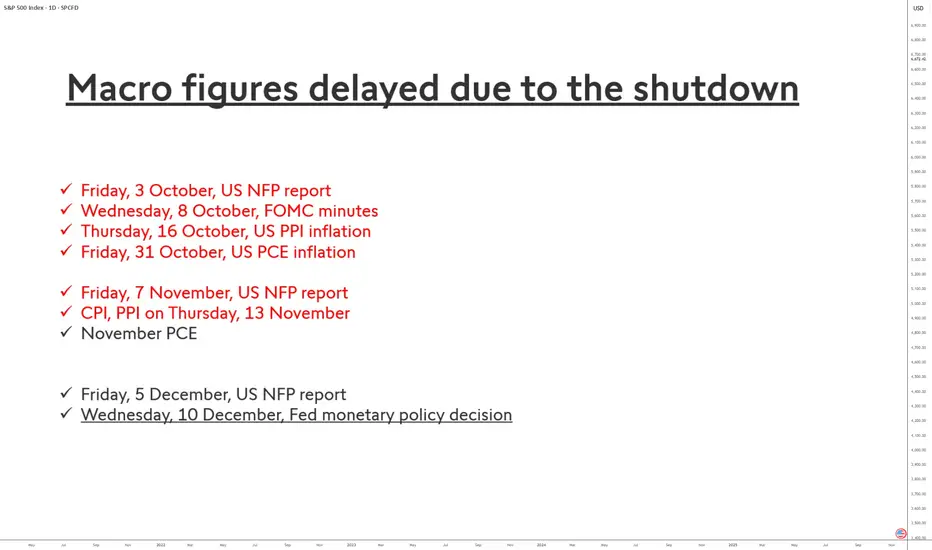
Imminent End of the U.S. Statistical Blackout!The prolonged shutdown of the U.S. federal government has had an exceptional impact on the release of some of the country’s most important economic statistics. Indicators such as the employment report (NFP), PCE inflation, or the CPI are the backbone of the Federal Reserve’s monetary policy and heavily influence financial market volatility. Their delay therefore creates a true statistical “black hole.”
Why are these indicators delayed?
Two federal agencies have been affected:
• the Bureau of Labor Statistics (BLS), responsible for NFP and CPI;
• the Bureau of Economic Analysis (BEA), which publishes PCE inflation as well as household income and spending data.
During the shutdown, these agencies had to suspend the collection, processing, and validation of data. Unlike a simple administrative pause, this disrupts complex statistical pipelines built on surveys of businesses and households. Some data cannot be “caught up” immediately because they depend on strict deadlines, which explains why certain series may be incomplete, revised late, or even canceled.
The case of Non-Farm Payrolls (NFP)
The October NFP report — normally released in early November — was entirely blocked. Signals from the BLS suggest that this report may be partially or totally compromised, especially the household survey, which is more difficult to reconstruct.
By contrast, the September report, which was also delayed, now has a confirmed publication date: Thursday, November 20, 2025.
For the October report, there is still no official date. The most likely estimates point to a possible release in late November or early December, provided the data quality is deemed acceptable.
The case of PCE inflation
The October PCE inflation figure — scheduled for October 31 — was also halted. The BEA announced it would revise its entire calendar but has not yet provided firm replacement dates.
Economists currently expect a publication around November 26, 2025, potentially in a partially “imputed” form (with statistical estimates filling missing data).
Market consequences
The absence of these key data forces investors and the Fed to navigate blindly. Volatility could remain elevated until the full or partial release of these indicators, which should gradually return to a normal schedule starting in December.
DISCLAIMER:
This content is intended for individuals who are familiar with financial markets and instruments and is for information purposes only. The presented idea (including market commentary, market data and observations) is not a work product of any research department of Swissquote or its affiliates. This material is intended to highlight market action and does not constitute investment, legal or tax advice. If you are a retail investor or lack experience in trading complex financial products, it is advisable to seek professional advice from licensed advisor before making any financial decisions.
This content is not intended to manipulate the market or encourage any specific financial behavior.
Swissquote makes no representation or warranty as to the quality, completeness, accuracy, comprehensiveness or non-infringement of such content. The views expressed are those of the consultant and are provided for educational purposes only. Any information provided relating to a product or market should not be construed as recommending an investment strategy or transaction. Past performance is not a guarantee of future results.
Swissquote and its employees and representatives shall in no event be held liable for any damages or losses arising directly or indirectly from decisions made on the basis of this content.
The use of any third-party brands or trademarks is for information only and does not imply endorsement by Swissquote, or that the trademark owner has authorised Swissquote to promote its products or services.
Swissquote is the marketing brand for the activities of Swissquote Bank Ltd (Switzerland) regulated by FINMA, Swissquote Capital Markets Limited regulated by CySEC (Cyprus), Swissquote Bank Europe SA (Luxembourg) regulated by the CSSF, Swissquote Ltd (UK) regulated by the FCA, Swissquote Financial Services (Malta) Ltd regulated by the Malta Financial Services Authority, Swissquote MEA Ltd. (UAE) regulated by the Dubai Financial Services Authority, Swissquote Pte Ltd (Singapore) regulated by the Monetary Authority of Singapore, Swissquote Asia Limited (Hong Kong) licensed by the Hong Kong Securities and Futures Commission (SFC) and Swissquote South Africa (Pty) Ltd supervised by the FSCA.
Products and services of Swissquote are only intended for those permitted to receive them under local law.
All investments carry a degree of risk. The risk of loss in trading or holding financial instruments can be substantial. The value of financial instruments, including but not limited to stocks, bonds, cryptocurrencies, and other assets, can fluctuate both upwards and downwards. There is a significant risk of financial loss when buying, selling, holding, staking, or investing in these instruments. SQBE makes no recommendations regarding any specific investment, transaction, or the use of any particular investment strategy.
CFDs are complex instruments and come with a high risk of losing money rapidly due to leverage. The vast majority of retail client accounts suffer capital losses when trading in CFDs. You should consider whether you understand how CFDs work and whether you can afford to take the high risk of losing your money.
Digital Assets are unregulated in most countries and consumer protection rules may not apply. As highly volatile speculative investments, Digital Assets are not suitable for investors without a high-risk tolerance. Make sure you understand each Digital Asset before you trade.
Cryptocurrencies are not considered legal tender in some jurisdictions and are subject to regulatory uncertainties.
The use of Internet-based systems can involve high risks, including, but not limited to, fraud, cyber-attacks, network and communication failures, as well as identity theft and phishing attacks related to crypto-assets.
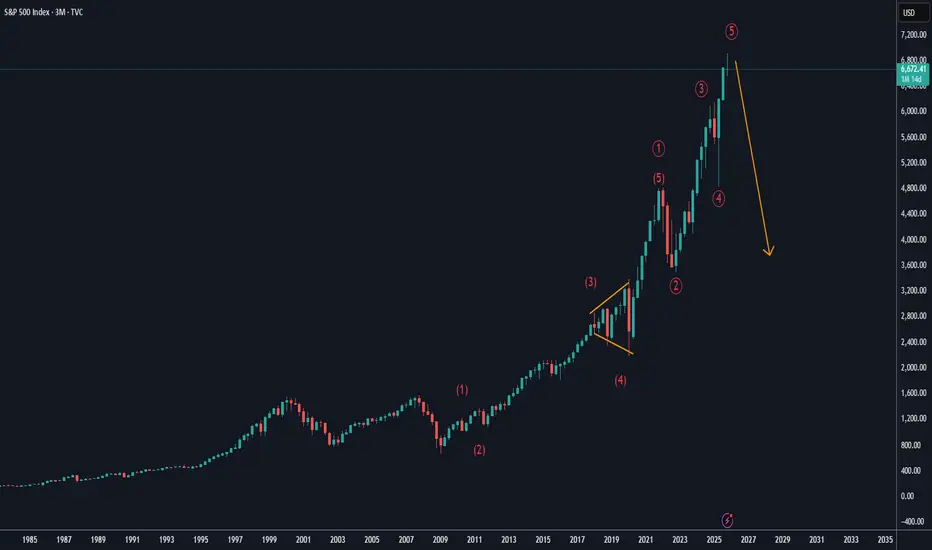
S&P anticipation for the 2025 ending It requires no many words to tell the trues.
I Think it might be double zigzag reaching at least 5800, in zone where 4th wave ending

SPX QuantSignals: Bullish Bias SPX QuantSignals Katy 1M Prediction 2025-11-17
Symbol: SPX
Price: 6706.78
Model: Katy AI 1M Prediction
Trend: Bullish
Confidence: 64.6%
🔮 Vision Summary
SPX maintains a bullish short-term structure, with the model projecting a move toward 6753.08 (+0.69%).
Momentum remains positive as long as price holds above 6700, with 30-minute targets signaling continued upward drift toward 6730.49.
Volatility remains moderate (27.3%), supporting steady trend continuation rather than sharp mean-reversion.
📈 Key Levels
Entry Zone: 6706.78
Upside Target: 6743.82 – 6753.08
Support / Invalidation: 6606.18
🧭 Vision Bias
Bullish — Model indicates upward continuation with controlled volatility and stable trend strength.
Break below 6700 weakens the signal; break below 6606 invalidates the forecast.

Patience Is Needed: Traders, Stay SharpPatience Is Needed: Traders, Stay Sharp
This week kicks off with a flurry of market-moving events: Nvidia’s earnings, Alphabet’s Berkshire bump, and the long-awaited return of government data releases post-shutdown. Futures are green, optimism is stirring—but beneath the surface, the charts are whispering caution.
🔍 S&P 500 Technicals: A Mixed Bag
• The 55-day moving average remains intact. As long as it holds, the uptrend is technically alive.
• But weekly RSI divergence is flashing a warning—momentum isn’t confirming the highs.
• On the monthly chart, we’re at the top of a long-term channel dating back to 2009. Upside from here looks capped.
• And yes, we now have a triple divergence on the monthly RSI. That’s not noise—it’s a signal.
📊 Macro Meets Momentum
• The September jobs report lands Thursday, but expectations are muted. Private surveys already suggest a slowdown.
• Rate cut hopes have faded fast: traders now see a 56% chance of a Fed hold in December, down from 94% odds of a cut just a month ago.
🧠 What This Means for Traders We’re in a wait-and-see phase. No sell signal
We’re in a wait-and-see phase. No sell signal yet, but the setup demands discipline. The temptation to chase breakouts is strong—especially in AI and mega-cap tech—but the technicals say: patience is not just a virtue, it’s a strategy.
Let the data land. Watch the close. Respect the signals. not trading advice

SPX: Makes equities affordable againThe previous week was quite an interesting one on equity markets. A lot of swing movements, but the general trend was toward the downside, or a general correction. The weekly peak of the S&P 500 was at the level of 6.870, but the next two days were traded with a huge market correction. Futures on Friday were traded with a significant discount, when the market opened at 6.648. The dip buyers immediately stepped on the market, and managed to push the index toward the higher grounds, where the index closed the week at 6.734. Many analysts are questioning whether this Friday's move was pointing to the reverse of investors sentiment, or was it just a short term correction to the upside?
The week started with an interesting news that the SoftBank Group has sold its entire stake in Nvidia Corporation for around $5,8B, with aim to transfer these funds in AI investments, including OpenAI. Amazon shares jumped after it struck a $38 billion deal with OpenAI to provide AWS capacity, signalling strong demand for AI infrastructure. Apple reported strong earnings, with its services business growing significantly, helping it stay resilient even amid broader market worries.
Based on the previous week's market movements, it could be noted that broad-based profit-taking hit big tech as investors expressed renewed valuation concerns on AI-focused companies, with Nvidia, Microsoft, AMD, and others seeing notable declines. Meanwhile, analysts are closely watching capital-expenditure plans from major companies as these will test whether the current AI-driven rally is sustainable.

S&P 500 Technical & Fundamental Outlook — Week of Nov 17–21 2025S&P 500 – 1H Technical Breakdown
Price is sitting inside a well-defined symmetrical wedge, created by a series of lower highs pressing down from above and higher lows building from below. The market has been tightening for several sessions, and it’s now approaching the point where volatility usually picks up.
Immediate resistance:
6,793 (intraday pivot)
6,845–6,860 (previous supply zone)
6,922 (major level above the wedge)
Key support:
6,705–6,675 (rising trendline support)
6,600
6,550 (broad structural support below)
The recent rejection off the upper trendline shows sellers are still defending that zone, but buyers continue to step in at higher lows. The structure is neutral overall, but it’s clearly coiling for a directional move.
Upside needs:
A clean break above the descending trendline and a push over 6,793 would open the door toward 6,845, with room toward 6,922 if momentum follows through.
Downside needs:
A breakdown under the rising support and a close below 6,675 exposes 6,600, with 6,550 as the next major area below.
Until one of those levels gives way, it’s just tightening inside the wedge.
S&P 500 – Fundamental Summary
The market spent most of the week stuck between mixed macro signals, Fed uncertainty, and a sharp rotation out of the AI/tech trade. Stocks initially bounced early in the week, but momentum faded after several Fed officials pushed back against expectations for a December rate cut. The government shutdown ending helped sentiment, but the delay in economic data releases kept visibility low and added to the hesitation.
Tech was the clear weak spot. A post from Michael Burry questioning hyperscaler spending, depreciation assumptions, and AI valuations triggered more profit-taking in the sector. His criticism—paired with his Palantir short—sparked debate and pulled money out of AI names for a second straight week. As tech cooled, leadership shifted toward defensive and value sectors like healthcare, staples, materials, and energy.
Looking ahead, Nvidia’s earnings on Wednesday are the biggest single catalyst. The market is treating it as a referendum on the entire AI theme: a strong report could reignite the trade, while weak guidance could deepen the recent rotation.
Outlook for Next Week
Major indices (SPX, COMP, NDX, SOX) are all testing their 50-day moving averages, and so far those levels are holding. That puts the market in position for a potential rebound early next week, especially given positive seasonality into late November and year-end performance chasing from fund managers.
One red flag: the VIX is elevated near 20 and not responding to Friday’s rebound. That kind of volatility behavior sometimes precedes another leg down.
House view:
Moderately bullish into the first half of next week as long as the indices hold above their 50-day moving averages. Nvidia’s results remain the wild card. A strong NVDA print likely sparks an AI rebound; a weak one likely drags the entire market lower.
Key Catalysts to Watch
1. Economic Data (finally resuming after shutdown delays)
Empire State Manufacturing
Industrial Production, Capacity Utilization
Housing Starts, Building Permits
Philly Fed Index
Jobless Claims
Michigan Consumer Sentiment
Delayed CPI and PPI reports should hit in early/mid-December.
2. Earnings
Major reports:
Nvidia (NVDA) – biggest market driver of the week
Home Depot (HD), Target (TGT), Walmart (WMT) – consumer spending
Palo Alto (PANW), Baidu (BIDU), PDD, NIO, TJX, XPeng, Intuit, Ross Stores
Retail earnings will give deeper insight into demand and holiday spending.
3. The Fed & Rates
Fed speakers turned notably more hawkish:
Mary Daly called a December cut “premature”
Raphael Bostic stressed inflation risk over labor softness
Susan Collins expects rates to stay steady “for some time”
As a result:
December rate-cut odds fell from 66% → 41%
Treasury yields ticked higher
The bond market is reassessing how much easing is realistic in 2025–2026
GDPNow remains strong at 4.0%, but the shutdown likely dents Q4 numbers.
Market Themes to Watch
Tech Rotation
High valuations + Burry commentary + earnings uncertainty = cooling off in tech and AI names.
AI Inflection Point
Nvidia will likely determine whether the recent pullback becomes:
A buying opportunity
or
The start of a deeper correction in the AI trade
Breadth Concerns
Fewer stocks are trading above their 50-day average—classic sign of a tiring rally.
Seasonality
Late November into December is historically strong, and funds that are underperforming may chase performance if NVDA reignites momentum.
Bottom Line
The market is at a pivotal spot:
Technical support is holding (50-day MAs).
Fundamentals are mixed but leaning positive if Nvidia delivers.
VIX is a risk factor that can’t be ignored.
If NVDA beats → risk-on, AI rebound, SPX likely pushes higher.
If NVDA disappoints → tech drags lower, SPX likely breaks support levels.

SPX: Channel Break Failure? Eyeing ShortsSPX briefly tagged above the upper channel but closed back inside the broader monthly structure. Watching for the channel to hold, a possible minor retest higher, and then downside continuation if the levels and trendlines confirm.
