Larger Drop Incoming?The move up since the liberation day dump has been epic. I called the low on the markets at the time. I was long AppLovin, AMD, Reddit, Arm, Alab, REMX, amongst many other names that far outperformed the market. I warned you about the imminent dump before it happened, and then took positions on the long side as the market capitulated and we hit the golden ratio.
Now it's time to zoom out and remind you that this will not grind up forever. My interpretation of the chart is the move is nearing the end, the risk of strong downside move (7-12% drop) is increasing significantly and greed will catch many people out.
The inverse head and shoulders pattern is almost complete, we are grinding up in this channel and will start to come up against the resistance over these coming days/weeks. I had an upside target of 7000-7250 and we are almost there. The dips are getting brought up, so bulls may have more time to make gains but I am not convinced that the gains are worth the risk at this stage.
I will start taking some chips off the table here. Not financial advice, do what's best for you.
Trade ideas

SPX to Money Supply WARNING!If the charts aren’t showing bubble setups, I’m not going to invent them. I post what the data shows. So please don’t shoot the messenger when I say GTFO & STFO.
And just to keep the facts straight:
Brokerage, stock, and crypto accounts are not part of M2.
Why does M2 matter?
It’s the actual spendable money in the economy.
When M2 grows faster than real output (as it did in 2021), price pressure builds.
The economy runs on liquidity.
Retail, goods, services all of it requires money you can actually spend, not paper gains in a trading account.
When the S&P 500 disconnects massively from M2 — like during the dot-com bubble — revenue and profit growth can’t keep pace. Valuations expand purely on speculation, not on real, organic fundamentals. That’s how multiples stretch and bubbles form.
The problem? Most retail traders have no idea this is happening. They’re trading with their hair on fire, following cute social-media stories dressed up as “analysis,” using strategies that have never been tested in real markets.
And that’s exactly how bubbles are fed:
big players sell into retail euphoria, and retail ends up holding the bag of schitt!
Buy when stocks are cheap, not at all-time highs in euphoria land.
"Price is what you payt, VALUE is what you get!"
THANK YOU for getting me to 5,000 followers! 🙏🔥
Let’s keep climbing.
If you enjoy the work:
👉 Drop a solid comment
Let’s push it to 6,000 and keep building a community grounded in truth, not hype.

More upside for SPX500USDHi traders,
Last week SPX500USD went up again just as I've said in my previous outlook.
Next week we could see a correction down and more upside for this pair.
Let's see what the market does and react.
Trade idea: Wait for a correction down. After a change in orderflow to bullish you could trade longs.
This shared post is only my point of view on what could be the next move in this pair based on my technical analysis.
But I react and trade on what I see in the chart, not what I've predicted or expect.
Don't be emotional, just trade your plan!
Eduwave

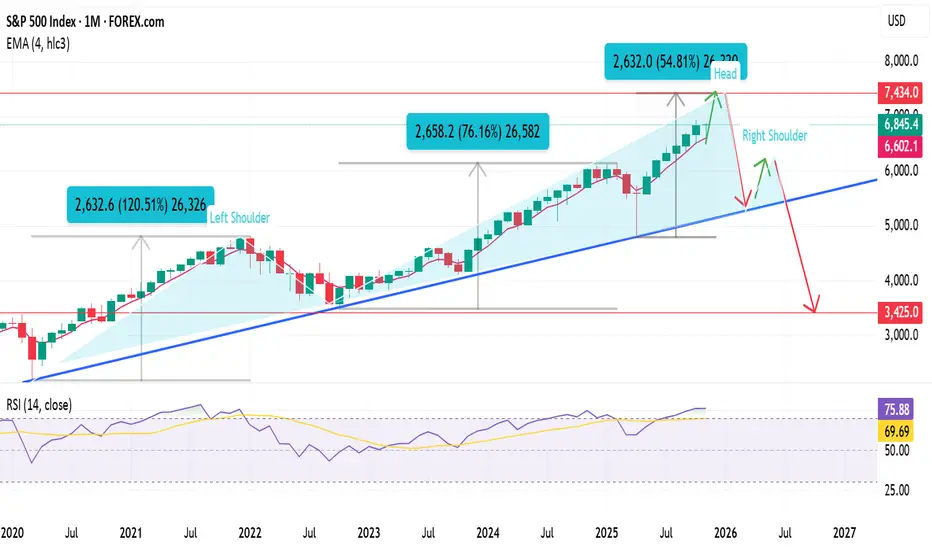
End of bull cycle targeting 7440 then bear market target 3400 In my view we're still in the bullish cycle started in 2020, my final target is 7440 area.
From that area I expect the beginning of the market bearish cycle.
On the monthly chart we can see an H&S pattern forming and a neckline supporting the bullish trend from 2020, I expect the break of the trendline in the next 3 months my target is 3420 area next autumn.
The Importance of Reserves in Trading1. Definition and Types of Reserves
Reserves generally refer to the assets that a country, financial institution, or corporation keeps aside to meet future obligations, emergencies, or to stabilize economic activities. In the context of trading, reserves are primarily associated with central banks, which maintain foreign exchange reserves, gold reserves, and other liquid assets.
Foreign Exchange Reserves (Forex Reserves): These are holdings of foreign currencies, usually in the form of government bonds or deposits, used to back a country’s currency, manage exchange rates, and intervene in the forex market.
Gold Reserves: Traditionally, gold has been a store of value and a hedge against currency volatility. It is part of a country’s overall reserve portfolio.
Special Drawing Rights (SDRs) and Reserve Assets: Allocated by the International Monetary Fund (IMF), these act as supplementary foreign exchange reserve assets to support international liquidity.
Corporate and Bank Reserves: On a smaller scale, businesses and banks maintain cash or liquid reserves to manage operational risks, meet obligations, and ensure stability in trading activities.
2. Stabilizing Currency and Exchange Rates
One of the primary reasons reserves are important in trading is their role in stabilizing a country’s currency. In international trade, goods and services are often priced in stable foreign currencies, particularly the US dollar, Euro, or Japanese Yen. If a country’s currency fluctuates excessively due to market pressures, trade becomes unpredictable and costly.
Reserves allow central banks to intervene in the forex market by buying or selling currencies to maintain exchange rate stability. For example, if the local currency is depreciating sharply, the central bank can sell foreign exchange reserves to support its currency, preventing sudden spikes in import costs and preserving the competitiveness of exports. This stabilization ensures smoother trade transactions, predictable pricing, and confidence among international trading partners.
3. Ensuring Liquidity and Meeting Payment Obligations
Trade often involves payments across borders, which requires liquidity in foreign currency. Countries and corporations holding sufficient reserves can easily settle import bills, service foreign debts, and maintain creditworthiness. For businesses, maintaining cash reserves ensures that operational transactions, supplier payments, and contractual obligations are met without delay.
In times of economic stress, such as a balance-of-payments crisis, reserves act as a crucial liquidity buffer. They allow a country to continue trading, importing essential goods, and servicing debts even when other sources of financing are constrained. Without adequate reserves, a country risks defaulting on payments, facing higher borrowing costs, or experiencing a freeze in trade flows, all of which can be catastrophic for the economy.
4. Building Market Confidence and Creditworthiness
Reserves are not only about liquidity—they are also a signal of financial strength. Large reserves indicate that a country or institution is well-prepared to handle external shocks, giving confidence to investors, traders, and international financial institutions. This confidence translates into lower borrowing costs, stronger credit ratings, and greater willingness of foreign partners to engage in trade.
For instance, countries with ample forex reserves are perceived as more stable and less risky, which encourages foreign trade and investment. Corporations with healthy cash reserves or liquid assets are considered reliable partners in trade agreements, leading to smoother transactions and more favorable credit terms.
5. Hedging Against Trade Risks
International trade is inherently risky due to fluctuating exchange rates, commodity price volatility, geopolitical tensions, and economic downturns. Reserves act as a hedge against these risks. For example:
If a country faces a sudden surge in import prices due to a weakening local currency, reserves can be used to stabilize the exchange rate.
In commodity trading, reserves of strategic goods or currency assets can prevent supply disruptions or price shocks.
During global financial crises, reserves provide a cushion to continue critical trade operations without resorting to excessive borrowing or austerity measures.
This risk mitigation ensures that trade continues even under adverse conditions, protecting both the domestic economy and international trade relationships.
6. Facilitating Monetary and Trade Policies
Reserves give governments and central banks the flexibility to implement monetary and trade policies. By managing reserves effectively, countries can influence interest rates, control inflation, and maintain competitive export pricing. For instance, a country seeking to boost exports might use its reserves to prevent excessive appreciation of its currency, keeping export goods affordable in the global market.
Reserves also enable governments to implement trade agreements, provide subsidies, or intervene in strategic sectors without destabilizing the economy. They act as a financial lever, giving policymakers tools to balance growth, trade, and economic stability.
7. Supporting Crisis Management
History has repeatedly shown that countries with insufficient reserves face severe consequences during economic crises. Examples include sudden capital outflows, currency collapses, or trade restrictions. Reserves act as a shock absorber, allowing countries to navigate crises with minimal disruption to trade. During the 1997 Asian financial crisis, nations with higher reserves were able to stabilize their currencies faster, maintain trade flows, and recover more quickly than those with depleted reserves.
8. Strategic and Geopolitical Importance
Reserves also carry strategic significance. Countries with substantial reserves can influence global trade dynamics, secure critical imports, and participate in international financial negotiations with greater leverage. In geopolitically tense situations, reserves ensure that trade and essential imports continue uninterrupted, supporting national security and economic sovereignty.
Conclusion
Reserves are much more than a financial metric—they are a critical tool that underpins trading activities at every level. They stabilize currency and exchange rates, ensure liquidity, signal creditworthiness, mitigate risks, and enable effective policy implementation. For businesses, sufficient reserves safeguard operational continuity and international trade reliability. For countries, reserves act as both a shield against economic shocks and a lever for strategic influence in global markets.
In an interconnected and unpredictable global economy, reserves are the silent guardian of trade. They enable economies to operate smoothly, sustain investor confidence, and maintain a competitive edge in international commerce. Countries or institutions that fail to maintain adequate reserves face heightened vulnerability to market volatility, trade disruptions, and financial crises. Therefore, managing reserves prudently is not just an accounting exercise—it is a vital component of sustainable economic growth and successful trading.
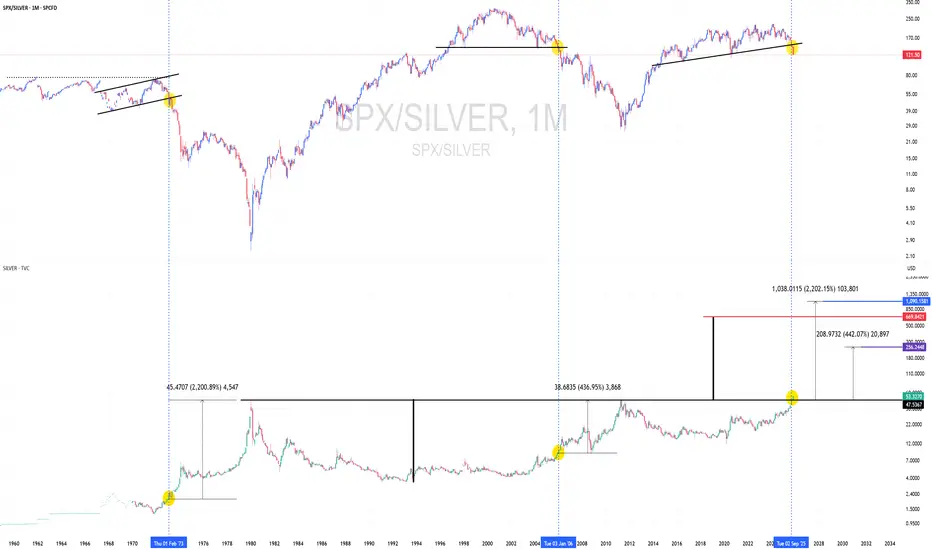
The bull market for silver is just getting started.Could be one of the most important charts out there right now.
The question is this: is this a 1970's bull market, or a 2000's one?
Silver targets: $250 or $1000? Cup and handle measured move is around $670.
US500 Remains BullishFundamental Analysis
US equities strengthened as the Fed rate-cut expectations solidified, which pushes bond yields lower and supports equity valuations. Markets now price in a high probability of a further cut in the coming Dec FOMC meeting. This sentiment reduces tightening fears and maintains the 'soft landing' narrative.
Corporate earnings remain broadly resilient. AI leaders and large-cap growth companies continue to underpin the US500 index despite recent volatility in some tech stocks. Meanwhile, macro data shows moderating growth and easing inflation. Investors are watching upcoming US data releases, including US PCE and US NFP, for confirmation of the disinflationary trend.
Technical Analysis
The US500 trades in a clear uptrend, with price holding above the recent resistance zone between 6,700 and 6,830. Price presses toward the old record high resistance at the 6,890–6,925 range. The index has strong support at approximately 6,515 points.
Dips toward the 6,700 area are currently viewed as 'buy-the-dip' zones. A decisive break above the prior record high would target the psychologically important 7,000 figure.
Sentiment Analysis and Outlook
Near term, the bias remains cautiously bullish: supportive the Fed expectations, solid earnings, and seasonal strength favor the upside. However, high valuations leave the index sensitive to any negative surprise in data or policy. A more hawkish tone from the Fed or unexpectedly strong inflation could trigger a pullback, but the base case assumes shallow corrections within the ongoing uptrend.
Analysis by Terence Hove, Senior Financial Markets Strategists at Exness

SPX/PA - SPX/Palladium ratio flashing a buy$SP:SPX/NYMEX:PA1!
Palladium is looking very good relative to equities currently, currently sitting at a ratio of over 4.50 : 1
I would be expecting to see this normalize around the 2.50-1.5 level, this would imply a significant period of outperformance of palladium relative to the SP500.
This coupled with the continued breakout of Silver and the strong performance of gold, comes together to form a very bullish outlook for palladium.

Looking at SPX on a Large Timeframe Post the 08 market crash price has accelerated very fast away from the trend line I have drawn in white. Is it following another trend like the one drawn in dotted green, or will a retest of the white line come.
It is more likely in my opinion that it follows the green curve up as a drop like that would be a massive bubble pop.
See how it unfolds
Monthly timeframe

Double top!we see a double top broke mecline and descending to fill the gap. we migh see further down ward buyt since we have a demand there it may be imposible

Risks and Challenges of FII Dependence1. Market Volatility and Sensitivity
One of the primary risks of dependence on FIIs is the potential for heightened market volatility. FIIs are highly mobile investors who often chase short-term gains. Their investments can be withdrawn quickly in response to global economic changes, political events, or shifts in market sentiment. Such sudden inflows or outflows can cause sharp price fluctuations in equity and debt markets, leading to instability.
For instance, during global crises or periods of rising interest rates in developed markets like the U.S., FIIs may withdraw funds en masse from emerging markets, causing significant stock market crashes. In countries where domestic institutional investors and retail participation are relatively low, the volatility induced by FIIs can be particularly severe. This volatility not only affects investor confidence but can also have wider economic consequences, including reduced investment by domestic players and businesses.
2. Exchange Rate Risk
FIIs invest in local currency-denominated assets, but their base capital is often in foreign currency. This exposes countries to currency risk, as inflows and outflows of foreign capital influence exchange rates. When FIIs withdraw capital rapidly, it can lead to a depreciation of the local currency, raising the cost of imports and increasing inflationary pressures.
Moreover, currency depreciation can exacerbate the burden of external debt, as repayments become more expensive in local terms. Countries heavily reliant on FII inflows are therefore vulnerable to speculative attacks on their currency, especially during periods of global financial instability.
3. Short-Term Focus and Herd Behavior
FIIs often prioritize short-term returns over long-term investment. This short-term orientation can distort market functioning. During periods of market euphoria, FIIs tend to drive up stock prices, inflating asset bubbles. Conversely, during periods of uncertainty, they may withdraw investments abruptly, triggering sharp corrections.
The herd behavior of FIIs—where multiple institutional investors move in and out of markets simultaneously—can amplify market swings. For example, when FIIs collectively reduce exposure to emerging markets due to global risk aversion, it can result in panic selling, impacting domestic investors and businesses disproportionately. Such behavior makes financial markets more vulnerable to external shocks and reduces the effectiveness of domestic monetary policies aimed at stabilizing markets.
4. Dependency on Global Economic Conditions
Countries dependent on FII inflows are inherently exposed to global economic conditions beyond their control. Factors such as interest rate hikes in developed countries, geopolitical tensions, or changes in global liquidity conditions can influence FII behavior. For instance, if U.S. interest rates rise, FIIs might prefer to invest in U.S. assets, leading to capital outflows from emerging markets.
This dependence on global conditions creates a situation where domestic markets may experience booms and busts irrespective of local economic fundamentals. Policymakers may find it challenging to implement effective economic policies when capital flows are driven primarily by external factors.
5. Impact on Domestic Investment Patterns
Heavy reliance on FIIs can crowd out domestic institutional investors. When markets are dominated by FII activity, domestic investors may feel sidelined or discouraged from investing, leading to underdeveloped domestic capital markets. This can reduce the diversity of investment sources and create an over-reliance on foreign capital for market functioning.
Additionally, FIIs often prefer large-cap, highly liquid stocks, leaving mid-cap and small-cap companies underserved. This selective investment behavior can distort capital allocation in the economy, favoring sectors and companies that may not necessarily contribute most effectively to long-term economic growth.
6. Regulatory Challenges and Market Manipulation
FIIs, while generally regulated by both home and host countries, operate across multiple jurisdictions, making regulatory oversight complex. This cross-border nature can pose challenges for authorities in monitoring and managing sudden capital inflows or outflows.
Moreover, the influence of FIIs on market prices can sometimes enable market manipulation or speculative practices that disadvantage domestic investors. Regulatory authorities often have limited tools to manage or moderate such behavior, increasing systemic risk. Excessive dependence on FIIs without a robust regulatory framework can therefore undermine market integrity.
7. Macroeconomic Vulnerabilities
Beyond financial markets, FII dependence can create broader macroeconomic vulnerabilities. Sudden capital outflows can disrupt the balance of payments, weaken foreign exchange reserves, and trigger inflationary pressures. Countries that rely heavily on FII inflows to finance fiscal deficits or fund infrastructure projects are particularly exposed to these risks.
Additionally, overdependence on FIIs can reduce the incentive for countries to develop sustainable domestic savings and investment mechanisms. This structural weakness can hinder long-term economic stability and growth.
8. Political and Policy Risks
FIIs are sensitive not only to market conditions but also to political and policy developments in host countries. Changes in taxation, regulatory frameworks, or government policies can influence FII behavior. For example, increased capital gains taxes or stricter investment regulations may prompt FIIs to reduce exposure to a country, triggering capital outflows.
This interdependence can make domestic policy formulation challenging. Policymakers might feel constrained in pursuing reforms that are essential for long-term growth due to fear of scaring away foreign investors. Such a scenario can limit the sovereignty and flexibility of economic management.
9. Strategies to Mitigate FII Dependence
To reduce the risks associated with FII dependence, countries can adopt multiple strategies:
Diversification of Investors: Encouraging participation from domestic institutional investors, retail investors, and pension funds can reduce reliance on FIIs.
Strengthening Regulatory Frameworks: Improved oversight and regulation can mitigate the risks of speculative inflows and outflows.
Capital Flow Management: Tools such as prudential limits, taxes on short-term inflows, and macroprudential measures can moderate excessive volatility.
Developing Domestic Financial Markets: Building deeper and more liquid domestic markets attracts long-term investors and reduces vulnerability to FII behavior.
By balancing foreign capital with strong domestic investment participation, countries can enjoy the benefits of FIIs while minimizing the associated risks.
10. Conclusion
While Foreign Institutional Investors bring substantial benefits to emerging markets in terms of liquidity, capital inflows, and investment expertise, overdependence on their participation exposes economies to several risks. These include market volatility, exchange rate pressures, short-term investment biases, herd behavior, and macroeconomic vulnerabilities. Additionally, FIIs’ sensitivity to global and political conditions can constrain domestic policymaking and market stability.
Mitigating these challenges requires a multi-pronged approach, focusing on strengthening domestic investment, regulatory oversight, and financial market development. A well-balanced approach ensures that FIIs remain a source of growth rather than a potential source of instability. Ultimately, the goal is to harness foreign investment for sustainable economic development while safeguarding the domestic economy from external shocks and speculative risks.
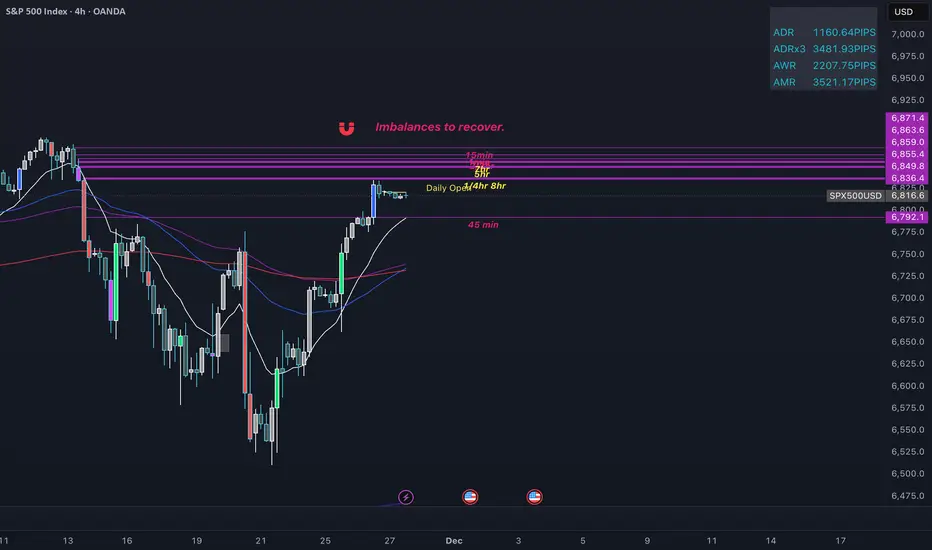
SPX500 Coiling Below Imbalance Cluster — Liquidity Buildup Befor🧠 Update:
SPX500 has pushed higher since the last update and is now consolidating just below a significant cluster of unfilled imbalances (vector candles) spanning multiple timeframes — 5min, 15min, 1hr, 2hr, 4hr, and 8hr.
This confluence of inefficiencies above is acting like a liquidity magnet. Price is currently hovering beneath this stack, potentially accumulating liquidity through sideways action. This type of coiling behavior often precedes a sharp expansion, especially when price respects support levels (e.g., Daily Open, 45min imbalance) without closing below.
Key Insight:
If price remains supported and continues ranging under this cluster, it's likely creating inducement (liquidity) above. Once enough buy-side liquidity is built up, a breakout targeting the imbalance zones becomes a high-probability scenario.
📍 Levels of Interest:
✅ Imbalance Zones:
5min / 15min / 1hr / 2hr / 4hr / 8hr vectors (magenta)
🟡 Daily Open Holding as Support
🔮 Projected Move: Coiling → Liquidity Grab → Imbalance Fill
Keep an eye on any sweep of local highs followed by bullish delta or volume confirmation — that could be the trigger.
Idea will be updated as structure develops further.
SPX500 Roadmap: Liquidity Pools & Imbalance Zones AboveSPX500 has created a cluster of imbalances (vector candles) on multiple timeframes — 8min, 45min, 1hr, 2hr, 4hr and 8hr — all sitting above current price. These zones often act as magnets, especially when aligned across several TFs.
Price is currently stabilizing below the 45-minute imbalance and forming a potential structure that could lead to a liquidity sweep before pushing higher.
Key idea:
If price maintains support and continues following this projected structure, the next major objective would be the stacked imbalance zones shown in purple. These remain unfilled inefficiencies in the chart and historically tend to be revisited.
This isn’t a guarantee — just a technical roadmap focusing on where liquidity and inefficiencies remain.
Levels marked:
8min imbalance
45min imbalance
1hr / 2hr / 4hr / 8hr imbalances
Structural projection (yellow path)
Will update as price develops.

US500: Balancing Rate-Cut Optimism, AI Hype, and Growth RisksUS500: Balancing Rate-Cut Optimism, AI Hype, and Growth Risks
Technical Analysts
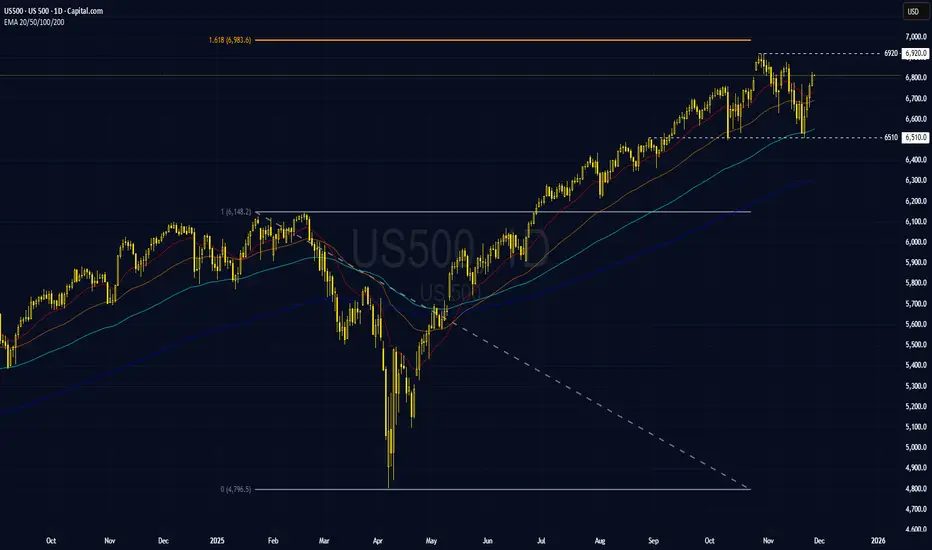
1. US500 bounced off EMA100 for the first time in six months, flagging a weak upside momentum and raising the potential of a corrective phase, with price likely to consolidate within the 6,510–6,920 range.
2. That said, the EMA stack remains positively aligned, keeping the broader bias to the upside.
3. A decisive break above the prior high near 6,920 would confirm uptrend continuation, opening the door to further gains.
4. Conversely, the 6,920–6,980 area is a key resistance zone; failure to clear this area would increase the odds of a pullback toward support around 6,510.
Fundamental analysis
The US500 is being driven by a mix of supportive and negative factors.
5. On the supportive side, expectations of a Fed rate cut in December help boost risky assets, while lower bond yields encourage investors to seek higher-yielding assets.
6. On the negative side, US economic data have shown signs of weakness, including labor market indicators and economic activities, alongside stretched valuations in tech stocks and concerns over AI-related spending.
7. All of these factors are likely to keep the US500 trading within a range and volatile, amid shifting fundamentals and an index that has already risen significantly since the start of the year. Any further rallies could be followed by profit-taking.
8. Key points to watch are major data releases such as labor market figures, inflation, and evolving expectations for a Fed rate cut in December.
Analysis by: Krisada Yoonaisil, Financial Markets Strategist at Exness
The World Economy’s Journey in the Trading Market1. Early Foundations: The Birth of Global Trade
Modern world trade began centuries ago with land routes, maritime exchanges, and colonial expansions. However, true economic globalization began after the Industrial Revolution.
Factories produced goods at scale, and countries required raw materials, capital, and new markets. This interdependence set the foundation for a global trading web.
Key Features of Early Global Trade
Simple Trading Infrastructure: Telegraphs, ships, and railways connected markets but at slow speeds by today’s standards.
Commodity Dominance: Coal, textiles, metals, and agricultural products drove trade volumes.
Gold Standard: Most countries pegged their currencies to gold, stabilizing international trade.
Though primitive compared to today, these early systems planted the seeds for a unified world economy.
2. Post-War Growth and the Era of Financial Globalization
After World War II, nations realized that economic cooperation was essential for peace and progress. This launched institutions like:
IMF (International Monetary Fund)
World Bank
GATT → WTO (World Trade Organization)
These bodies shaped trade rules, stabilized currencies, and opened markets.
The Bretton Woods System
The global economy operated under a fixed exchange-rate regime led by the U.S. dollar pegged to gold. This stable environment helped:
Facilitate international trade
Increase capital flows
Rebuild war-torn economies
When the system collapsed in 1971, floating exchange rates emerged, giving birth to modern currency trading.
3. Rise of Capital Markets: Stocks, Commodities, and Currencies Go Global
From the 1980s onward, deregulation and technology transformed world markets.
Key Milestones
Electronic trading platforms replaced floor trading.
Multinational corporations expanded production globally.
Derivatives markets (futures, options, swaps) exploded in size.
Hedge funds, investment banks, and pension funds became major market players.
Oil, gold, and commodity futures shaped inflation and energy policies.
This period marked a fundamental shift:
Trade was no longer limited to goods; money itself became the most traded commodity.
Foreign exchange (forex) grew into a $7-trillion-a-day market, making it the largest financial market in the world.
4. Digital Revolution: The 21st Century Trading Landscape
With the rise of the internet and high-speed computing, the early 2000s launched the digital trading era.
What changed?
Algorithmic trading (algo trading) began executing trades in milliseconds.
Online brokerages democratized market access.
Financial information became instant and global.
High-frequency trading (HFT) reshaped liquidity and market volatility.
Cryptocurrencies emerged as a parallel financial system.
Mobile trading apps made stock participation mainstream.
The world economy became deeply connected: A policy change in China or a tweet from a global leader could move markets worldwide.
Key Drivers of Modern Global Trade
Technology
Capital mobility
Global supply chains
Central bank policies
Cross-border investments
This phase also brought unprecedented speed—capital could fly across continents in seconds, impacting currencies, equities, commodities, and bond markets simultaneously.
5. The Shockwaves: Crises That Reshaped Global Markets
Major global events redefined the world economy’s trading journey:
2008 Global Financial Crisis
Triggered by U.S. mortgage collapse
Nearly crashed global banking
Led to quantitative easing (QE) era
Pushed interest rates to near zero
This event emphasized how interconnected global markets had become.
COVID-19 Pandemic (2020)
Disrupted supply chains
Crashed global demand initially
Fuelled the greatest monetary stimulus in history
Caused inflation waves across the world
Financial markets experienced extreme volatility, while digital and retail trading boomed.
Russia–Ukraine Conflict
Massive impact on energy, oil, natural gas, and wheat prices
Reshaped Europe’s energy landscape
Elevated geopolitical risk across global markets
Each crisis reshaped trading behavior, capital flows, risk perception, and investor psychology.
6. The Shift to Multipolar Trading: De-globalization Begins
From 2020 onwards, a new phase began: geoeconomic fragmentation.
The world is slowly drifting away from a U.S.-centric model into a multipolar system with major players like:
United States
China
India
European Union
Middle East (as energy and investment hubs)
Emerging Trends
Friend-shoring and reshoring of supply chains
Rise of regional trade blocs
Energy transition reshaping commodity markets
Local currency trade agreements (INR, yuan, ruble)
Digital currency experimentation by central banks (CBDCs)
Countries are building self-reliance while still operating within global markets—a hybrid model of globalization.
7. The Future: Where the World Economy and Trading Market Are Heading
The journey continues as new forces redefine global trade:
A. Rise of AI-Driven Markets
Artificial Intelligence is changing how markets function:
Real-time market prediction
Automated portfolio rebalancing
Sentiment analysis through big data
Algorithmic hedging strategies
Ultra-fast execution
Trading is becoming more data-driven, precise, and automated.
B. Green Energy and Commodity Supercycles
The global shift toward renewable energy is reshaping:
Lithium
Copper
Nickel
Rare earth metals
Natural gas
These commodities are becoming the new strategic assets of the 21st century.
C. Battle of Currencies: USD vs New Regional Powers
The U.S. dollar still dominates global trade, but new challenges are rising:
China promoting yuan settlement
India increasing INR trade agreements
Middle East exploring oil trade in non-USD currencies
Digital currencies becoming part of financial networks
While the dollar remains strong, the future will likely see multiple important currencies power trade.
D. Digital Assets and Blockchain
Crypto, tokenization, and blockchain-based systems are reshaping:
Settlement speed
Transparency
Cross-border payments
Decentralized finance (DeFi)
Tokenized commodities and real-world assets
This could become the next major phase of global trading.
Conclusion: A Journey That Never Stops
The world economy’s journey in the trading market is a story of continuous evolution—driven by technology, politics, crises, and the collective ambitions of nations and markets.
From simple trade routes to AI-based trading desks, from gold-backed currencies to digital assets, and from regional markets to global interdependence—the world of trade has expanded beyond imagination.
Today’s global economy is:
Faster
More interconnected
More competitive
More volatile
More data-driven
And the journey ahead promises even greater transformation as nations redefine alliances, technology reshapes markets, and investors navigate an increasingly complex global landscape.


SPX - Setups for both Long and Short SPX is approaching a trendline that will give us direction is which way to trade. A break above this line we can look for longs, any type of rejection such as bearish engulfings on the line, is a good risk short trade. Feel free to drop opinions!

US500 Outlook: Upside Bias Persists.Fundamental Analysis: Macro Drivers
Market participants are currently expressing renewed confidence in Federal Reserve rate cuts, driving a risk-on sentiment that is the primary support for US equity valuations and the US500. Lower interest rates decrease discount rates for future earnings, which benefits growth-oriented sectors like technology and consumer discretionary.
The US500’s rally benefits from the prevailing market view that the Fed will cut interest rates, a primary factor reducing the discount rate and lifting asset valuations. Additionally, earnings strength from mega-cap technology companies like Nvidia (NVDA), Meta Platforms (META), and others reinforces market optimism and risk appetite. Although US job growth softened, recent payrolls data exceeded expectations, and falling inflation supports the case for monetary easing. Focus turns to further US economic data to confirm growth risks
Technical Analysis: Breakout and Targets
US500 recently broke above the psychological resistance at 6,770, indicating strong upward momentum. The price is currently consolidating gains near this former resistance. Should the rally continue, the next major upside target for US500 is the resistance at 6,830.
Conversely, falling below the 6630-6700 range could lead US500 to retest the subsequent support at 6,515. US500 will likely find initial support near 6630 if a minor pullback occurs
Outlook: Upside Bias Persists
With dovish Fed expectations and continued strong performance from the technology sector, the US500 outlook maintains an upside bias. Closing above 6,830 could prompt US500 to retest the following resistance at 6,925. However, volatility may increase as investors watch for any major shift in the economic environment or a change in the Fed's guidance.
Analysis by Terence Hove, Senior Financial Markets Strategist at Exness.


US500How to become successful in forex and stock trading: 1.Master fundamentals and technical analysis. 2,Build and follow a solid trading plan. 3.Apply strict risk management (1–2% rule). 4.Stay disciplined—control fear and greed. 5.Record and analyze every trade. 6.Focus on high-quality setups only. 7.Diversify across assets and markets. 8.Keep evolving—study, adapt, and grow daily.

$SPY Bullish structure on lower time frames looks dangerousAMEX:SPY Bullish structure on lower time frames looks dangerous.
Expect to retrace most of it today or tomorrow.
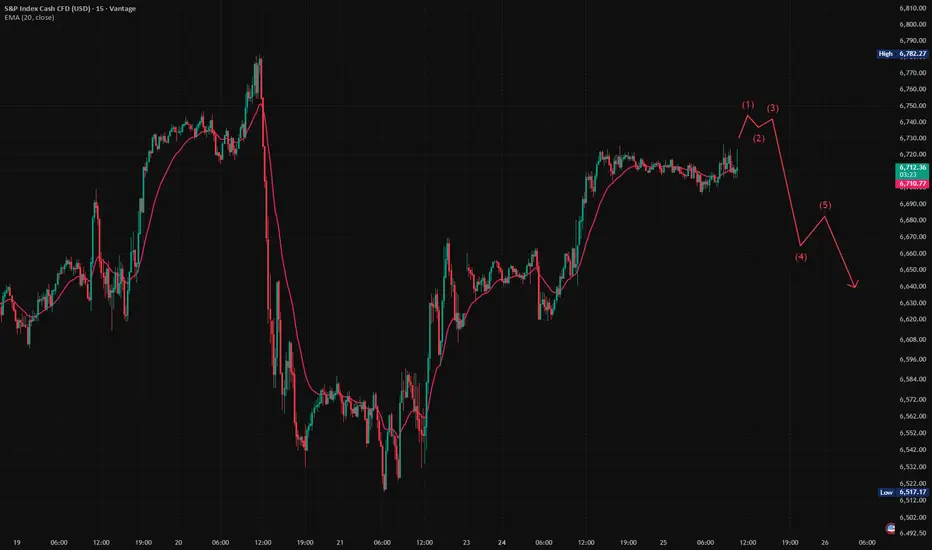
SPX500 Short
Deep crab pattern completes on M15, mapping a potential reversal zone.
Multiple tops formed on M15 and M30 at the same area, reinforcing overhead supply from the prior day’s high that price could not break.
RSI reached overbought on M15 and M30, indicating crowded long positioning.
Approximately 20 points of RSI bearish divergence across M15 and M30, consistent with a weakening advance.
H4 has turned down after last week’s rebound and now aligns with a downside continuation view.
Daily slope is flattening and price is trading beneath it, suggesting the early stages of a broader reversal can develop if sellers follow through.
Bias is short of the reversal zone identified by the deep crab and repeated tops.
Stop loss set at 50 pips to cap risk if resistance fails.
First target at 6,600, which is 100 pips from entry, with room to manage partials at nearby structure if momentum confirms.
Several US indices and other global indices are printing similar topping behavior and momentum fades, adding intermarket confluence to the short idea.
