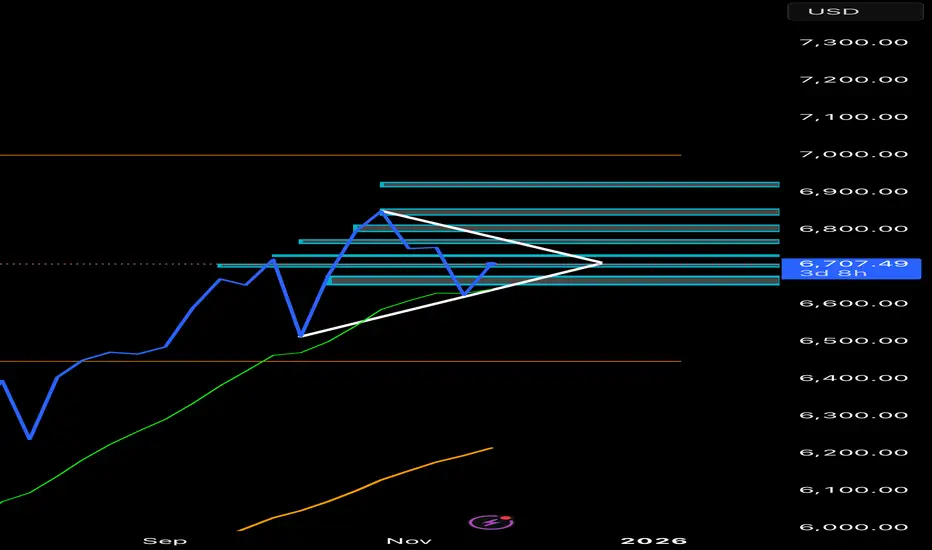
Weekly Bullish PennantPossible Bullish pennant forming on weekly.
Looking for price to keep forming pennant.
Could see a possible breakout December or January.
Trade ideas
S&P500 rally to continue? The S&P 500 extended its rebound yesterday, rising +1.55% for its best session in six weeks and +2.54% over two days, helped by growing expectations of a Fed rate cut in two weeks. Sentiment was also lifted by renewed tech optimism and headlines suggesting progress in Ukraine ceasefire talks, which supported equities, credit, and bonds.
In tech, Nvidia fell on reports Meta may shift billions in AI-chip spending toward Google, while Alphabet gained on stronger AI momentum. Geopolitical risk remains elevated as Russia and Ukraine traded heavy fire despite diplomatic activity, but markets are focusing on the possibility of de-escalation.
Overall: Momentum remains constructive for the S&P today, with supportive macro drivers, but tech dispersion and geopolitics could create intraday volatility.
Key Support and Resistance Levels
Resistance Level 1: 6770
Resistance Level 2: 6800
Resistance Level 3: 6823
Support Level 1: 6660
Support Level 2: 6640
Support Level 3: 6613
This communication is for informational purposes only and should not be viewed as any form of recommendation as to a particular course of action or as investment advice. It is not intended as an offer or solicitation for the purchase or sale of any financial instrument or as an official confirmation of any transaction. Opinions, estimates and assumptions expressed herein are made as of the date of this communication and are subject to change without notice. This communication has been prepared based upon information, including market prices, data and other information, believed to be reliable; however, Trade Nation does not warrant its completeness or accuracy. All market prices and market data contained in or attached to this communication are indicative and subject to change without notice.

Currency Peg Rates and Their Role in the Global Market1. What Are Currency Pegs?
A currency peg is an agreement by a government or central bank to maintain its currency at a fixed exchange rate relative to another currency. Common anchors include:
US Dollar (USD) – most dominant
Euro (EUR) – used by countries in Europe or those influenced by EU trade
A basket of currencies – used by nations wanting diversified stability
Examples include:
Hong Kong dollar peg to USD
Saudi riyal peg to USD
Danish krone peg to Euro
In a pegged system, the central bank must intervene in the forex market—buying or selling foreign reserves—to maintain the peg.
2. Why Countries Use Currency Pegs
A. To Promote Trade Stability
Trade depends heavily on predictable currency values. When a country pegs its currency to that of a major trading partner, exporters and importers face fewer exchange-rate risks. This stability helps:
Boost long-term trade agreements
Encourage foreign direct investment (FDI)
Reduce transaction costs
For example, Gulf countries selling oil in USD benefit from a USD peg since their export revenues stay stable.
B. To Control Inflation
Countries with historically volatile monetary systems use pegs to “import stability” from stronger economies. Pegging to a disciplined currency forces domestic monetary policy to align with the anchor country’s stability. This helps:
Reduce hyperinflation
Maintain price stability
Build investor trust
Argentina, for instance, used a USD peg in the 1990s to curb runaway inflation.
C. To Attract Foreign Investment
Foreign investors prefer stable exchange rates. Pegs give clarity and reduce forex risk, which is appealing for:
Portfolio investors
Foreign companies setting up factories
Global banks
Stable currencies reduce uncertainty and encourage long-term investment.
D. To Protect Small or Open Economies
Small economies with limited export diversity or unstable political environments benefit greatly from a fixed currency. Pegs help maintain:
Financial order
Market confidence
Predictable business conditions
This is why many island nations and resource-dependent economies use fixed exchange rates.
3. How Currency Pegs Work in the Global Market
A. Central Bank Intervention
To maintain the peg, the central bank must buy or sell foreign reserves.
If the domestic currency weakens, the central bank sells foreign reserves to support it.
If it strengthens, the central bank buys foreign currency to prevent appreciation.
This mechanism keeps the domestic currency within a defined band.
B. The Role of Foreign Exchange Reserves
Countries with pegs must maintain large forex reserves. These reserves act as a buffer to defend the peg during market volatility.
China, Saudi Arabia, and Hong Kong maintain significant reserves for this reason.
C. Impact on Global Capital Flows
Pegs influence how money moves across borders. A stable peg can attract capital inflows, while a weak or unsustainable peg can trigger:
Speculative attacks
Rapid capital outflows
Market panic
The 1997 Asian Financial Crisis is a classic example where unsustainable fixed rates caused speculative attacks.
4. Advantages of Currency Pegs in the Global Market
A. Stability for Trade and Investment
Currency pegs reduce exchange-rate volatility, supporting international trade and long-term contracts.
B. Confidence Building
Investors and trading partners trust economies whose currencies behave predictably.
C. Lower Inflation
Pegs can anchor domestic prices to those of more stable economies.
D. Strategic Trade Advantages
Countries can peg at undervalued levels to maintain export competitiveness. China historically used a partially managed peg for this purpose.
5. Challenges and Risks Associated with Currency Pegs
A. Loss of Monetary Policy Independence
The biggest drawback is that a country cannot freely decide its interest rates. It must follow the monetary policy of the anchor country to maintain the peg.
This can be problematic during domestic recessions or inflationary pressures.
B. Requirement of Large Forex Reserves
Defending a peg requires massive reserves, which is costly. Without sufficient reserves, the peg becomes vulnerable.
C. Vulnerability to Speculative Attacks
If traders believe a peg is unsustainable, they can short the currency. This can collapse the peg, as seen in:
Thailand (1997)
Mexico (1994)
Argentina (2001)
D. Economic Distortions
A peg can create artificial stability. If the currency is pegged too high or too low, it can misrepresent true economic conditions, leading to:
Trade imbalances
Over-reliance on imports
Asset bubbles
6. Currency Pegs and Global Economic Events
A. During Oil Price Shocks
Oil-exporting countries with USD pegs remain stable because oil is traded globally in dollars. Pegs help smooth revenue fluctuations.
B. During Financial Crises
Some countries break their pegs during crises to regain monetary control, while others defend their pegs to maintain confidence.
C. During Global Inflation Waves
When the anchor currency experiences inflation (e.g., USD inflation cycles), countries pegged to it import inflation as well. This can create stress on domestic economies.
7. How Pegs Influence Global Trade Dynamics
Currency pegs can make countries more competitive in global markets. For example:
If a currency is pegged at a lower level, exports become cheaper.
If pegged too high, imports become cheaper but exports suffer.
This can trigger global reactions, including tariff threats or currency war accusations.
8. The Future of Currency Pegs
Even as digital currencies and floating rates dominate modern finance, currency pegs continue to play a vital role. Many countries rely on them for stability, while some use hybrid systems:
Managed float with a peg band
Basket-based pegging
Pegged but adjustable systems
With growing geopolitical tensions, shifts in trade alliances, and rising interest-rate cycles, pegs will remain influential tools in shaping global markets.
Conclusion
Currency peg rates are powerful tools that shape global economic behaviour. By tying a currency to a stable or strategically chosen anchor, countries can enhance trade stability, control inflation, and attract investment. However, they also face challenges such as loss of monetary independence, speculative risks, and heavy reliance on foreign reserves.
In the global market, currency pegs are both stabilizers and potential sources of volatility—depending on how well they are maintained. Their importance will continue as countries navigate an increasingly interconnected and uncertain economic environment.
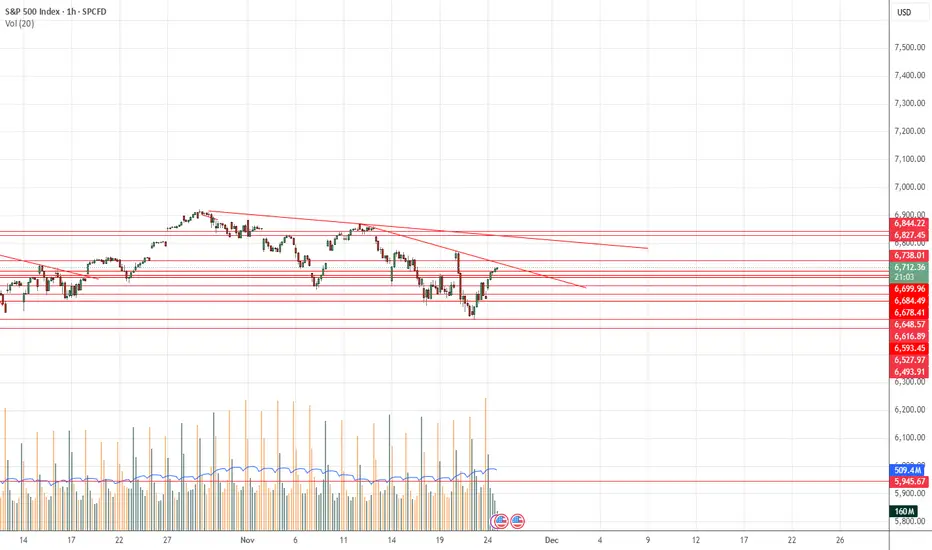
spx levels for this weekright now it's making lower lows, break above 6771 level bulls will catch the run
$SPY bullishness today is not looking goodThis is a clear trading range. Trading ranges always have on thing in common and that is that they are usually keep going back to the middle.
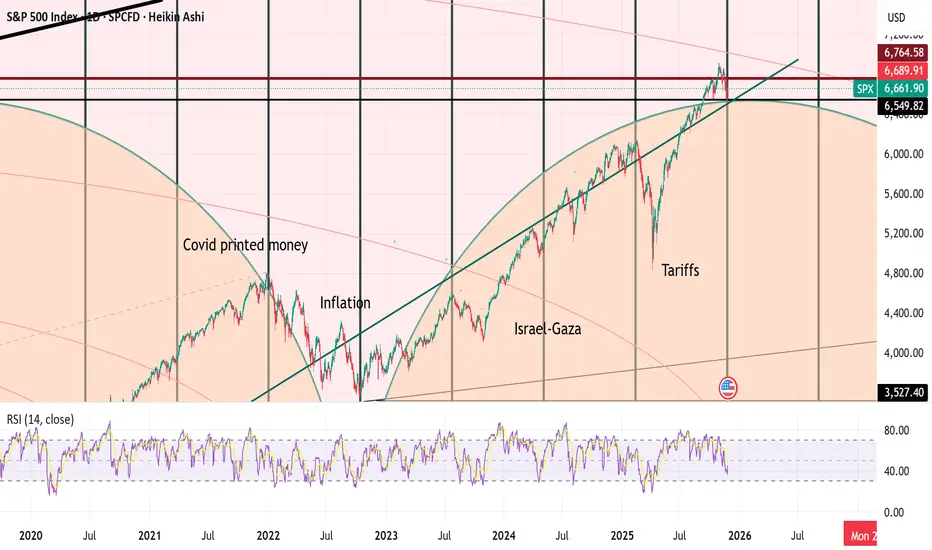
Forget the Crash Talk – SPX Is Ready to Climb
I have seen something really interesting: I have been observing the daily chart and I saw that every 198 bars Sp500 maks major turning points.
The S&P 500 just closed a 198-bar cycle on the daily chart—a pattern that has historically marked major turning points. Last Friday (Nov 21) was that moment.
While headlines scream recession and some see in the monthly a possible head-and-shoulders setup pointing to a 1929-style collapse, I see something different: a structural bottom and the start of a new bullish leg.
Cycles don’t lie. Every time this rhythm completes, SPX moves decisively—and this time, the setup favors the upside.
📈 My view: The market is gearing up for a rebound.
Weekly Outlook: XAUUSD, #SP500, #BRENT | 28 November 2025XAUUSD: BUY 4050.00, SL 4000.00, TP 4200.00
Gold starts the week at elevated levels: morning reports place spot near 4,054.19 per ounce. Investors keep hedging against political and geo-economic risks, while temporary gaps in US official data releases make it harder for the Fed to rely on the usual inputs, which supports demand for safe assets. Into the December meeting, markets see a meaningful probability of a rate cut, easing dollar financial conditions and backing the metal. Additional drivers include steady inflows into gold funds and continued central-bank buying through the autumn.
The weekly balance looks constructive: swings in US Treasury yields remain contained, while official purchases and investment inflows provide a demand cushion. Risks to the bullish case include a stronger dollar alongside rising real yields and more restrictive remarks from some Fed officials, which could delay policy easing. Even so, the combination of scarce safe-haven alternatives and ongoing investment demand argues for support on pullbacks.
Trading recommendation: BUY 4050.00, SL 4000.00, TP 4200.00
#SP500: BUY 6600, SL 6500, TP 6900
Last week ended with a pullback in the major US indices, but the new week begins on a calmer footing: S&P 500 futures are firmer in early trade, and the debate around the December Fed decision is tilting toward some easing. In aggregate, that reduces borrowing-cost pressure and underpins expectations for future earnings. Through November, strong corporate results helped: realized S&P 500 earnings growth clearly outpaced estimates from the start of the quarter, softening the drag from lofty valuations.
Over the week ahead the setup is mixed but mildly positive: the prospect of easier Fed policy, 10-year yields stabilizing near 4%, and softer oil prices improve cost and margin expectations for several sectors. Headwinds include elevated volatility among tech leaders and uncertainty about the timing of subsequent policy steps. In this backdrop, a modest upside for the benchmark looks like the base case unless inflation risks re-accelerate unexpectedly.
Trading recommendation: BUY 6600, SL 6500, TP 6900
#BRENT: SELL 62.50, SL 65.00, TP 55.00
Oil opened the week under pressure: morning reports show Brent around 62.46 per barrel. The market is digesting headlines that trim the geopolitical premium and imply a possible gradual expansion of supply over the medium term. At the same time, US commercial inventories continue to trend higher, and recent projections point to stock builds in Q4, which also weighs on prices.
On the supply side, OPEC+ decisions for year-end and the working configuration for early next year do not remove oversupply concerns: growth from producers outside the alliance together with the recovery in certain exports continues to pressure the futures curve. A firmer dollar also caps prices by raising the cost of imported crude for consumers. Net-net, the base case for the week is a continuation of the downward drift, with occasional bounces on sanction or disruption headlines.
Trading recommendation: SELL 62.50, SL 65.00, TP 55.00

SPX into the open,.Monday 24th NovemeberThe pattern is startng to get bullish
Big test is if gets to 6700 aLets see what happensrea

Consumer Price Index (CPI) Data in the Global Market1. Meaning of CPI and Why It Matters
CPI measures the average change in prices paid by consumers for a set of goods and services over time. This “basket” typically includes:
Food and beverages
Housing
Transportation
Apparel
Medical care
Education
Recreation
Communication and utilities
Because CPI directly represents consumer purchasing power, it helps economists determine whether the cost of living is rising or falling. In the global context, CPI is a major tool for comparing economic conditions across countries. Large economies like the US, EU, China, India, and Japan publish CPI monthly, influencing global financial markets.
2. CPI and Inflation: The Core Relationship
Inflation is the rate at which prices rise, reducing the value of money. CPI serves as the most widely accepted measure of consumer inflation. When CPI rises sharply:
Consumers pay more for the same goods
Savings lose value
Borrowing may become costlier if interest rates rise
Businesses face higher input costs
When CPI rises moderately, it often signals healthy economic growth. Very low or negative CPI (deflation) suggests weak demand and economic slowdown.
3. Types of CPI: Headline and Core Inflation
Headline CPI
Includes all items in the basket, including volatile components like food and energy.
Strongly influenced by fuel prices, supply chain issues, weather shocks.
Core CPI
Excludes food and energy to reflect long-term inflation patterns.
Used by central banks to design monetary policies.
In the global market, core CPI is often viewed as the more stable and reliable indicator because it filters out short-term price volatility.
4. How Countries Use CPI in the Global Market
1. Monetary Policy Decisions
Central banks such as the Federal Reserve (US), ECB (Eurozone), Bank of England, RBI (India), and Bank of Japan rely heavily on CPI numbers.
If CPI rises above the target, central banks typically raise interest rates to control inflation.
If CPI falls below the target, they cut interest rates to stimulate demand.
Interest rate changes influence capital flows across borders, making CPI a global market mover.
2. Currency Market Impact
Currency traders react strongly to CPI releases because inflation affects interest rate expectations.
Higher CPI → Higher inflation → Higher probability of interest rate hikes → Currency strengthens
Lower CPI → Lower inflation → Rate cuts possible → Currency weakens
For example, a positive US CPI surprise often leads to a stronger US dollar, impacting emerging market currencies.
3. Trade Competitiveness
CPI also reflects the relative price competitiveness of a country. High inflation may make a country’s goods more expensive globally, reducing export competitiveness.
5. CPI Effects on Global Financial Markets
1. Stock Markets
CPI data significantly affects stock indices like the S&P 500, Dow Jones, Nikkei, Nifty, and FTSE.
High CPI is often negative for equities
Signals inflation pressure
Higher interest rates reduce corporate profits
Consumer spending may slow
Moderate CPI growth is positive
Signals healthy demand
Supports corporate earnings
Indicates stable economic expansion
Growth sectors like technology react strongly to CPI because they rely on cheaper capital.
2. Bond Markets
Bond prices and yields react instantly to CPI.
If CPI rises, bond yields rise because investors demand higher returns to compensate for inflation.
If CPI falls, yields may decrease as inflation expectations ease.
Government bonds (US 10-year Treasury, German Bunds, UK Gilts) are highly sensitive to CPI surprises.
3. Commodity Markets
Inflation affects commodity prices directly:
Oil and energy: Higher CPI reflects demand pressure.
Gold: A hedge against inflation; tends to rise when CPI is high.
Agricultural commodities: CPI reflects food inflation trends.
Global commodity traders watch CPI to anticipate supply-demand dynamics.
6. CPI and Global Economic Stability
1. Inflation Targeting
Most central banks aim for inflation around 2%, as this level supports stable growth.
Too much or too little inflation affects global trade and investment decisions.
2. Emerging Markets Impact
Emerging markets like India, Brazil, and South Africa are highly sensitive to global CPI trends:
Rising US CPI may cause capital outflows from emerging markets.
Higher domestic inflation may pressure their currencies and foreign reserves.
Thus, CPI is crucial for maintaining macroeconomic stability.
7. Factors Influencing CPI in the Global Market
Several global forces drive CPI fluctuations:
1. Supply Chain Disruptions
Events like pandemics, wars, logistics delays, and shipping container shortages cause shortages and price spikes.
2. Commodity Prices
Oil prices directly impact transportation, manufacturing, and food costs.
3. Currency Movements
A weaker currency makes imports costlier, raising national CPI.
4. Geopolitical Tensions
Wars or sanctions can disrupt energy and food supply, increasing inflation.
5. Global Demand Cycles
Strong global demand (e.g., during recovery phases) tends to increase CPI.
8. CPI and the Future of Global Markets
The role of CPI is expanding as economies become more interconnected. Some future trends include:
1. AI and Big Data in CPI Measurement
Governments increasingly use digital tools to track price changes across online marketplaces.
2. Climate Change and CPI
Extreme weather events may raise food and energy prices globally, influencing CPI patterns.
3. Deglobalization and Supply Chain Reshoring
Countries shifting production back home may face temporary inflation spikes.
4. Rising Importance of Core CPI
As economies evolve, stable long-term indicators are becoming more important for policymakers.
Conclusion
CPI data plays a central role in shaping global market trends. It influences interest rates, currency values, bond yields, stock prices, and trade competitiveness. For investors, traders, businesses, and policymakers, CPI is not merely a number—it is a key indicator of economic health, inflationary pressures, and future financial conditions. Understanding CPI helps decode the direction of global markets and anticipate policy shifts that shape the global economic landscape.
SPX Idea 23.11.2025I also have several scenarios for SPX, unfortunately for this one, it's not possible otherwise. I would consider a potential short first when the SFP is above the weight at the price level of 6883 and then above the new ATH. I would open a long position at the level around Vwap 6453, where the daily level is also nearby, and then at the level of 6200, where the Vwap and weekly levels are located for context, and then a little lower, the Fibo level of 0.382.

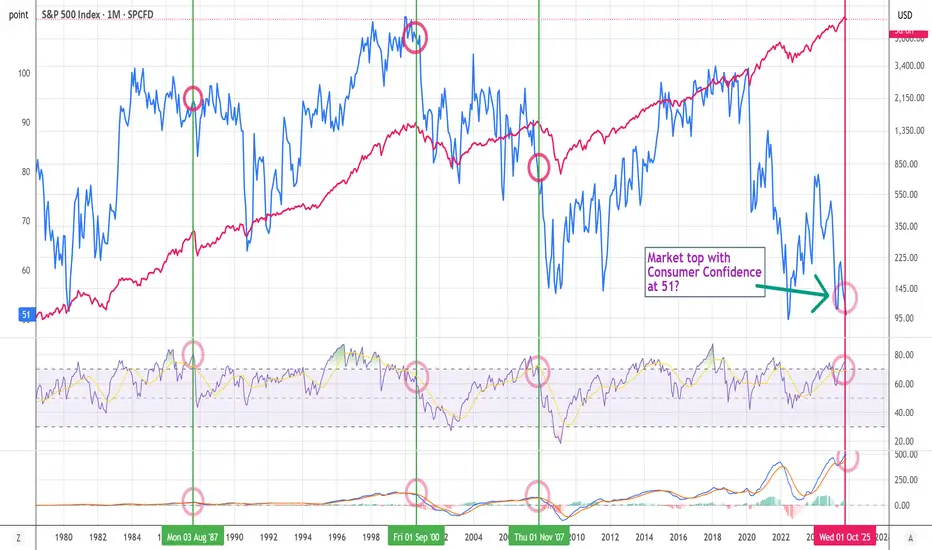
Consumer sentiment vs SPX - Is this the top?🧠 Historically, market tops happen when optimism peaks — not when consumers feel miserable.
Today, the U.S. Consumer Confidence Index sits at just 51, near recessionary levels.
Hard to call this a “market top” when sentiment is this low.
#SPX #Macro #MarketCycle #Investing
sp500 4h🔹 Overall Outlook and Potential Price Movements
In the charts above, we have outlined the overall outlook and possible price movement paths.
As shown, each analysis highlights a key support or resistance zone near the current market price. The market’s reaction to these zones — whether a breakout or rejection — will likely determine the next direction of the price toward the specified levels.
⚠️ Important Note:
The purpose of these trading perspectives is to identify key upcoming price levels and assess potential market reactions. The provided analyses are not trading signals in any way.
✅ Recommendation for Use:
To make effective use of these analyses, it is advised to manually draw the marked zones on your chart. Then, on the 15-minute time frame, monitor the candlestick behavior and look for valid entry triggers before making any trading decisions.

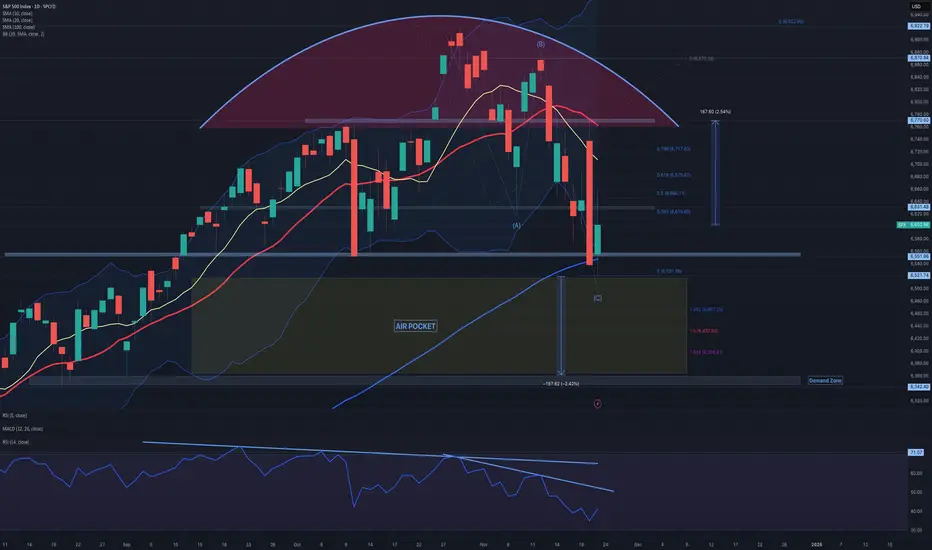
$SPX: dead cat bounce SP:SPX : Following the unexpected downturn on Thursday, SP:SPX stabilized last Friday after an intraday decline below the horizontal support at 6,550, which aligns with the 100-day simple moving average (SMA). The candlestick wicks on the daily chart suggest a potential short-term pause in the prevailing selling pressure. Monday will probably see a continuation of the rebound from Friday’s lows; however, it remains unclear whether Friday’s low marks the end of the current pullback. The RSI14 is approaching, but not yet within, oversold territory, and does not exhibit positive divergence. For the upside scenario, retracement levels from Friday’s high have been identified. Bulls must first reclaim the 6,530 resistance to maintain momentum; nevertheless, unless the key resistance at 6,770—168 points above Friday’s close—is breached, the probability of another downward move remains elevated, targeting the 6,360–6,340 region.
SP500 to 5700It was not the AI bubble, it was Venezuela.
This is an idea linked to a possible intervention of US military in Venezuela, provided some airlines (Iberia, Tap,...) have cancelled their flights to the country on Nov 22nd.
If this happens, we can see Oil going up, affecting the whole stock market.
We can see what happened during Ukraine War, also linked to energy prices.

Bullish continuation of US500Looks like a pullback on the downtrend of the US500, may potentially move upto 6750 in the coming week(s).

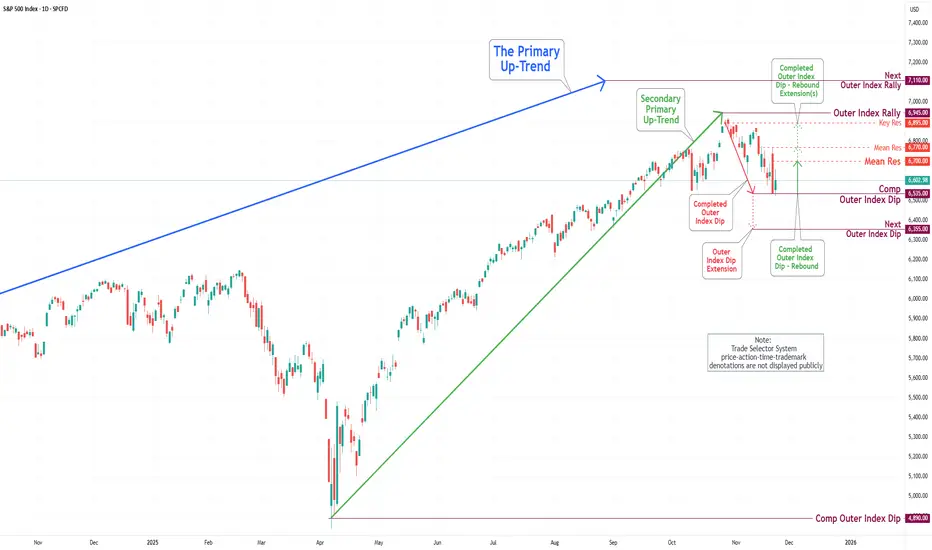
S&P 500 Daily Chart Analysis For Week of Nov 21, 2025Technical Analysis and Outlook:
In the last trading session, the S&P 500 Index exhibited significant gyrations, implying a pump-and-dump scenario and highlighting the significance of our completed Outer Index Dip at 6,535.
At present, this position suggests the possibility of further upward movement, with the primary targets established at the Mean Resistance levels of 6,700 and possibly 6,770. Furthermore, there exists a well-defined extension towards the Key Resistance level of 6,895, with an ultimate target for the Outer Index Rally set at 6,945.
Nonetheless, it is imperative to acknowledge the risk of a potential drawdown in the forthcoming trading session. Such an event could result in prices retesting the completed Outer Index Rally at 6,535, as well as the expansion towards the next Outer Index Rally at 6,355.
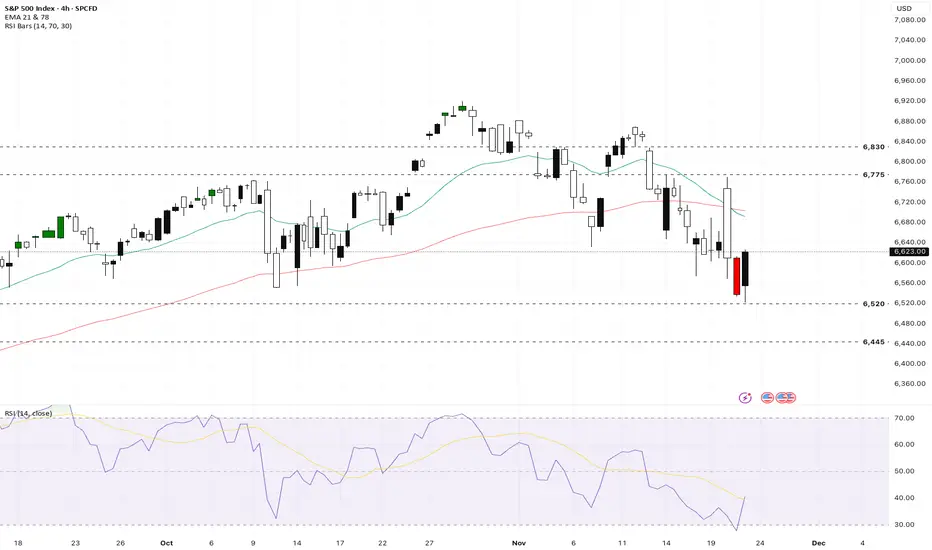
US500 remains under pressure as technology sector momentum coolsThe US500 moved lower after a volatile session marked by fading momentum in technology stocks and renewed macroeconomic uncertainty. Despite short-term weakness, the index remains up almost 10% year-on-year compared to this period in 2024.
Fundamental analysis
The US Federal Reserve policy is now in sharp focus, with remarks from policymakers supporting expectations for a possible interest rate cut in Dec, which is inspiring a slight rebound and giving traders hope for year-end support. Fed New York President Williams said the central bank has room to cut rates again soon as the labor market softens, which improved sentiment. Recent strong US earnings, including from key US 500 members, have offered some relief but have not reversed the current downward trend as AI-driven enthusiasm cools. Renewed fiscal uncertainties, increasing debt issuance, and mixed economic data have weighed on sentiment.
Technical analysis
The index charted a bearish engulfing candlestick below its EMA21, suggesting sellers still control price action in the short term. Key resistance is observed near 6775 and 6830, while immediate support is now at 6520 and a major support at 6445. The volatility index (VIX) jumped by nearly 12% to 26.42, signaling rising market stress and a defensive posture by portfolio managers. In a technical warning that sellers have seized control, charts show Thursday’s losses fully erased the previous session’s advance. The Bearish Engulfing pattern was unusually large and swift and echoed a similar setup in early Mar that preceded a 5% drop in the index. The US500 broke below both its EMA21 and EMA78, levels that many traders view as key lines of support.
Sentiment and outlook
A $5 tln slide in global equities has left investors questioning how much further the tech-led pullback can go. US stock futures swung between gains and losses in volatile trading amid a sustained retreat from the market’s riskier corners. However, seasonality is historically positive heading into Thanksgiving week, and many market participants expect a rebound into year-end, especially with the Fed likely leaning dovish and volatility peaking. Risk appetite remains subdued, but technical and macro catalysts point toward possible stabilization and recovery if central bank signals remain supportive.
Analysis is by Terence Hove, Senior Financial Markets Strategist at Exness
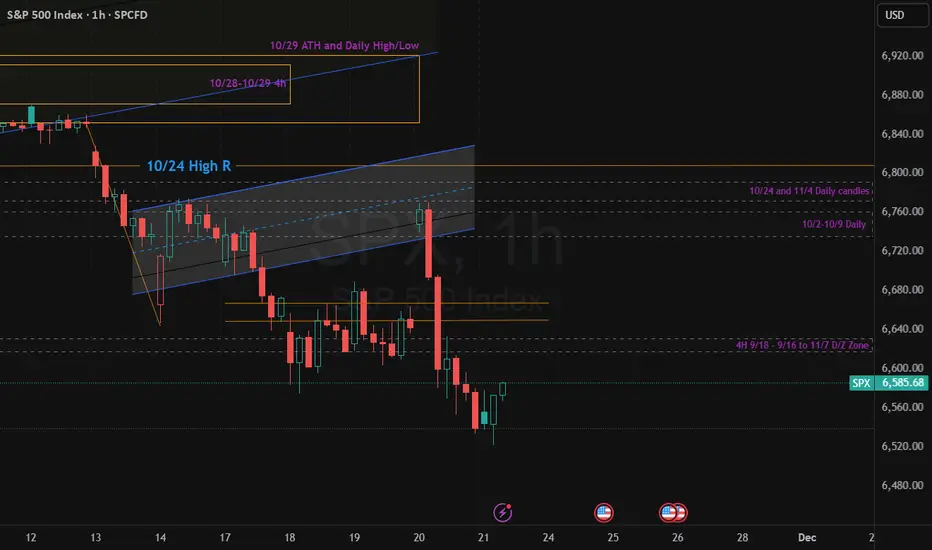
$SP:SPX $SPX 1H update Nov 21Check Bear-flag thesis from Nov 17 played out cleanly. We got the rising parallel channel after the late-Oct dump, then a decisive 1H breakdown + failure retest on Nov 20 — classic continuation, not a fakeout. Since then, structure is still bearish (lower highs/lows), and today’s candles are impulsive enough to treat bounces as corrective until proven otherwise.
Key levels: (For Macro Check daily and weekly charts as well.)
• Overhead 1H supply / retest area sits ~6600–6620 (from the Nov 20 breakdown). Price is NOT there yet — we’re ~654x. If we mean-revert into this zone and stall, it’s a high-quality short-reaction area.
• Near-term resistance ~6640–6670 (prior base). Bulls need a reclaim + hold here to even argue structure shift.
• Current lows ~6540s are extension territory — expect bounce attempts, but one green candle doesn’t equal reversal unless we break/hold a 1H lower high.
Bias: bearish under 6600–6620. Watching for either (a) corrective bounce into supply to sell, or (b) true structure reclaim above 6640–6670 to invalidate. #SPX #SP500 #BearFlag #SupplyDemand SP:SPX SP:SPX
US500 retreated on a hawkish Fed shift and a tech-sector fall
September nonfarm payrolls rose by 119k (cons. 51k), but August was sharply revised down to -4k from 22k, while continuing jobless claims increased by 28k from the prior week. The unemployment rate climbed to 4.4% (prev. 4.3%, cons. 4.3%), the highest in four years, further weighing on sentiment.
Fed commentary added to the pressure. Cleveland Fed President Mester noted that, despite signs of labor-market cooling, inflation remains elevated. Chicago Fed President Goolsbee also cautioned that inflation has not yet reached the 2% target, signalling reluctance toward additional rate cuts.
Today’s PMI and consumer expectations data will be key indicators of current US economic conditions.
US500 broke below the lower boundary of the ascending channel, extending its sharp decline. The diverging bearish EMAs indicate a potential continuation of the downtrend.
If US500 breaks below 6500, the index could retreat toward the next support at 6430.
Conversely, if US500 closes above 6650, where EMA21 intersects, the index may advance toward the following resistance at 6700.

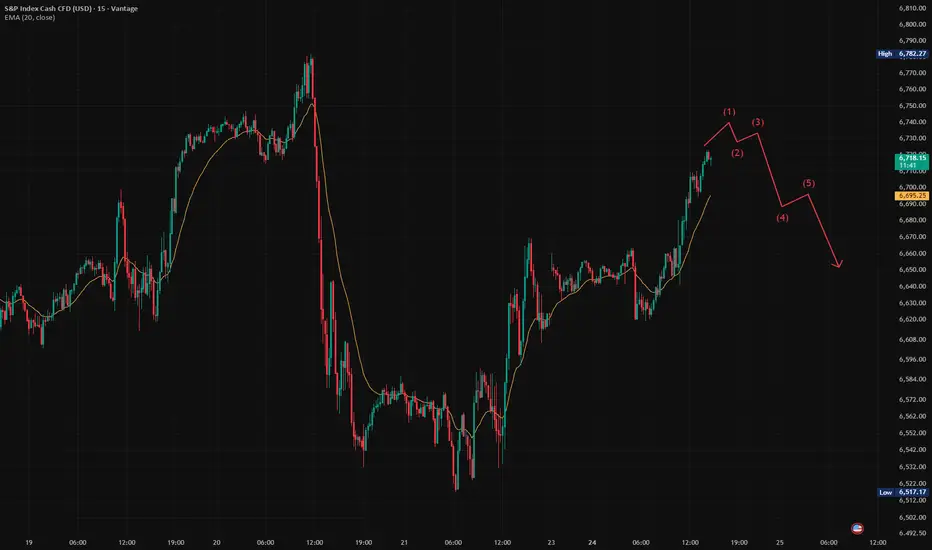
SPX Big Drop Today - H4 DowntrendSPX opened up big today and quickly erased all the gains. It created a lower high (LH) on 61.8 and rejected there for a nice short. Price broke support on H4 signaling weakness, so we pull out fibs to measure where the next possible LH could be. First TP is on the -27% red line, which also lines up with previous daily support. Lets see how price reacts in that area. Feel free to drop opinions!

S&P 500 needs a correctionLooking at the volume, we see that the price is rising but the volume is declining in line with it. This indicates a high probability of a correction, in my view. Short the S&P 500 to 6146, where I expect at least an attempt to form a new bottom. Let the bears do their thing; an update will follow.
⚠️ Not financial advice.


V Pattern On SPX/USD 12hr ChartHey traders and followers ! We have a V pattern on the SPX 12hr chart.
What's next? We go long on a break out of the break Line 6770.3
Target 6856.0 .
Follow your charts not the rumors during this confusing time. Charts never lie people do.
See you in a little while at the starting line as we wait for the break out to prove to us we have a V pattern going on. ;)
