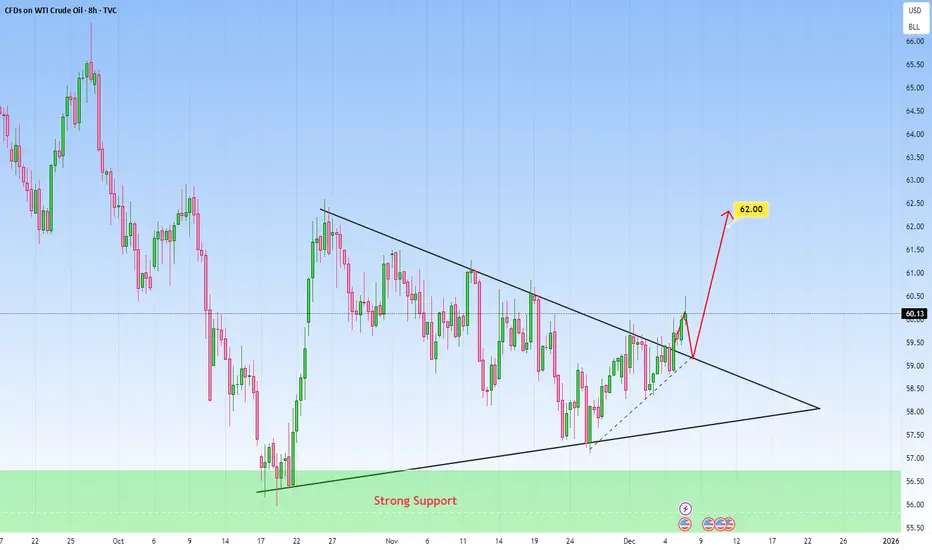
BIG Clue: USOIL Price Compressing Above ResistancePrice is currently compressing, and suggests that a strong impulsive move is likely once price strongly escapes the structure.
See how price has been pressing directly against the upper trendline. This is an area to pay close attention to because repeated tests of this descending resistance can weaken it over time. The recent bullish candles approaching the trendline show growing buying pressure, which increases the probability of an upside continuation.
So for me, a move toward the 62.00 level would be technically well justified and achievable.
The support zone below is a structural base for the entire formation. Price remained above this zone. The failed bearish attempts to push price back into this zone further support the idea that sellers are losing control.
The key confirmation for the bullish scenario is a successful retest of that same trendline as support. If price holds above it and prints continuation strength, a move toward 62.00 becomes the dominant scenario.
But if price instead gets sharply rejected and falls back inside the formation, another rotation toward the lower boundary of the triangle would become likely before any breakout attempt.
This chart is currently in a classic pre-expansion phase. The next impulsive candle will likely define the direction for the next big move.
Trade ideas
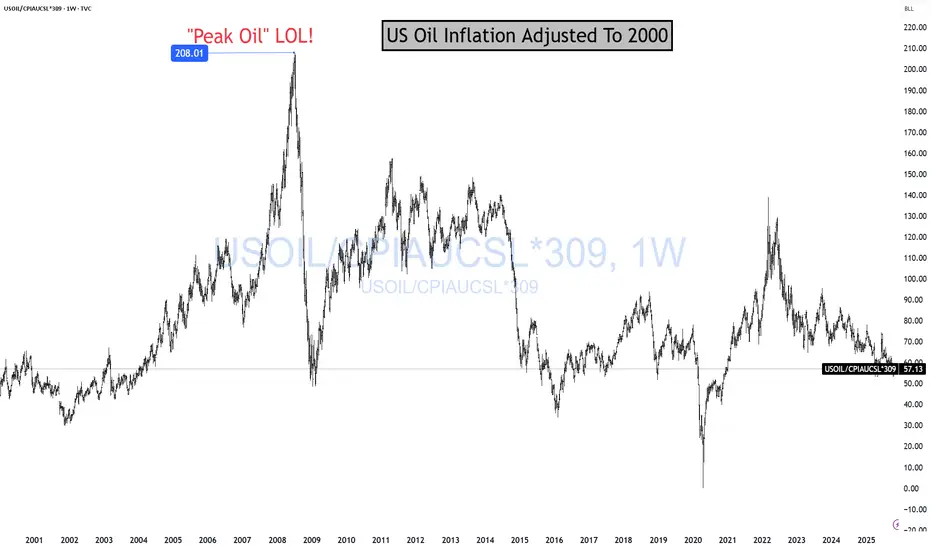
OIL Is Cheap For A ReasonOil is cheap because the global economy sucks! And it is "sucking" more and more every day. That's why Oil is on sale! Cheap! Cheap! And likely going to get more "cheap! cheap!" Me love you long time! Before I continue, story time.
In 2008, I could not convince anyone for the life of me that "PEAK OIL" was a scam! CNBC had T. Boone Pickens on twice a day, telling people we needed 238948735765374 barrels of oil to extract 1 barrel out of the ground.
Today, I can't convince anyone to skip EV, TSLA, AI, Crypto, the money has been made, GTFO. LOL!
As you can see, Oil is a much better long-term investment than all the hyped up trades pushed on to you daily.
Energy stocks make up about 3% of the S&P 500.
The Magnificent Seven circus? Roughly 36% of the entire index. LOL!
What are energy stocks going to do? Go to 1.5% of the SP500? Let it! Buy more!
BTW, you notice how they keep telling you AI will need all this energy? LOL! Wouldn't energy stocks reflect all that demand? LOL! SUCKA!
Anyway! Just look at the chart. If this makes sense to you and it fits your portfolio to BUILD a position long term, let me know in the comments. ;)
I have more on Oil here
THANK YOU for getting me to 5,000 followers! 🙏🔥
Let’s keep climbing.
If you enjoy the work:
👉 Drop a solid comment
Let’s push it to 6,000 and keep building a community grounded in truth, not hype.
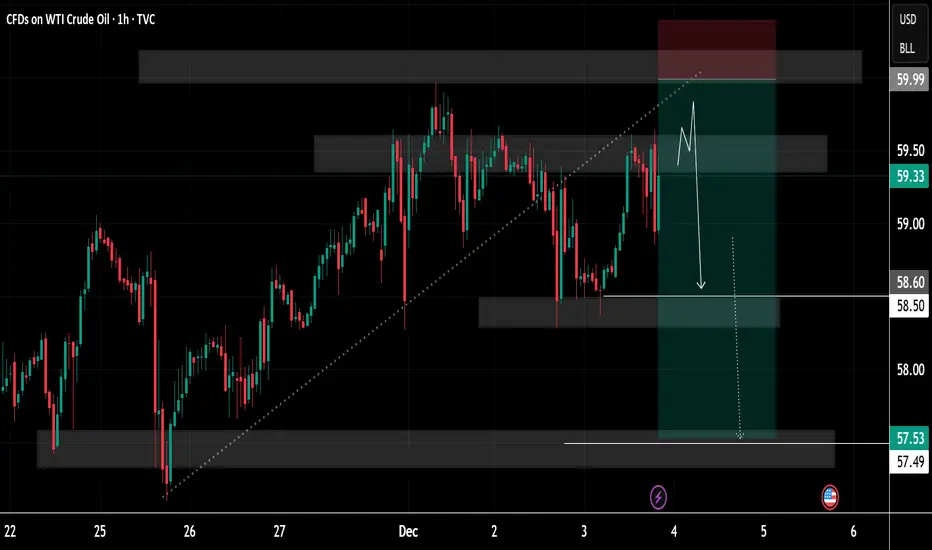
Oil Price Update – Clean & Clear ExplanationOil (1-hour timeframe) analysis focused on a potential sell (short) opportunity. Price is currently trading around 59.40, inside a marked supply zone where previous selling pressure has appeared.
A possible scenario is illustrated:
• Price may push slightly higher into the upper part of the supply zone.
• After that small pullback or retest, the expectation is a downward move.
• The projected sell-off extends toward two key target zones:
Target Points;
1. First target area around 58.50
2. Final target area near 57.50,
Overall, the chart communicates a clean retest-and-drop structure, expecting price to react bearishly from supply and continue downward toward the next major support.
If you find it helpful please and comments for this post and share thanks.
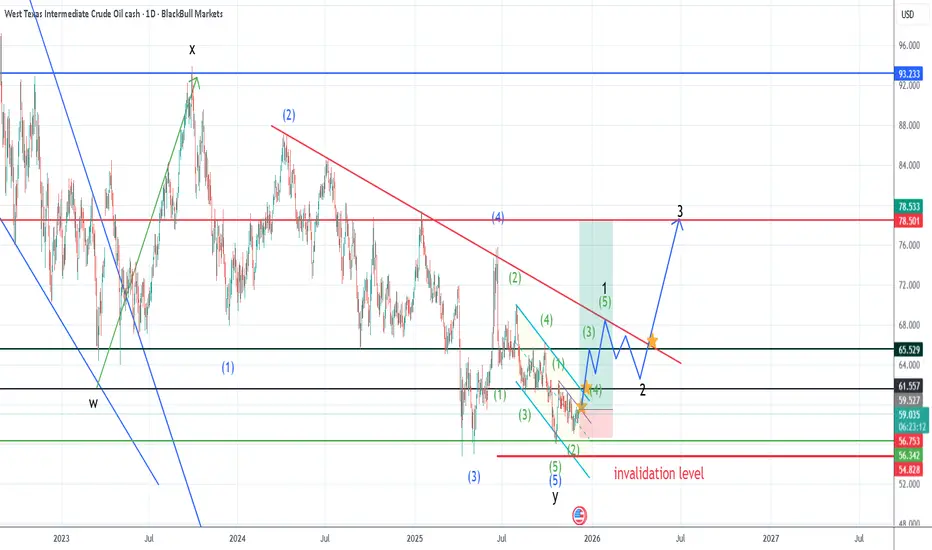
Hellena | Oil (4H): LONG to the area of the maximum of wave “1”.Colleagues, I believe it is necessary to update the forecast slightly. Overall, it remains unchanged, with an upward movement expected.
At the moment, I believe that the higher-order wave “B” has formed, and now in wave ‘C’ I see a five-wave movement “12345”.
I expect wave “3” to begin its movement soon, and I consider the first target to be the maximum area of wave “1” at 60.576.
Manage your capital correctly and competently! Only enter trades based on reliable patterns!

Market Analysis: Oil Price Gains TractionMarket Analysis: Oil Price Gains Traction
Crude oil price is recovering and it could climb further higher toward $62.00.
Important Takeaways for Oil Price Analysis Today
- Crude oil prices are moving higher above the $59.00 resistance zone.
- There is a connecting bullish trend line forming with support at $59.40 on the hourly chart of XTI/USD.
Oil Price Technical Analysis
On the hourly chart of WTI Crude Oil, the price started a decent increase against the US Dollar. The price gained bullish momentum after it settled above $58.20.
The bulls pushed the price above the 50-hour simple moving average, and the RSI climbed toward 70. The price tested the $60.20 zone and is currently consolidating gains. There was a minor pullback below $60.00, and the price tested the 23.6% Fib retracement level of the upward move from the $58.20 swing low to the $60.20 low.
Immediate resistance is near $60.20. If the price climbs further higher, it could face bears near $60.50. The next key area of interest might be $61.20. Any more gains might send the price toward $62.00.
Conversely, the price might correct gains and test $59.40. There is also a connecting bullish trend line forming with support at $59.40 and the 50-hour simple moving average.
The main bid area on the WTI crude oil chart could be $59.00 and the 61.8% Fib retracement. If there is a downside break, the price might decline toward $58.20. Any more losses may perhaps open the doors for a move to $57.20.
This article represents the opinion of the Companies operating under the FXOpen brand only. It is not to be construed as an offer, solicitation, or recommendation with respect to products and services provided by the Companies operating under the FXOpen brand, nor is it to be considered financial advice.

USOIL, Big Money Breaks Defense, Bullish Continuation SetupPrice has officially broken above the Big Money protection zone after multiple strong reactions at the VShark Order Block.
Rising volume confirms real participation, not a false breakout.
This structure shift signals a renewed bullish phase for USOIL.
Buy zones are defined as follows:
🔵 Buy Zone 1
Fibonacci retracement zone of the new bullish leg, optimal area for continuation entries.
🔵 Buy Zone 2
The origin of the current impulse, a deeper accumulation zone if price makes a full pullback.
As long as price holds above the former defense, bullish continuation remains the primary expectation.
VNShark Perspective
We do not chase price after breakout.
We wait where Big Money previously built their positions.

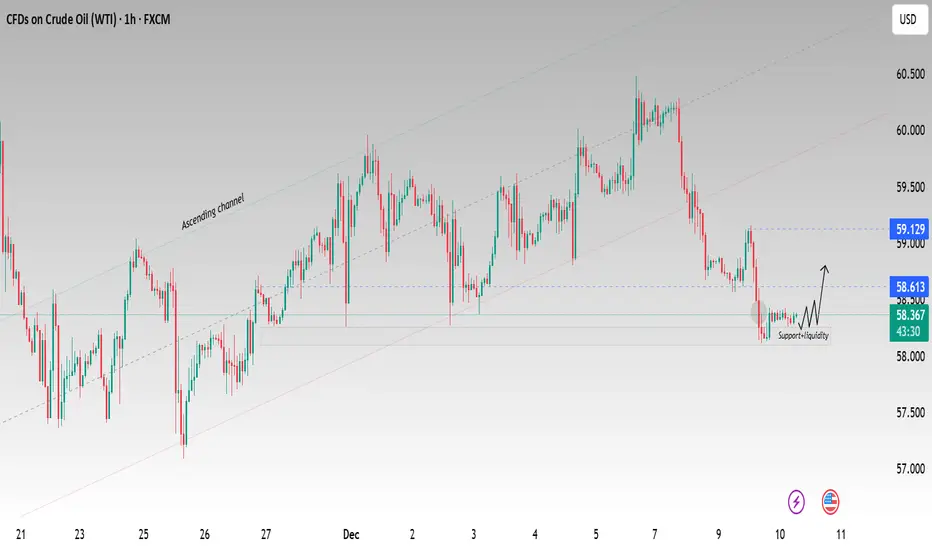
USOIL Bullish strong from key support area 🛢️USOIL Update – Bullish Setup from Key Support Zone 💹
USOIL is showing strong bullish momentum after reacting from the 58,200 support & liquidity zone.
If the momentum continues, here are the technical targets on the 1H timeframe:
🎯 1st Target: 58,600
🎯 2nd Target: 59,200
Always remember:
⚠️ Use proper risk management
📈 Trade wisely and stay disciplined
If you found this analysis helpful:
👍 Like
💬 Comment
🔁 Share
👥 Follow for more updates!

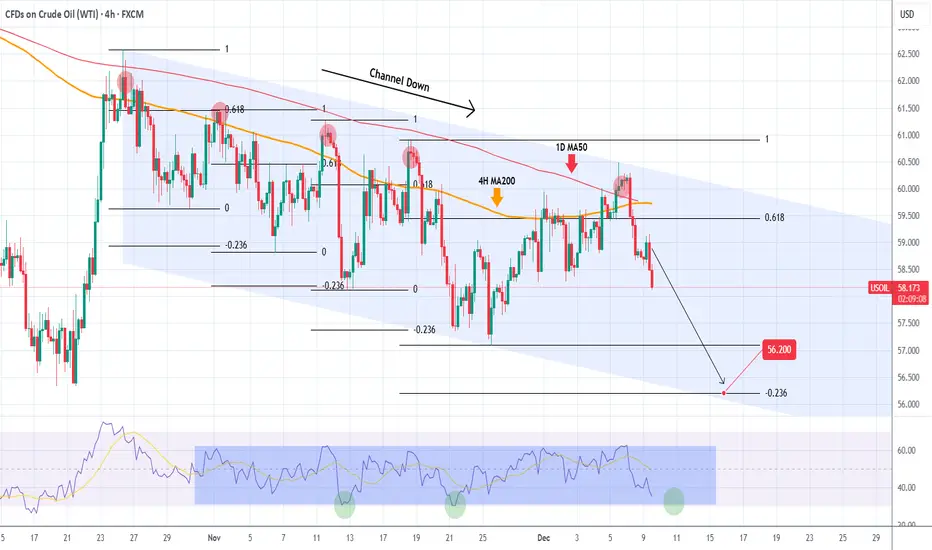
WTI OIL 1.5 month Channel Down started new Bearish Leg.WTI Oil (USOIL) has been trading within a 1.5-month Channel Down (since the October 4 High), that priced last Friday its latest Lower High, this time above the 1D MA50 (red trend-line).
That initiated the new Bearish Leg (also confirmed by the 4H RSI rejection at the top of its range). All 4 previous Bearish Legs bottomed just when the hit the -0.236 Fibonacci extension.
Based on that, we are expecting WTI to make a new Lower Low at 56.200.
---
** Please LIKE 👍, FOLLOW ✅, SHARE 🙌 and COMMENT ✍ if you enjoy this idea! Also share your ideas and charts in the comments section below! This is best way to keep it relevant, support us, keep the content here free and allow the idea to reach as many people as possible. **
---
💸💸💸💸💸💸
👇 👇 👇 👇 👇 👇
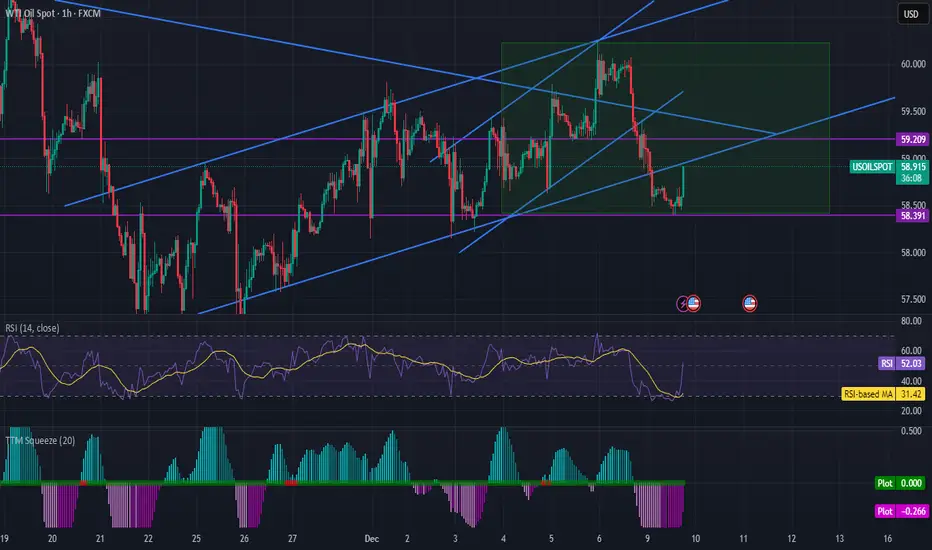
WTI Oil - Price Squeeze
Fundamental backdrop
Global supply continues to outpace demand: new data shows world oil output rising sharply while demand growth remains modest, pushing inventories up toward multi-year highs.
Still, recent geopolitical tensions — including strikes on Russian infrastructure — have kept a risk-premium intact, helping crude avoid a steeper slide.
Technical view
West Texas Intermediate (WTI) is trading around US $59–60/barrel, just above a key support zone near $56.00. The chart shows a wedge-like consolidation, suggesting volatility could erupt soon. Meanwhile, Bollinger Bands are narrowing — a typical “squeeze” that often precedes a breakout (in either direction).
Momentum is flat: the relative strength index (RSI) hovers near 50, and price remains below the 50-day moving average — technically neutral, but prone to sudden moves.
If oil breaks up from the wedge and tops the narrowing Bollinger Bands, a rally toward $62–65 is plausible. But with strong oversupply and soft demand, a breakdown below $56 could trigger a deeper slide — possibly into the mid-$50s.

US Crude Oil (WTI) is moving lower to complete the 5th waveBroke out of the corrective channel formation to the downside. We continue to make lower lows and lower highs, highlighting downward momentum.
The next substantial target/support level is at $57.74.
This would be the completion of a bearish Elliott Wave count (five waves).
Resistance is located at $58.88. The liquidity zone is seen at $59.66 to $59.80
Conclusion: I can see no technical reason for an immediate change in the bearish trend

CRUDE OIL (WTI): Confirmed BoS
I see a confirmed bullish break of a significant daily structure
and a candle close above that on WTI Crude Oil.
With a high probability, the market will continue rising and
reach 60.65 resistance soon.
❤️Please, support my work with like, thank you!❤️
I am part of Trade Nation's Influencer program and receive a monthly fee for using their TradingView charts in my analysis.

USOIL IDEA Demand zone..
Play long
Due to Dxy showing sign of strength and its end of the year already
NOTE: It's an IDEA, Not signal

usoil : live tradeHello friends
Well, according to the channel we had, you can see that the sellers broke the specified support with strength and caused the price to fall.
Now, given that it has become clear to us that the power is in the hands of the sellers, we can re-enter the sell trade if the price rebounds or pullbacks in the specified area, of course with the necessary confirmations...
This analysis is purely technical and does not constitute a buy or sell recommendation, so please observe risk and capital management and avoid emotional movements.
*Trade safely with us*

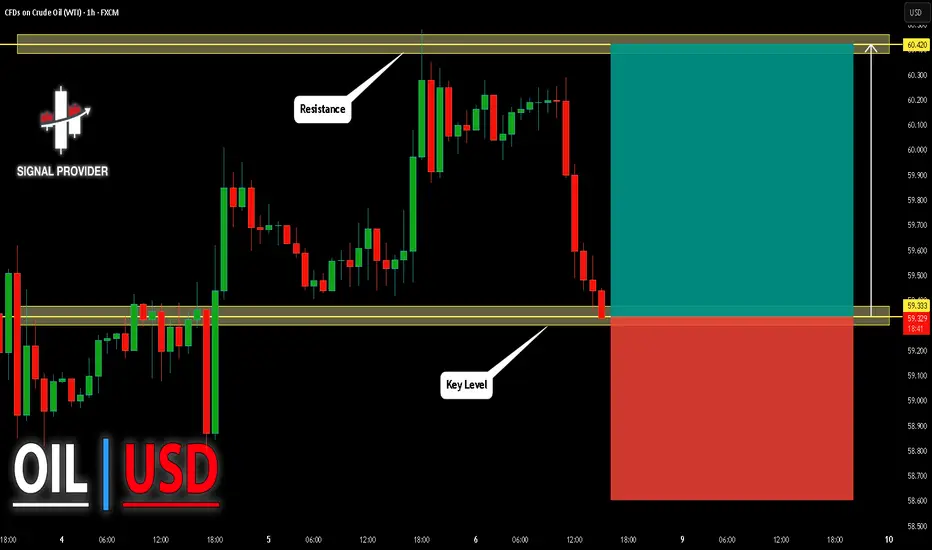
USOIL Will Go Up From Support! Buy!
Here is our detailed technical review for USOIL.
Time Frame: 1h
Current Trend: Bullish
Sentiment: Oversold (based on 7-period RSI)
Forecast: Bullish
The market is approaching a significant support area 59.333.
The underlined horizontal cluster clearly indicates a highly probable bullish movement with target 60.420 level.
P.S
Overbought describes a period of time where there has been a significant and consistent upward move in price over a period of time without much pullback.
Like and subscribe and comment my ideas if you enjoy them!
WTI DEMAND LEVEL BELOW|LONG|
✅WTI OIL is retracing sharply toward a demand zone after drawing sell-side liquidity beneath short-term lows, setting up an ICT-style bullish reaction point. If demand holds, price is poised to rebalance upward into the inefficiency near the target zone. Time Frame 2H.
LONG🚀
✅Like and subscribe to never miss a new idea!✅

US OilCrude Oil
- Double Bottom in Long Time Frame
- RSI - Divergence
- Fair Value Gap
- SSL
- Bearish Channel as an corrective pattern in Short Time Frame

USOIL Will Go Lower! Short!
Here is our detailed technical review for USOIL.
Time Frame: 1h
Current Trend: Bearish
Sentiment: Overbought (based on 7-period RSI)
Forecast: Bearish
The market is trading around a solid horizontal structure 59.542.
The above observations make me that the market will inevitably achieve 58.960 level.
P.S
Please, note that an oversold/overbought condition can last for a long time, and therefore being oversold/overbought doesn't mean a price rally will come soon, or at all.
Like and subscribe and comment my ideas if you enjoy them!

Next UP OIL, i think its time to change direction nowwe are gonna be buying oil again very soon, i dont think it will go much high as it used to be while Trump is in charge but we are likely to see good profit on this,
targets are 65-69 for short term 78 for mid-long term and after that we will see how is everything shaping up.
Broken down instead of going up on breakHorrible PA as it broke down even after there was a break to the upside. There's no real explanation that i can come up with. Other than bears trying or perhaps there is some liquidity due to some speculators waiting for news on Wed/Thurs.
In any case my original targets have to be scrapped. I am looking at this rectange as a range and will have to wait until it breaks this box.
oil M.TOil scenario in the coming days
Over the next three months
Taking into account that the harmon ic pattern will not be broken

WTI Crude bearish below 5980The WTI Crude continues to display a bearish outlook, in line with the prevailing downward trend. Recent price action suggests a corrective pullback, potentially setting up for another move lower if resistance holds.
Key Level: 5980
This zone, previously a consolidation area, now acts as a significant resistance level.
Bearish Scenario (rejection at 5980):
A failed test and rejection at 5980 would likely resume the bearish momentum.
Downside targets include:
5796 – Initial support
5728 – Intermediate support
5667 – Longer-term support level
Bullish Scenario (breakout above 5980):
A confirmed breakout and daily close above 5980 would invalidate the bearish setup.
In that case, potential upside resistance levels are:
6025 – First resistance
6100 – Further upside target
Conclusion
WTI Crude remains under bearish pressure, with the 5980 level acting as a key inflection point. As long as price remains below this level, the bias favours further downside. Traders should watch for price confirmation around that level to assess the next move.
This communication is for informational purposes only and should not be viewed as any form of recommendation as to a particular course of action or as investment advice. It is not intended as an offer or solicitation for the purchase or sale of any financial instrument or as an official confirmation of any transaction. Opinions, estimates and assumptions expressed herein are made as of the date of this communication and are subject to change without notice. This communication has been prepared based upon information, including market prices, data and other information, believed to be reliable; however, Trade Nation does not warrant its completeness or accuracy. All market prices and market data contained in or attached to this communication are indicative and subject to change without notice.

USOIL H1 | Bullish Bounce Off Pullback SupportMomentum: Bullish
The price is falling towards the buy entry which is slightly below the 61.8% Fibonacci retracement which adds a significant strength to this level.
Buy entry: 58.22
Pullback support
Slightly below the 61.8% Fibonacci retracement
Stop loss: 57.75
Pullback support
Aligns with the 78.6% Fibonacci retracement
Take profit: 59.48
Overlap resistance
High Risk Investment Warning
Stratos Markets Limited (tradu.com ), Stratos Europe Ltd (tradu.com ):
CFDs are complex instruments and come with a high risk of losing money rapidly due to leverage. 70% of retail investor accounts lose money when trading CFDs with this provider. You should consider whether you understand how CFDs work and whether you can afford to take the high risk of losing your money.
Stratos Global LLC (tradu.com ): Losses can exceed deposits.
Please be advised that the information presented on TradingView is provided to Tradu (‘Company’, ‘we’) by a third-party provider (‘TFA Global Pte Ltd’). Please be reminded that you are solely responsible for the trading decisions on your account. Any information and/or content is intended entirely for research, educational and informational purposes only and does not constitute investment or consultation advice or investment strategy. The information is not tailored to the investment needs of any specific person and therefore does not involve a consideration of any of the investment objectives, financial situation or needs of any viewer that may receive it. Past performance is not a reliable indicator of future results. Actual results may differ materially from those anticipated in forward-looking or past performance statements. We assume no liability as to the accuracy or completeness of any of the information and/or content provided herein and the Company cannot be held responsible for any omission, mistake nor for any loss or damage including without limitation to any loss of profit which may arise from reliance on any information supplied by TFA Global Pte Ltd.
