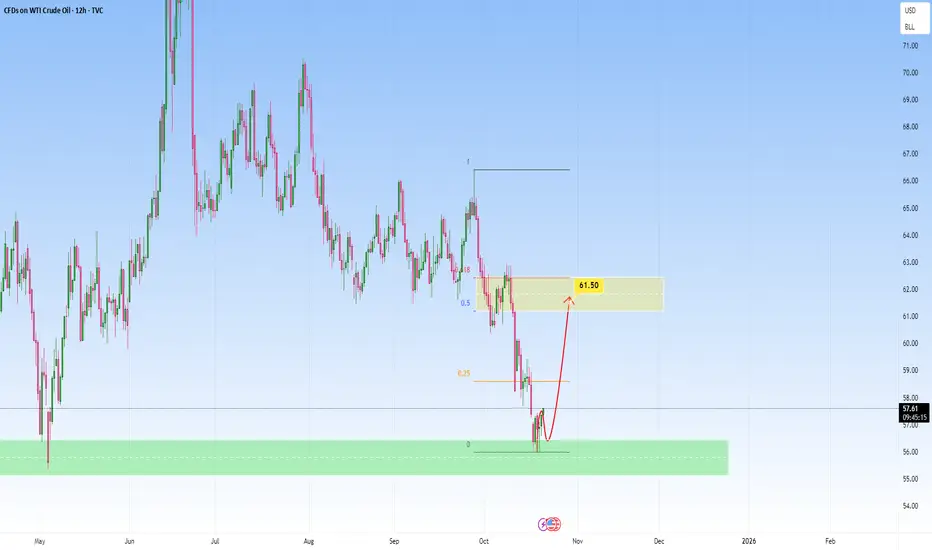
Oil: Key Fibonacci Zone to watch forPrice has been in a clear downtrend, with sellers firmly in control, driving a series of lower lows and lower highs. However, after a strong bearish leg, momentum began to slow, candles started showing long wicks and smaller bodies, signaling that selling pressure might be fading.
If price continues upward, the $61.50 region becomes a crucial zone. A strong rejection from there would confirm that sellers are reloading for another push down.
In short, this is a Fibonacci retracement move within a broader downtrend.
Trade ideas
Hellena | Oil (4H): SHORT to support area of 56-57.Colleagues, price is actively moving in a downward direction and I believe the move is not yet complete.
Earlier I saw this move as a big correction, but now the structure is more of an impulsive one. This means that the price is moving in the wave “3” of the higher order (Red), which should be completed soon.
For this to happen, the price needs to complete the correction in the wave “4” of medium order and then update the low, reaching the support area of 56-57.
The extension of wave “3” is possible - then the price will reach the target without correction.
Fundamental context
Global oil inventories are forecast to rise through 2025, putting downward pressure on prices despite efforts by some producers to restrain output.
OPEC+ has been increasing production again, which adds to the supply burden.
Meanwhile, demand forecasts have been trimmed amid softer economic growth indicators in key consuming regions.
Major banks have lowered long-term price expectations for crude — the balance is tilting toward a more bearish outlook.
Manage your capital correctly and competently! Only enter trades based on reliable patterns!

TLDR: SELL Gold, BUY OilGold/oil ratio seems to be evolving in a band. We've had RSI divergences every time we touched the band predicting trend reversal. RSI Divergence playing out right now as we touch the seemingly relevant support.
- FX_IDC:USDWTI / FRED:WM2NS is at an all time low support level (1998, 2016, 2020)
- TVC:GOLD / FRED:WM2NS at an all time High (1983, oct 2011)
Gold/Oil ratio looks like a Big BUY to me. Enjoy \o/.

19.10.25 Crude Oil WeeklyOil is about to approach the Weekly Demand Zone
Weekly (Higher Time Frame)
The Weekly Demand have 3 basing candle's: the Basing candle are so small it means price have been in balance til the buy pressure came in.
Also you the Demand zone was formed in a previously Supply zone. It means Supply became Demand (flip zone) and can indicate an uptrend.
Daily ( Lower Time Frame)
We are Having An Level on top of Level situation. Both level are covered in from Higher time frame. i will use both levels as my risk zone.
In the moment i reach twice profit of my risk i will move my stoplose to breakeven.
When we reach the first strong Supply i take of 75% of profit and let run the other 25% and trail my stoplose

Oil’s Bottom Is on Its Last Breath — A Major Rally Is ImminentPrevious analysis:
Update is on the chart above 👆
The downside we were hunting looks near completion; in time terms, the correction also appears done.
Wave structure points to the end of wave 2 and the start of a powerful wave 3 up. Failed downside breaks and liquidity sweeps of recent lows back this view.
Confluence: demand retest, deep fib retrace (around 78–88%), and weakening seller momentum at the latest lows.
Roadmap: once this phase completes, I’m looking for an impulse toward $110—with momentum building as price reclaims 65 and then 81.
Risk: even if this setup gets stopped, I’ll keep looking for long entries—trend context and timing still favor upside continuation.
Macro angle: a major oil spike is rarely just a chart pattern—it’s a stress signal. What crisis is this foreshadowing? Middle East? Or something broader and global on supply/demand?
If this resonates, save & follow for the next updates. (Not financial advice.)

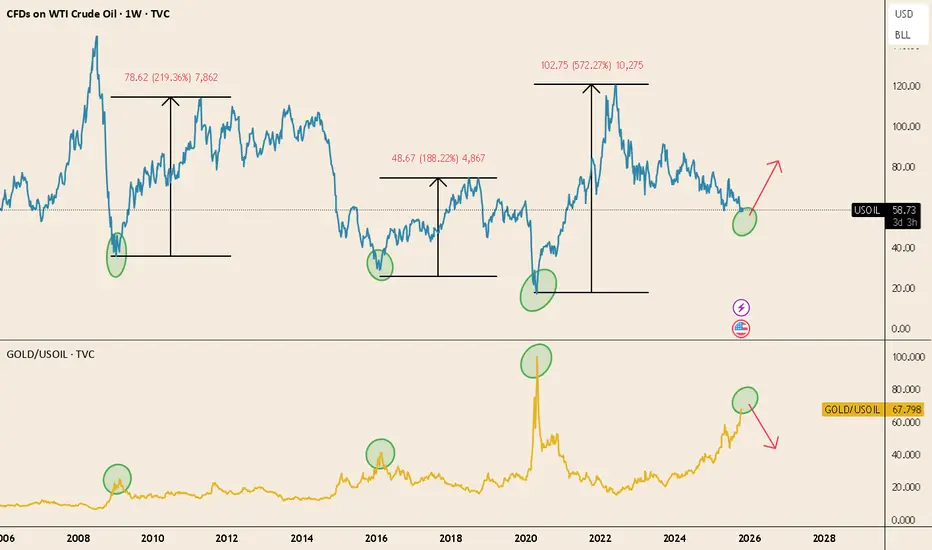
Oil vs Gold: Transition to the Next Commodity CycleThe chart compares WTI crude (top) and the Gold/Oil ratio (bottom) on a weekly basis.
Historically, when the Gold/Oil ratio spikes — meaning gold becomes very expensive relative to oil — it tends to mark the end of the precious metals phase and the beginning of the broader commodity cycle.
In the past three cycles:
-2009 → 2011: Oil +219%
-2016 → 2018: Oil +188%
-2020 → 2022: Oil +572%
We’re seeing the same setup again:
TVC:USOIL sits at long-term support.
Gold/Oil ratio has reached historical extremes.
In each of these cases, gold had already led the move — followed by silver, industrial metals, and finally oil — the last to rally as growth and inflation expectations picked up.
If history rhymes, this could mark the rotation point where energy begins to outperform within the commodity complex.
Hellena | Oil (4H): SHORT to support area of 54.00.As I continued to watch oil I realized that the structure I built in the last forecast is still in place. I think we should expect a correction in wave “4” to the 59.3 area, then a continuation of the downward movement at least to the 54.00 support area. This will be the completion of the downward impulse.
I do not exclude the probability of lengthening of wave “3” and in this case there will be no correction and the price will immediately reach the target.
Fundamental context
The oil market remains under pressure as supply continues to outpace demand, raising the risk of a surplus. Forecasts for 2025-2026 indicate higher production growth while consumption slows.
Rising inventories and a shift in the futures curve into contango suggest growing storage levels and weaker near-term demand.
Under these conditions, downside pressure persists, keeping the probability of a further decline high.
Manage your capital correctly and competently! Only enter trades based on reliable patterns!

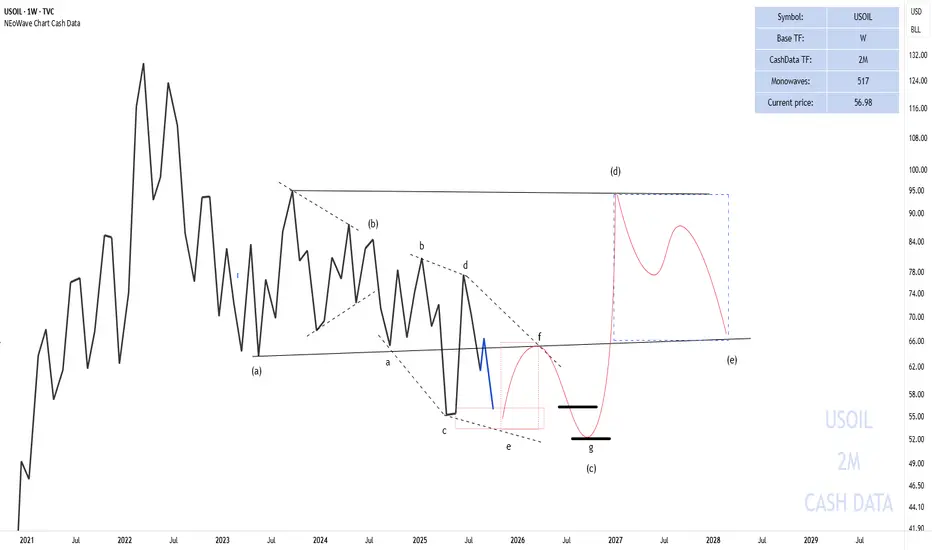
USOIL based on NEoWaveThere has been a lot of demand for oil analysis.
In the 2-month cash data, we see that oil reached $56, and many say there’s a possibility that oil may not touch the high levels above $70 again, but the chart suggests otherwise.
In the 2-month cash data, given the complexity in wave-(c), it appears that a reverse contracting triangle pattern is forming. After the completion of wave-(c), wave-(d) of this triangle could potentially rise to $90.
Currently, we are in wave-(c) of this triangle, which is transforming into a diamond diametric pattern. Wave g of this diametric could end at $56 or in the $50-52 range, completing wave-(c).
The chart will be updated if needed.
Good luck
NEoWave Chart
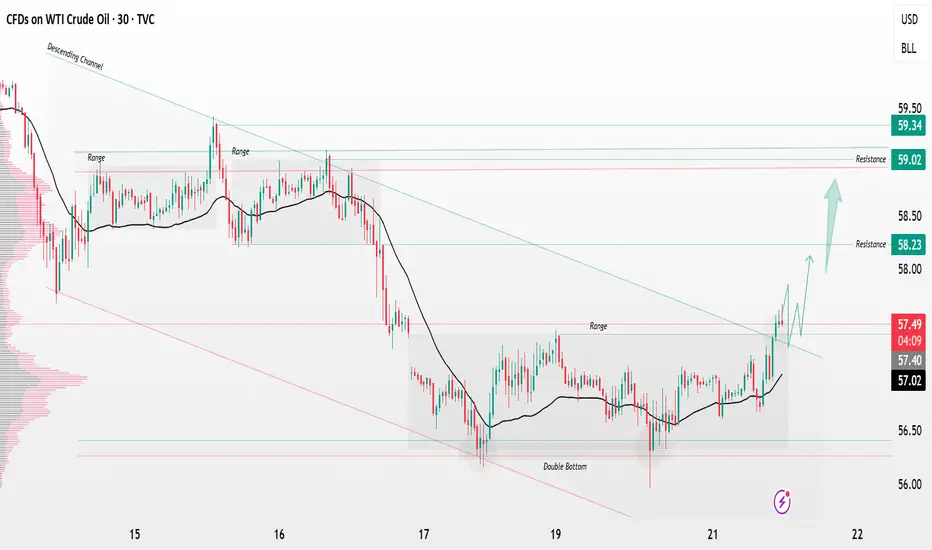
USOIL breakout from consolidation zone big breaking📊 USOIL (WTI Crude Oil) Technical Update 🛢️
USOIL has confirmed a descending channel breakout followed by a range consolidation breakout — showing strong bullish momentum on the 30-minute timeframe. 🔥
📈 Breakout Level: 57.60
🎯 Technical Targets:
1️⃣ First Target – 58.20
2️⃣ Second Target – 59.00
As long as price holds above 57.60, the bullish bias remains intact. ⚡
#USOIL #WTI #CrudeOil #PriceAction #TechnicalAnalysis #BreakoutTrading
USOIL Is Bearish! Short!
Take a look at our analysis for USOIL.
Time Frame: 4h
Current Trend: Bearish
Sentiment: Overbought (based on 7-period RSI)
Forecast: Bearish
The market is approaching a key horizontal level 57.145.
Considering the today's price action, probabilities will be high to see a movement to 55.504.
P.S
The term oversold refers to a condition where an asset has traded lower in price and has the potential for a price bounce.
Overbought refers to market scenarios where the instrument is traded considerably higher than its fair value. Overvaluation is caused by market sentiments when there is positive news.
Like and subscribe and comment my ideas if you enjoy them!

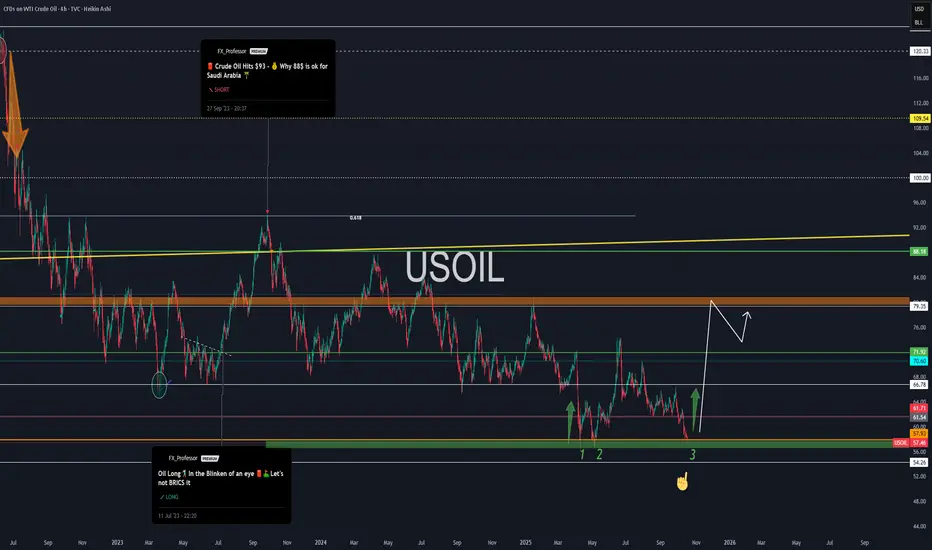
Time to Fill Up Those Tanks — WTI Reversal in PlayTime to Fill Up Those Tanks — USOIL Reversal in Play 🛢️📈
Everyone’s watching tech, AI, Bitcoin, and gold.
But let’s be real: none of that moves without oil.
We all need black energy — whether you call it crude, petroleum, or the global bloodstream of industry. And today, we’re looking at a setup that says:
“It might be time to fill those tanks — literally and financially.”
🔄 From Short to Long — Here's Why
🧠 Back in Sept 2023, I was publicly SHORT from $93 — “Why 88 is OK for Saudi Arabia” . Clean fade.
But now? We’ve hit my 3-touch support zone at ~$57 — and the structure screams reversal.
📌 1… 2… and now 3.
• Triple bottom territory
• RSI divergence
• Crude sentiment at peak despair
• Geopolitical fog + supply cut whispers
This is the part of the cycle where crude likes to rip when nobody’s looking.
🔍 Technical Breakdown
• 🟩 Demand base: $56–57 zone (strong 3-touch support)**
• 🎯 Target: $79.35 (next major resistance zone)**
• 🛑 Invalidation below $54.26 = abort the trade idea
If the reversal starts here, I expect a rally into Q1 2026 — possibly exaggerated by global supply dynamics.
🌍 Macro Lens
• OPEC still tight
• U.S. SPR not refilled
• Geopolitics = foggy at best
• Seasonal energy demand rising
• Biden vs Trump = policy shake-up incoming
Forget narratives — crude is telling its own story.
💡 Thought of the Day 💡
Everything we build, move, ship, and mine — starts with oil.
It’s not going away. It’s just waiting to be priced correctly again.
You may love AI, but it still runs on diesel in the real world.
One Love,
The FXPROFESSOR 💙
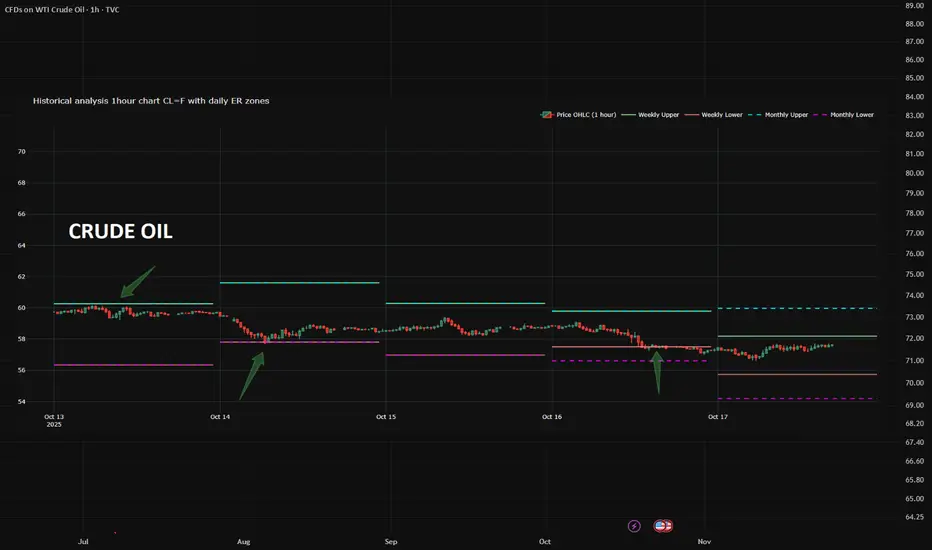
ER: The Hidden Tool 95% of Traders Ignore (But Shouldn’t)What if I told you there’s a free, stats-backed tool that shows you where price is likely to stop or reverse — with 68% confidence?
Meet Expected Range (ER) — not a magic bullet, but a massive edge when used right.
✅ Based on CME data & Nobel-winning math
✅ Defines high-probability support/resistance zones
✅ Free from CME website.
I never trade without checking ER anymore.
It turns noise into structure.
👉 Check the screenshots yourself — see how price reacted at each edge last week.
The only thing you need to do?
→ Grab ER data from the CME website daily
→ Apply a simple conversion formula
→ Plot it on your futures chart
That’s it.
Now you’ve got statistically grounded levels right in front of you.
Depending on your market view, you can:
• Short from the upper ER boundary
• Use it as a trend support entry zone
• Hide stops beyond the range — because price statistically won’t reach them
⚠️ Caveat: ER isn’t a crystal ball.
But in normal markets - ER zones hold ~4 out of 5 times.
Question for you:
Are you using ER? Or still guessing support/resistance?
Transparency first. No hype. Just real results.
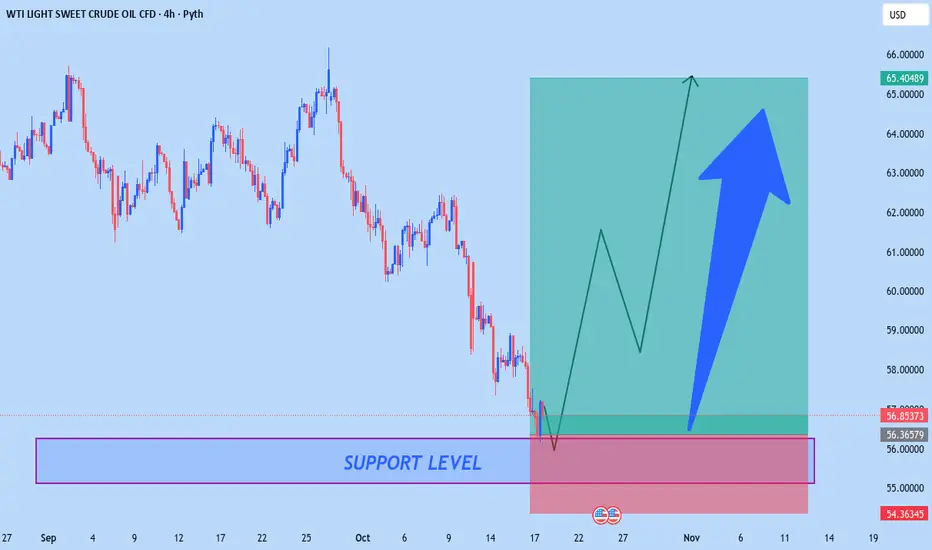
USOIL NEW OUTLOOK According to H4 analysis USOIL market is in falling pressure from last couple day now market at SUPPORT LEVEL this is the best chance for buyer to go long from SUPPORT LEVEL so if you are interested then go long
TRADE AT YOUR OWN RISK
REGARD ALBERT
XTI/USD Chart Analysis: Oil Prices Fall to Yearly LowsXTI/USD Chart Analysis: Oil Prices Fall to Yearly Lows
As shown on the XTI/USD chart, WTI crude is trading below $57 today, with the 2025 low sitting near $55. Several factors are currently weighing on oil prices:
→ Uncertainty surrounding the US-China trade deal — the world’s two largest oil consumers — continues to cloud the outlook for global growth and crude demand.
→ Increased output from OPEC+ members has added further pressure, with the IEA last week raising its forecast for a global oil surplus.
→ A decline in the risk premium following the peace agreement in the Middle East has also reduced support for oil prices.
So, what could happen next?
Technical Analysis of the XTI/USD Chart
Seven days ago, we noted that:
→ In the long-term context, oil price fluctuations — following the June escalation in the Middle East — have formed a downward channel (shown in red). The current price has now slipped below its lower boundary.
→ In the short term, the pace of the decline appears to be accelerating, highlighted by the purple trajectory lines.
At that time, we suggested a scenario in which WTI could drift towards its yearly low near $55, which is now materialising. However, note the following:
→ The RSI indicator is hovering near oversold territory.
→ The chart shows signs of a Falling Wedge pattern, which often precedes a bullish reversal.
Given these signals, it is reasonable to assume that, after a roughly 10% decline since the start of the month, bears may begin locking in profits on short positions. This could trigger a technical rebound in WTI prices — potentially towards the resistance area defined by:
→ The lower boundary of the red channel;
→ The psychological level of $60;
→ The median line of the purple channel.
This article represents the opinion of the Companies operating under the FXOpen brand only. It is not to be construed as an offer, solicitation, or recommendation with respect to products and services provided by the Companies operating under the FXOpen brand, nor is it to be considered financial advice.

Copper and Oil: A Rare Divergence in the Commodity ComplexThe chart compares Copper (brown) and TVC:USOIL (blue) — two of the most cyclical commodities, both highly sensitive to global growth.
Historically, they tend to move in tandem: when economic momentum improves, both rise; when demand weakens, both fall.
But today we see an unusual divergence —
-Copper holding near multi-year highs, supported by structural deficits and energy transition demand.
-Oil trading below $60, its lowest since 2021, signaling cyclical slowdown and weak liquidity.
This gap rarely lasts long. Either copper is too optimistic, or oil is too pessimistic — one of them is likely “lying.”
Which one will be right this time?

CRUDE OIL (WTI): The Price Will Drop Lower!
Crude Oil is going to reach the year's low soon.
A confirmed bearish break of a minor structure on a daily time frame
suggest a strong selling pressure.
Be ready to see a test of 55.6 soon.
❤️Please, support my work with like, thank you!❤️

USOIL (WTI Crude Oil) – Bullish Reversal Setup | 4H AnalysisMarket Context
WTI Crude Oil has been in a strong downtrend over the past few weeks, breaking multiple support levels.
However, price has now reached a key higher-timeframe demand zone (55.80–57.00), which previously acted as a strong reaction area in the past.
The recent 4H candles show clear rejection wicks and slowing bearish momentum — signaling that sellers may be losing control.
Technical Breakdown
Structure: The downtrend may be completing its final leg, forming a potential double-bottom or accumulation phase.
Demand Zone: The area between 55.80–57.00 is aligning with previous volume imbalance and untested demand.
Liquidity Sweep: Price grabbed liquidity below prior lows and quickly bounced back — a classic smart money reversal sign.
💡 Trade Plan
Entry Zone: 56.80 – 57.20 (after confirmation or retest)
Stop-Loss: Below 55.80 (structure break / demand invalidation)
Take-Profit Targets:
🎯 TP1: 61.00 (first resistance / supply area)
🎯 TP2: 64.70 (major 4H resistance & potential reversal completion point)
🧭 Bias & Outlook
Bullish, as long as price holds above 55.80 and continues forming higher lows.
A break below this level would invalidate the setup and signal continuation of the broader bearish trend.
🧠 Summary :
Oil has reached an oversold demand region, showing signs of accumulation and liquidity sweep.
Early confirmation of buyers stepping in could trigger a strong corrective move toward 61.00–64.70.
This is a medium-term swing setup with solid risk-to-reward potential.

USOIL Near Final Leg USOIL is forming a clear corrective pattern inside a falling channel. Price is currently in the final leg of wave (5) of (C), suggesting one more dip is likely before reversal.
The downside target lies near 5,000–5,200 , where support from the channel base aligns. Once this level holds, a strong bullish reversal is expected, marking the end of the correction and the start of a new upward trend.
Stay Tuned!
@Money_Dictators :)

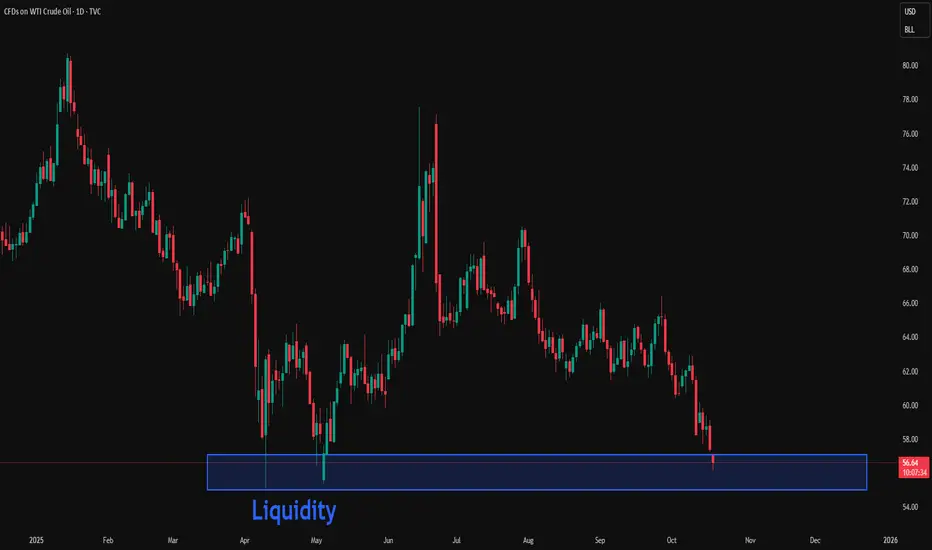
USOIL: Waiting for a liquidity sweep on the Daily timeframeIn my previous analyses on USOIL, including the fundamental outlook, price has been trending lower within a narrow channel between $70 and $50.
I’m looking for a buy opportunity on higher timeframes after a large liquidity sweep.
Weekly Outlook:
* Trend: assessed using at least three trend indicators, with market structure as the primary guide.
** Weak or Reversal Signals: Assessed based on one of our criteria for trend reversal signals.
*** Support/Resistance: Selected from multiple factors – static (Swing High, Swing Low, etc.), dynamic (EMA, MA, etc.), psychological (Fibonacci, RSI, etc.) – and determined based on the trader’s discretion.
**** Our advice takes into account all factors, including both fundamental and technical analysis. It is not intended as a profit target. We hope it can serve as a reference to help you trade more effectively. This advice is for informational purposes only and we assume no responsibility for any trading results based on it.
George Vann @ ZuperView
USOIL : Full analysisHello friends
Well, considering the sharp decline we had, the price has entered a descending channel and is slowly going down in this channel.
Now the price has reached a critical point, namely the bottom of the channel.
We need to see if buyers will support the price at the bottom of the channel like the previous two times or not?
If we do not see support from buyers and the channel is broken, we can expect lower prices.
56.30 and 53 dollars respectively.
But we will most likely see buyers' support in this area and the price could even reach the channel ceiling.
*Trade safely with us*

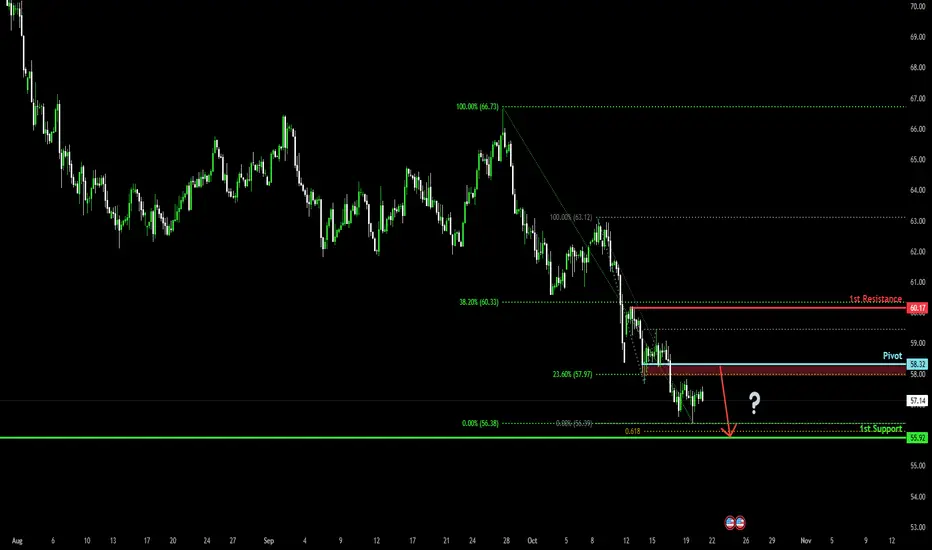
Bearish continuation setup?WTI Oil (XTI/USD) is rising towards the pivot and could drop to the 1st support.
Pivot: 58.32
1st Support: 55.92
1st Resistance: 60.17
Disclaimer:
The above opinions given constitute general market commentary, and do not constitute the opinion or advice of IC Markets or any form of personal or investment advice.
Any opinions, news, research, analyses, prices, other information, or links to third-party sites contained on this website are provided on an "as-is" basis, are intended only to be informative, is not an advice nor a recommendation, nor research, or a record of our trading prices, or an offer of, or solicitation for a transaction in any financial instrument and thus should not be treated as such. The information provided does not involve any specific investment objectives, financial situation and needs of any specific person who may receive it. Please be aware, that past performance is not a reliable indicator of future performance and/or results. Past Performance or Forward-looking scenarios based upon the reasonable beliefs of the third-party provider are not a guarantee of future performance. Actual results may differ materially from those anticipated in forward-looking or past performance statements. IC Markets makes no representation or warranty and assumes no liability as to the accuracy or completeness of the information provided, nor any loss arising from any investment based on a recommendation, forecast or any information supplied by any third-party.
USOIL: Pullback within the correction on the 4h timeframeTo better understand my current outlook on USOIL, please refer to my previous higher-timeframe and fundamental analyses:
* Trend: assessed using at least three trend indicators, with market structure as the primary guide.
** Weak or Reversal Signals: Assessed based on one of our criteria for trend reversal signals.
*** Support/Resistance: Selected from multiple factors – static (Swing High, Swing Low, etc.), dynamic (EMA, MA, etc.), psychological (Fibonacci, RSI, etc.) – and determined based on the trader’s discretion.
**** Our advice takes into account all factors, including both fundamental and technical analysis. It is not intended as a profit target. We hope it can serve as a reference to help you trade more effectively. This advice is for informational purposes only and we assume no responsibility for any trading results based on it.
George Vann @ ZuperView
Crude Oil Approaches End of Elliott Wave PatternAbove, is the video review for Crude Oil.
Taking a look at the longer perspective, a multi-year ending diagonal pattern is nearing its end.
The weekly chart for TVC:USOIL suggests the decline is wave 5 of a 5-wave diagonal. The 61% Fibonacci retracement level sits near $49. We're anticipating a bullish reversal between current prices and $49 to carry up to new all-time highs over the coming years.
Looking at a clusters of wave relationships and market geometry, I'd like to see Crude Oil reach the yellow box and punch new lows, but it doesn't have to.
If prices fall further, then the 61% Fib level at $49 may provide support.
