AUD/USD Short Setup — Clean Break Below 0.6520 Targeting 0.6490Here’s my clean short setup on AUD/USD, supported by 4H and 15M confluence.
Market Structure:
Price has been forming consistent lower highs under 0.6555, showing clear bearish momentum. The 0.6520 zone has acted as a major intraday support — now flipped resistance after a clean break. DXY strength and overall risk-off sentiment further support downside bias.
Trade Plan:
Entry Zone: 0.6515 – 0.6510 (confirmed rejection of 0.6520 retest)
Stop Loss: 0.6548 (above previous swing high)
Take Profit 1: 0.6490
Take Profit 2: 0.6470 (extended move)
Risk:Reward: ~1 : 2.5
Technical Confluence:
4H structure remains bearish below 0.6555
Lower timeframe momentum fading near resistance
DXY trending up intraday — favors continued USD strength
EMA alignment bearish; RSI showing divergence at highs
Invalidation:
Setup invalidated if price closes above 0.6555 with strong volume — that would shift control back to buyers.
Trade Management:
Once TP1 is hit, move SL to break-even and trail for a potential continuation.
📉 Bearish bias maintained while under 0.6555.
Trade ideas

AUD/USD Short Setup — Clean Break Below 0.6520 Targeting 0.6490Here’s my short setup on AUD/USD (2H/15M confluence).
Price has been forming lower highs and showing fading bullish momentum. The 0.6520 level has been tested multiple times — I’m waiting for a confirmed break below that area before entering short.
Entry: 0.6515–0.6510
Stop-loss: 0.6548 (above previous swing high)
Take-profit: 0.6490 (first target) / 0.6470 (extended)
Risk-Reward: ≈ 1:2.5
Reasoning:
– Bearish structure remains intact below 0.6555
– Momentum slowing on the 2H with rejection wicks near 0.6540
– DXY showing minor strength intraday, favoring USD continuation
I’ll invalidate the setup if AUD/USD closes above 0.6555 with volume.
This idea is for educational and analysis purposes only.

USD Steady, AUD/USD Eyes 0.6420 — ADP in FocusThe dollar holds firm as traders scale back Fed rate-cut bets ahead of the ADP report. AUD/USD grinds lower within its descending channel, testing key support near 0.6420. Can the Aussie hold the line?

AUDUSD at prior support1h close below = continuation lower. Reclaim and hold above = fakeout and bounce.
Invalidation: clean 1h close back above the zone. Not financial advice.

AUDUSD Potential DownsidesHey Traders, in today's trading session we are monitoring AUDUSD for a selling opportunity around 0.65300 zone, AUDUSD is trading in a downtrend and currently is in a correction phase in which it is approaching the trend at 0.65300 support and resistance area.
Trade safe, Joe.

AUDUSD Breakout and Potential Retrace!Hey Traders, in today's trading session we are monitoring AUDUSD for a selling opportunity around 0.65800 zone, AUDUSD was trading in an uptrend and currently is in a correction phase in which it is approaching the retrace area at 0.65800 support and resistance area.
Trade safe, Joe.

AUDUSD BUYAUD/USD is currently moving down to seek liquidity near the lower boundary of the ascending channel, after rejecting the mid-channel zone.
I’ll be looking for buy opportunities around the 0.6470 area, expecting a potential rebound toward the upper side of the channel.
Technical Outlook:
The pair remains within a well-defined ascending channel, maintaining a short-term bullish market structure.
A liquidity sweep or stop-hunt near 0.6470 could provide an ideal entry zone for a long setup.
A bullish reaction (rejection wick, break of structure, or bullish divergence) from that area would confirm buyers stepping in again.
Fundamental Context:
The Australian dollar is supported by improved risk sentiment and stabilization in commodity prices (especially iron ore and copper).
The U.S. dollar has recently eased as Treasury yields pulled back, which can give AUD/USD room to recover.
Additionally, markets are anticipating that the Reserve Bank of Australia (RBA) will remain relatively firm on policy compared to other central banks, providing further support for the Aussie.
Summary:
Waiting for a possible liquidity grab near 0.6470 to position long, targeting a move back to the upper boundary of the ascending channel.
Bias remains bullish as long as price holds above the lower channel support.

AUDUSD Will Go Up! Buy!
Please, check our technical outlook for AUDUSD.
Time Frame: 3h
Current Trend: Bullish
Sentiment: Oversold (based on 7-period RSI)
Forecast: Bullish
The market is approaching a significant support area 0.650.
The underlined horizontal cluster clearly indicates a highly probable bullish movement with target 0.654 level.
P.S
Please, note that an oversold/overbought condition can last for a long time, and therefore being oversold/overbought doesn't mean a price rally will come soon, or at all.
Like and subscribe and comment my ideas if you enjoy them!

AUDUSD will up?The price already in support region. High potential to finish the bear for a while to touch nearest resistant before continue another pattern.

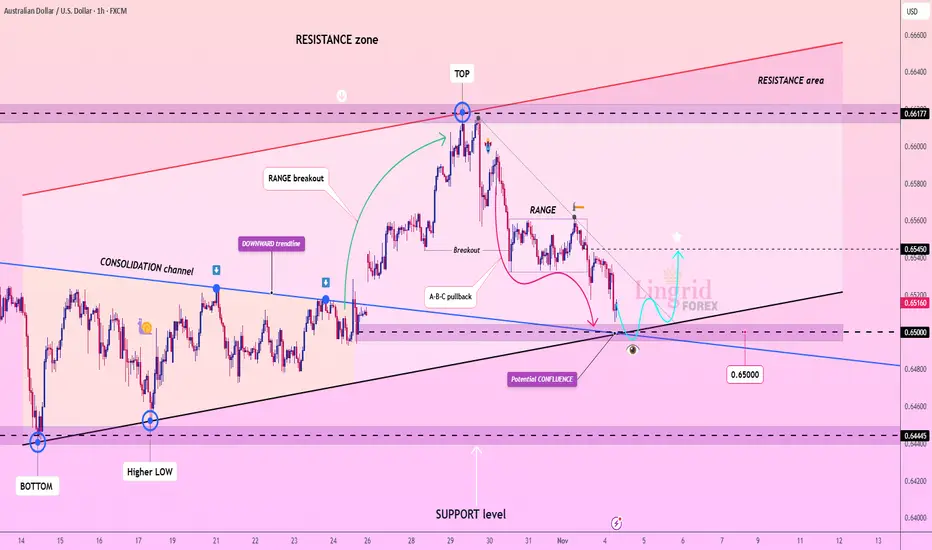
Lingrid | AUDUSD Psychological Support Long OpportunityThe price perfectly fulfilled my previous idea . FX:AUDUSD is testing the confluence support near 0.6500 after retracing from the 0.6617 resistance zone. Price action forms an A-B-C pullback pattern within a consolidation channel, suggesting the potential for a short-term rebound. Holding above 0.6500 could attract buyers aiming for 0.6545 resistance. Broader momentum supports a mild bullish recovery as long as this level remains intact.
⚠️ Risks:
Unexpected hawkish tone from the Federal Reserve could strengthen USD and cap recovery.
Weak Australian trade or employment data may renew downside pressure.
A sharp drop in commodity prices could undermine AUD sentiment.
If this idea resonates with you or you have your own opinion, traders, hit the comments. I’m excited to read your thoughts!
Global Market Analysis: 1. Introduction to the Global Market
The global market is an integrated system where goods, services, capital, and labor move freely across borders. This system connects developed, emerging, and developing economies through trade, investment, and financial flows. The rise of globalization, technological advancements, and digital platforms has accelerated this integration, making economic activities more interdependent than ever before.
In today’s context, no economy operates in isolation. Events in one country—like a policy change in the U.S. Federal Reserve, geopolitical tensions in the Middle East, or a supply chain disruption in China—can ripple through global financial markets, influencing exchange rates, stock prices, and commodity values worldwide.
2. Key Components of Global Market Analysis
To understand global markets, analysts focus on several major components:
a. Economic Indicators
Economic indicators provide quantitative data to assess the health and direction of economies. Important metrics include:
GDP growth rate: Measures overall economic performance.
Inflation rate: Indicates changes in purchasing power.
Employment/unemployment rates: Reflect labor market conditions.
Trade balance: Shows exports versus imports.
Interest rates: Affect borrowing costs and capital flows.
These indicators help compare economic strengths across regions and anticipate future market movements.
b. Currency and Forex Markets
Currency markets play a vital role in global trade. Exchange rate movements influence import-export competitiveness, multinational earnings, and inflation. For instance, a stronger U.S. dollar often weakens emerging-market currencies, impacting their trade balances and foreign debt servicing.
c. Global Stock Markets
Equity markets reflect investor sentiment toward corporate profitability and economic growth. Major indices such as the S&P 500 (U.S.), FTSE 100 (U.K.), Nikkei 225 (Japan), and Nifty 50 (India) provide insights into global equity performance. Global investors diversify across markets to hedge risks and capture growth opportunities in different regions.
d. Commodity Markets
Commodities—like oil, gold, copper, and agricultural products—are essential to global trade. Commodity prices are influenced by supply-demand dynamics, geopolitical tensions, weather patterns, and currency fluctuations. For example, rising oil prices often lead to inflationary pressures worldwide, affecting consumer spending and industrial production.
e. Global Bond Markets
The bond market reflects government and corporate borrowing trends. It plays a key role in determining interest rate movements and investor confidence. U.S. Treasury yields, for example, are closely monitored as a global benchmark for risk-free returns.
3. Regional Market Insights
Global market analysis often breaks down by region to understand varying growth patterns:
a. North America
The U.S. dominates global finance, technology, and innovation. Its economic data and Federal Reserve policies have worldwide implications. Canada and Mexico, integrated through the USMCA, also play vital roles in trade and manufacturing.
b. Europe
The European Union forms one of the world’s largest single markets. However, it faces challenges like energy dependency, aging demographics, and political divisions. The European Central Bank’s policies significantly influence global liquidity and currency markets.
c. Asia-Pacific
Asia drives global growth, led by China and India. China remains a manufacturing powerhouse, while India’s expanding services and digital economy are attracting global investors. Japan, South Korea, and Southeast Asian nations contribute through technology and trade integration.
d. Middle East and Africa
This region is rich in natural resources, particularly oil and gas. The Middle East’s economic diversification efforts, like Saudi Arabia’s Vision 2030, and Africa’s emerging consumer markets are reshaping the investment landscape.
e. Latin America
Latin America presents opportunities in commodities, agriculture, and renewable energy, though political instability and inflation risks often deter investors.
4. Major Drivers of Global Market Trends
a. Globalization and Trade Liberalization
Globalization encourages free movement of goods and services, promoting efficiency and innovation. Trade agreements like RCEP, USMCA, and EU single market policies have strengthened cross-border trade links.
b. Technological Advancements
Technology has transformed global markets through automation, AI, blockchain, and fintech. E-commerce and digital payments have expanded international trade access, while data-driven decision-making enhances market analysis precision.
c. Monetary Policies
Central banks worldwide—especially the U.S. Federal Reserve, ECB, and Bank of Japan—play a crucial role in determining liquidity and interest rates. Rate hikes or cuts can trigger capital flows between developed and emerging markets.
d. Geopolitical Factors
Wars, trade disputes, and political instability disrupt global supply chains and affect investor sentiment. For example, tensions in the South China Sea or sanctions on Russia can alter energy and commodity prices globally.
e. Climate and Sustainability
Sustainability and ESG (Environmental, Social, Governance) investing are now integral to global market analysis. Investors prefer green bonds and climate-friendly projects, reshaping capital allocation.
5. Emerging Global Market Trends
a. Digital Finance and Cryptocurrencies
Blockchain technology and cryptocurrencies like Bitcoin and Ethereum are reshaping financial systems. Central banks are exploring digital currencies (CBDCs) to modernize payment infrastructure.
b. Shift in Global Supply Chains
Post-pandemic disruptions have pushed companies to diversify manufacturing bases from China to countries like India, Vietnam, and Mexico—creating new trade corridors.
c. Green Energy Transition
The global shift from fossil fuels to renewable energy is transforming investment patterns. Solar, wind, and hydrogen industries are attracting long-term capital flows.
d. Rising Role of Emerging Markets
Emerging economies are projected to drive most of the world’s GDP growth over the next decade, with growing middle classes and rapid urbanization fueling demand.
6. Tools and Methods of Global Market Analysis
Analysts use a mix of quantitative and qualitative methods, including:
Fundamental Analysis: Evaluating economic data, interest rates, and corporate earnings.
Technical Analysis: Studying price charts, trends, and volume patterns.
Sentiment Analysis: Gauging investor mood via surveys, news flow, or social media.
Comparative Studies: Cross-country analysis of fiscal and monetary policies.
Software tools such as Bloomberg Terminal, Reuters Eikon, and TradingView help analysts interpret live data and identify trading opportunities.
7. Risks and Challenges
Despite growth potential, global markets face several challenges:
Inflation and interest rate volatility reducing liquidity.
Geopolitical conflicts leading to uncertainty and trade restrictions.
Currency fluctuations affecting multinational profits.
Climate change risks impacting agriculture and infrastructure.
Technological disruptions threatening traditional industries.
Effective risk management—through diversification, hedging, and adaptive strategies—is essential for global investors.
8. Conclusion
Global market analysis is not merely about tracking numbers—it’s about understanding how economies interact in an interconnected ecosystem. From macroeconomic indicators to micro-level trade patterns, it provides insights into where opportunities lie and what risks to anticipate.
In a world shaped by technological evolution, geopolitical shifts, and environmental priorities, staying informed through thorough market analysis is crucial for policymakers, corporations, and investors alike. Those who can interpret global trends with precision and agility will remain best positioned to succeed in the dynamic landscape of the 21st-century global economy.
Buy AUD/USD 0.6519 — Fibo Confluence Setup, Uptrend ContinuationBuy AUD/USD 0.6519 — Fibo Confluence Setup, Uptrend Continuation.
Condition 1: The setup aligns with the uptrend; price still has room to continue moving higher, confirming trend continuation.
Condition 2: Draw a Fibonacci retracement in the direction of the trend. The strongest confluence zone (0.5–0.618) overlaps with the key level.
Based on this, we have a buy setup at 0.6519.
Stop loss: below the 0.5–0.618 Fibonacci zone at 0.6505.
Targets:
* Profit 1: 0.6560
* Profit 2: 0.6600
Analysis by: Analysis by: Hung Minsk Fibo Trung

Potential bearish drop?The Aussie (AUD/USD) has rejected off the pivot, which is a pullback resistance and could potentially drop to the 1st support, which acts as a pullback suport that aligns with the 61.8% Fibonacci projection.
Pivot: 0.6558
1st Support: 0.6446
1st Resistance: 0.6624
Disclaimer:
The above opinions given constitute general market commentary, and do not constitute the opinion or advice of IC Markets or any form of personal or investment advice.
Any opinions, news, research, analyses, prices, other information, or links to third-party sites contained on this website are provided on an "as-is" basis, are intended only to be informative, is not an advice nor a recommendation, nor research, or a record of our trading prices, or an offer of, or solicitation for a transaction in any financial instrument and thus should not be treated as such. The information provided does not involve any specific investment objectives, financial situation and needs of any specific person who may receive it. Please be aware, that past performance is not a reliable indicator of future performance and/or results. Past Performance or Forward-looking scenarios based upon the reasonable beliefs of the third-party provider are not a guarantee of future performance. Actual results may differ materially from those anticipated in forward-looking or past performance statements. IC Markets makes no representation or warranty and assumes no liability as to the accuracy or completeness of the information provided, nor any loss arising from any investment based on a recommendation, forecast or any information supplied by any third-party.

AUDUSD My Opinion! BUY!
My dear followers,
I analysed this chart on AUDUSD and concluded the following:
The market is trading on 0.6526 pivot level.
Bias - Bullish
Technical Indicators: Both Super Trend & Pivot HL indicate a highly probable Bullish continuation.
Target - 0.6565
About Used Indicators:
A super-trend indicator is plotted on either above or below the closing price to signal a buy or sell. The indicator changes color, based on whether or not you should be buying. If the super-trend indicator moves below the closing price, the indicator turns green, and it signals an entry point or points to buy.
Disclosure: I am part of Trade Nation's Influencer program and receive a monthly fee for using their TradingView charts in my analysis.
———————————
WISH YOU ALL LUCK

AUDUSD - TriangleComplex correction since Aug 2025.
This could be the final leg in the higher degree triangle.
potential support around 0.6500
This is on my radar to buy this week.

AUDUSD resistance breakout indicative of a trend change?The AUDUSD remains in a neutral trend, with recent price action indicating a potential resistance retest within the broader uptrend.
Resistance Zone: 0.6560 – a key level from previous consolidation. Price is currently testing or approaching this level.
A bearish rebound from 0.6560 would confirm ongoing downside momentum, with potential targets at:
0.6500 – initial support
0.6490 – psychological and structural level
0.64800 – extended support on the longer-term chart
Bullish Scenario:
A confirmed break and daily close above 0.6560 would weaken the bullish outlook and suggest deeper downside risk toward:
0.6576 – minor resistance
0.6590 – stronger resistance and potential supply zone
Outlook:
Neutral bias remains intact while the AUDUSD trades around the pivotal 0.6560 level. A sustained break below or above this level could shift momentum.
This communication is for informational purposes only and should not be viewed as any form of recommendation as to a particular course of action or as investment advice. It is not intended as an offer or solicitation for the purchase or sale of any financial instrument or as an official confirmation of any transaction. Opinions, estimates and assumptions expressed herein are made as of the date of this communication and are subject to change without notice. This communication has been prepared based upon information, including market prices, data and other information, believed to be reliable; however, Trade Nation does not warrant its completeness or accuracy. All market prices and market data contained in or attached to this communication are indicative and subject to change without notice.

Market Analysis: AUD/USD SoftensMarket Analysis: AUD/USD Softens
AUD/USD is consolidating gains near 0.6550.
Important Takeaways for AUD/USD Analysis Today
- The Aussie Dollar started a downside correction from 0.6620 against the US Dollar.
- There was a break below a key bullish trend line with support at 0.6570 on the hourly chart of AUD/USD.
AUD/USD Technical Analysis
On the hourly chart of AUD/USD, the pair started a fresh increase from 0.6480. The Aussie Dollar was able to clear 0.6550 to move into a positive zone against the US Dollar.
There was also a move above 0.6580 and the 50-hour simple moving average. Finally, the pair tested 0.6600. A high was formed near 0.6617 and the pair is now correcting gains. There was a move below 0.6600 and a key bullish trend line with support at 0.6570.
The pair declined below the 50% Fib retracement level of the upward move from the 0.6478 swing low to the 0.6617 high. On the downside, initial support is near the 61.8% Fib retracement at 0.6530.
The next key area to watch could be 0.6510. If there is a downside break below 0.6510, the pair could extend its decline toward 0.6480. Any more losses might signal a move toward 0.6420.
On the upside, the AUD/USD chart indicates that the pair is now facing hurdles near 0.6560. The first key breakout zone might be 0.6595. An upside break above 0.6595 might send the pair further higher. The next stop for the bulls could be 0.6620. Any more gains could clear the path for a move toward 0.6720.
This article represents the opinion of the Companies operating under the FXOpen brand only. It is not to be construed as an offer, solicitation, or recommendation with respect to products and services provided by the Companies operating under the FXOpen brand, nor is it to be considered financial advice.

AUDUSD - Bullish ReversalAUDUSD has formed double bottom with divergence on 1H timeframe and also taking support from its trendline. Placing buystop with SL below double bottom support

AUDUSD FRGNT Daily Forecast -Q4 | W45 | D3| Y25 |📅 Q4 | W45 | D3| Y25 |
📊 AUDUSD FRGNT Daily Forecast
🔍 Analysis Approach:
I’m applying Smart Money Concepts, focusing on:
Identifying Points of Interest on the Higher Time Frames (HTFs) 🕰️
Using those POIs to define a clear trading range 📐
Refining those zones on Lower Time Frames (LTFs) 🔎
Waiting for a Break of Structure (BoS) for confirmation ✅
This method allows me to stay precise, disciplined, and aligned with the market narrative, rather than chasing price.
💡 My Motto:
"Capital management, discipline, and consistency in your trading edge."
A positive risk-to-reward ratio, paired with a high win rate, is the backbone of any solid trading plan 📈🔐
⚠️ Losses?
They’re part of the mathematical game of trading 🎲
They don’t define you — they’re necessary, they happen, and we move forward 📊➡️
🙏 I appreciate you taking the time to review my Daily Forecast.
Stay sharp, stay consistent, and protect your capital
— FRNGT 🚀
OANDA:AUDUSD

Commodity Futures in World Trading1. Understanding Commodity Futures
A commodity future is a standardized legal contract to buy or sell a specific quantity of a commodity at a predetermined price on a future date. Commodities can be broadly classified into hard commodities—such as crude oil, gold, and natural gas—and soft commodities like wheat, coffee, sugar, and cotton. These contracts are traded on regulated exchanges like the Chicago Mercantile Exchange (CME), London Metal Exchange (LME), Intercontinental Exchange (ICE), and the Multi Commodity Exchange (MCX) in India.
Futures differ from spot trading because they involve agreements for future delivery, though in most cases, contracts are settled financially rather than through physical delivery. Traders use futures to hedge against risk or to profit from anticipated price changes.
2. Historical Background of Commodity Futures
The origin of commodity futures can be traced back to the 17th century Japanese rice markets, where merchants and samurai used forward contracts to lock in rice prices. However, the modern system began in 1848 with the establishment of the Chicago Board of Trade (CBOT), which formalized futures trading for agricultural commodities like corn and wheat. Over time, the system expanded to include metals, energy, and financial instruments, transforming commodity futures into a sophisticated tool of global finance.
3. Key Players in the Commodity Futures Market
The commodity futures market involves several participants, each playing a distinct role:
Hedgers: Producers and consumers who use futures to protect themselves from adverse price movements. For example, an oil producer may sell crude oil futures to lock in prices, while an airline might buy fuel futures to stabilize costs.
Speculators: Traders and investors who take positions to profit from price fluctuations. They provide liquidity to the market.
Arbitrageurs: Professionals who exploit price differences across markets to earn risk-free profits.
Clearing Houses: Entities that guarantee contract performance and minimize counterparty risk.
Exchanges and Regulators: Institutions that oversee trading and ensure transparency and fairness.
4. How Commodity Futures Work
When two parties agree on a futures contract, they commit to buy or sell a commodity at a set price on a specific date. Each contract specifies:
Quantity and quality of the commodity
Delivery date and location
Standardized terms set by the exchange
Traders must deposit an initial margin, a small percentage of the contract value, as a performance guarantee. Prices are marked to market daily—profits and losses are settled based on daily price changes. This ensures that both parties maintain sufficient capital to cover their positions.
At expiration, the contract is either settled by physical delivery (actual exchange of goods) or cash settlement, where differences between the contract and market prices are paid.
5. Importance of Commodity Futures in Global Trade
Commodity futures are indispensable in global trade for several reasons:
a. Price Discovery
Futures markets provide a transparent mechanism for determining global commodity prices. Since prices are driven by collective expectations of traders worldwide, they reflect real-time supply and demand conditions.
b. Risk Management
Producers, exporters, and importers use futures to hedge against price volatility. For instance, a farmer can lock in the price of wheat before harvest, ensuring stable income despite market fluctuations.
c. Market Liquidity
Speculators and institutional traders bring liquidity to the market, enabling quick transactions without major price disruptions.
d. Global Economic Stability
By mitigating price risks and ensuring consistent supply chains, futures contribute to macroeconomic stability, especially in energy and food sectors.
e. Investment Diversification
Commodity futures allow investors to diversify portfolios beyond traditional assets like equities and bonds. Commodities often move differently from stock markets, providing a hedge during inflationary periods.
6. Major Commodity Exchanges Around the World
Several global exchanges facilitate commodity futures trading:
Chicago Mercantile Exchange (CME) – The largest futures exchange, trading in energy, metals, and agricultural commodities.
Intercontinental Exchange (ICE) – Known for energy products like crude oil and natural gas.
London Metal Exchange (LME) – Specializes in base metals like copper, aluminum, and zinc.
Tokyo Commodity Exchange (TOCOM) – Trades energy, metals, and rubber.
Multi Commodity Exchange (MCX), India – A leading exchange for gold, crude oil, and agricultural commodities in Asia.
These exchanges operate electronically, ensuring efficiency, transparency, and real-time global access.
7. Major Commodities Traded in Futures Markets
Commodity futures span across several categories:
Energy: Crude oil, natural gas, heating oil, gasoline
Metals: Gold, silver, platinum, copper, aluminum, zinc
Agriculture: Corn, wheat, soybeans, coffee, sugar, cotton
Livestock: Cattle, hogs, and poultry
Energy and metals are especially crucial to industrial economies, while agricultural futures influence food prices worldwide.
8. Economic Impact of Commodity Futures
Commodity futures influence global trade and economic policy in profound ways:
Inflation Indicator: Rising commodity prices often signal inflationary pressures.
Foreign Exchange Impact: Commodity-exporting nations’ currencies (like Canada, Australia, and Russia) often correlate with commodity prices.
Investment Tool: Institutional investors use commodity indices (like Bloomberg Commodity Index) to gain exposure to global resources.
Supply Chain Efficiency: Futures stabilize business planning for industries dependent on raw materials, ensuring smoother global supply chains.
9. Risks and Challenges in Commodity Futures
Despite their benefits, commodity futures carry inherent risks:
Price Volatility: Sharp market swings can lead to heavy losses for unhedged or speculative positions.
Leverage Risk: Since futures require only margin deposits, losses can exceed initial investments.
Market Manipulation: Large players may attempt to corner markets, influencing prices unfairly.
Regulatory Differences: Diverse rules across countries can create barriers to efficient global trading.
Geopolitical Uncertainty: Wars, sanctions, and trade disputes can disrupt global supply and impact futures prices dramatically.
10. The Future of Commodity Futures Trading
The landscape of commodity futures is evolving rapidly with technology, sustainability, and global economic shifts.
Digital Transformation: Algorithmic trading, AI-based analytics, and blockchain technology are revolutionizing trade execution and settlement processes.
Environmental Commodities: New futures contracts for carbon credits and renewable energy are emerging as sustainability becomes central to global policy.
Emerging Market Participation: Countries like India, Brazil, and China are becoming major players in commodity futures, increasing global liquidity.
Integration with Financial Markets: Commodity futures are increasingly intertwined with financial instruments, enabling broader participation from institutional investors.
Conclusion
Commodity futures are the lifeblood of the global trading system, balancing the interests of producers, consumers, and investors. They not only stabilize prices but also enable efficient allocation of resources and capital across economies. As markets evolve, driven by technology, environmental concerns, and geopolitical shifts, the role of commodity futures will become even more integral to ensuring transparency, liquidity, and resilience in world trade. For businesses, policymakers, and investors alike, understanding and leveraging commodity futures is essential for navigating the complexities of the modern global economy.

AUDUSD | Smart Money Building Long Positions From Demand ZoneAUDUSD is showing early signs of strength after reacting perfectly from the higher-timeframe demand zone (0.6530–0.6550). Price is consolidating near intraday support, suggesting possible accumulation before a liquidity sweep to the upside.
Trade Outlook:
Demand Zone: 0.6530–0.6550 (retest area)
Liquidity Target 1: 0.6596
Liquidity Target 2: 0.6615
Bias: Bullish unless price breaks below 0.6530
Possible Play: Look for BOS + retrace entry confirmation inside demand

AUDUSD: Break of 0.6500 could see higher moves on RBA decisionI will be interested in long positions this week if price can push through 0.65600 and test this level. H4 currently shows hidden bullish divergence while the RSI level shows signs of a possible bullish pullback.
What I like:
- Technical indicators
- Bullish divergence
- Inside a Daily FVG short-term accumulation
What I don't like:
- Upcoming RBA interest rate decision

Long Term Bearish AUDUSD
I believe the macro outlook of AUDUSD is bearish.
Additionally, I believe the recent bull run was part of an an overall bullish retracement on the higher timeframes.
At the start of the week I believe price will close as a bullish candle stick reversal.
Then I am expecting price to make one last bullish attempt before selling off and forming a new Lower Low on the Daily.
