AUDUSD Continues its bullish trend No divergence is visible. The market is clearly making a series of Higher Highs (HHs) and Higher Lows (HLs). AUD is fundamentally strong this week compared to USD, so the best approach is to follow the trend.
Trade ideas

AUDUSD Short From Resistance!
HI,Traders !
#AUDUSD is going up but
Will soon hit a horizontal
Resistance level of 0.66126
From where a local bearish
Pullback is to be expected !
Comment and subscribe to help us grow !

AUD-USD Bullish Breakout! Buy!
Hello,Traders!
AUDUSD broke the descending trendline after a liquidity grab beneath the recent swing low, shifting structure bullish. With demand now holding, price is likely to revisit the upside target as liquidity draws higher. Time Frame 5H.
Buy!
Comment and subscribe to help us grow!
Check out other forecasts below too!
Disclosure: I am part of Trade Nation's Influencer program and receive a monthly fee for using their TradingView charts in my analysis.

AUD/USD BEARS ARE GAINING STRENGTH|SHORT
Hello, Friends!
We are now examining the AUD/USD pair and we can see that the pair is going up locally while also being in a uptrend on the 1W TF. But there is also a powerful signal from the BB upper band being nearby, indicating that the pair is overbought so we can go short from the resistance line above and a target at 0.649 level.
Disclosure: I am part of Trade Nation's Influencer program and receive a monthly fee for using their TradingView charts in my analysis.
✅LIKE AND COMMENT MY IDEAS✅

AUD/USD – Fundamentals Driving Downtrend | 24.11.2025Bearish Channel + Rate-Cut Expectation Pressure = Downside Continuation Setup
🔍 Technical Setup
AUD/USD continues to trade inside a falling channel, respecting the trendline resistance (multiple rejections marked). Price is currently moving toward the resistance zone, offering a potential sell-on-retest opportunity before further downside.
📌 Bias remains bearish as long as price stays below the channel resistance + Ichimoku cloud.
🎯 Trading Plan :
📌 Targets (Support Levels):
1st Support: 0.64130
2nd Support: 0.63912
📌 Invalidation / Risk:
A breakout above 0.6480 would reduce bearish bias.
⚠️ Today’s Fundamental Drivers :
1️⃣ Rate-cut expectations surged:
Markets now price 69% chance of a December rate cut, up from 44% last week → weakens AUD.
2️⃣ New York Fed statement shook sentiment:
Fed official highlighted weak job market as a bigger risk than high inflation, increasing probability of monetary easing → USD firming vs risk currencies like AUD.
➡️ When fundamentals + technical trend align, continuation move is likely.
AUDUSD analysis, AUD/USD forecast, AUDUSD sell setup, Forex signals, Australian dollar outlook, Rate cut impact on forex, AUD technical analysis, price action strategy
⚠️ Disclaimer
This chart is for educational purposes only — not financial advice.
Always manage risk and follow your own trading plan.
❤️ Support the Analysis
If you found this helpful — LIKE 👍 & COMMENT 💬
Your support motivates more daily high-quality chart setups!

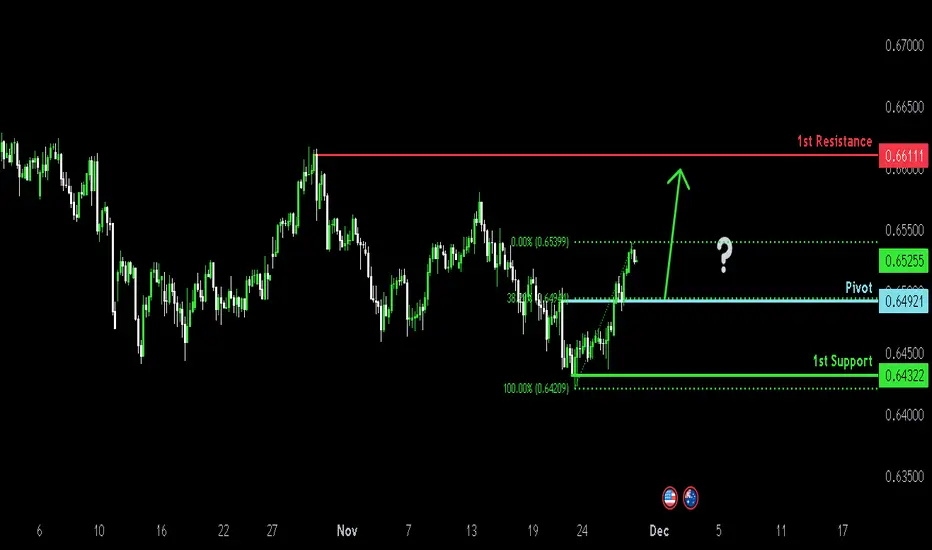
Bullish rise?Aussie (AUD/USD) has bounced off the pivot and could potentially rise to the swing high resistance.
Pivot: 0.6537
1st Support: 0.6509
1st Resistance: 0.6611
Disclaimer:
The opinions given above constitute general market commentary and do not constitute the opinion or advice of IC Markets or any form of personal or investment advice.
Any opinions, news, research, analyses, prices, other information, or links to third-party sites contained on this website are provided on an "as-is" basis, are intended to be informative only, and are not advice, a recommendation, research, a record of our trading prices, an offer of, or solicitation for, a transaction in any financial instrument and thus should not be treated as such. The information provided does not involve any specific investment objectives, financial situation, or needs of any specific person who may receive it. Please be aware that past performance is not a reliable indicator of future performance and/or results. Past performance or forward-looking scenarios based upon the reasonable beliefs of the third-party provider are not a guarantee of future performance. Actual results may differ materially from those anticipated in forward-looking or past performance statements. IC Markets makes no representation or warranty and assumes no liability as to the accuracy or completeness of the information provided, nor any loss arising from any investment based on a recommendation, forecast, or any information supplied by any third party.

AUD/USD eyes wedge breakoutAUD/USD starts the new month testing downtrend resistance dating back to the highs set on September 17. Coiling within a falling wedge, convention suggests a bullish breakout could see the pair retest .6700.
Should we see a clean break above the downtrend, longs could be established above the level with a stop beneath for protection. Given the first attempt in holiday-thinned trade last Friday failed, some may prefer to wait for a close above the trendline before considering the trade.
The November high of .6580 looms as the first topside test, although there’s no meaningful resistance until .6625, where price was capped for lengthy periods earlier in the year. If that level breaks, only minor resistance at .6660 stands between a retest of the September highs above .6700.
The momentum picture remains mixed but is quickly shifting in favour of bullish setups, with RSI (14) now pushing higher above 50 while MACD has crossed the signal line from below and is moving quickly towards positive territory. Should these trends persist, it would favour bullish setups over shorts, increasing the appeal of the trade if a breakout occurs.
Good luck!
DS

AUDUSD Will Move Lower! Short!
Please, check our technical outlook for AUDUSD.
Time Frame: 1h
Current Trend: Bearish
Sentiment: Overbought (based on 7-period RSI)
Forecast: Bearish
The market is on a crucial zone of supply 0.657.
Taking into consideration the current market trend & overbought RSI, chances will be high to see a bearish movement to the downside at least to 0.656 level.
P.S
We determine oversold/overbought condition with RSI indicator.
When it drops below 30 - the market is considered to be oversold.
When it bounces above 70 - the market is considered to be overbought.
Like and subscribe and comment my ideas if you enjoy them!

AUD/USD Extends Uptrend as Market Sentiment Turns BullishMarket Analysis: AUD/USD Extends Uptrend as Market Sentiment Turns Bullish
AUD/USD started a fresh increase above 0.6500 and 0.6520.
Important Takeaways for AUD USD Analysis Today
- The Aussie Dollar started a decent increase above 0.6500 against the US Dollar.
- There is a short-term contracting triangle forming with support at 0.6540 on the hourly chart of AUD/USD.
AUD/USD Technical Analysis
On the hourly chart of AUD/USD, the pair started a fresh increase from 0.6420. The Aussie Dollar was able to clear 0.6500 to move into a positive zone against the US Dollar.
There was a close above 0.6520 and the 50-hour simple moving average. Finally, the pair tested 0.6560. A high was formed near 0.6559 and the pair recently started a short-term downside correction. There was a minor decline below 0.6550.
On the downside, initial support is near a short-term contracting triangle at 0.6540 and the 50-hour simple moving average. The next area of interest could be 0.6520. If there is a downside break below 0.6520, the pair could extend its decline toward the 0.6490 zone and the 50% Fib retracement level of the upward move from the 0.6421 swing low to the 0.6559 high.
Any more losses might signal a move toward 0.6475 and the 61.8% Fib retracement. On the upside, the AUD/USD chart indicates that the pair is now facing resistance near 0.6560.
The first major hurdle for the bulls might be 0.6580. An upside break above 0.6580 might send the pair further higher. The next stop is near 0.6620. Any more gains could clear the path for a move toward 0.6650.
This article represents the opinion of the Companies operating under the FXOpen brand only. It is not to be construed as an offer, solicitation, or recommendation with respect to products and services provided by the Companies operating under the FXOpen brand, nor is it to be considered financial advice.

AUDUSD SELL Setup – Trendline Respect + Liquidity + StructureAUDUSD continues to follow the broader downtrend, respecting the descending trendline multiple times. Price recently pulled back into the trendline and a small supply zone, creating a clean lower-high formation. Liquidity above the minor highs was taken, and the immediate reaction shows sellers stepping back in.
Market structure remains bearish with repeated BOS/CHOCH confirming downside continuation. As long as price stays under the trendline and supply, the bearish momentum is intact.
I’m targeting the next liquidity levels and demand zones below, expecting price to fill inefficiencies on the way down.
SL: Above the sweep / supply zone.
TP: Next major demand / liquidity pool.
This analysis is for educational purposes only.

AUD/USD: Prime setup zone emerges around .6520AUD/USD has rebounded strongly after a brief foray beneath the 200DMA last week, with the pair now sitting just beneath .6520, a level that has repeatedly acted as both support and resistance in recent months. Its location provides a decent area to build trade setups around, depending on how price action evolves in the coming days.
Given its trajectory, bullish setups are marginally favoured even though the overall signal from RSI (14) and MACD is neutral on momentum. This partly reflects we’re entering a low-liquidity period that often sees riskier assets outperform.
Should we see a sustained break and hold above .6520, longs could be established with a stop beneath the level for protection, targeting areas beyond the 50DMA such as the September downtrend, .6580 or .6625, depending on your preferred risk-reward. The 50DMA screens as not far enough away to justify the risk, making it a key level to watch should you initiate the trade. If the price struggles to break cleanly above it, consider closing the position.
If the pair can’t break and hold above .6520, shorts could be established beneath the level with a stop above, targeting the 200DMA initially.
Good luck!
DS

AUDUSDAs usual with our support and resistance, we got this in the bag this week.
Took trade on the 15m TF.
Watch this space this December.
DrElder_

BULLISH BREAKOUT:From downward(descending) channelAUDUSD 4-hour chart, the price action shows a recent **bullish breakout** from a downtrend channel (or descending wedge/flag) and a strong potential for a continuation move higher.
## 📈 Current Technical Outlook
The chart illustrates a clear bullish setup:
* **Pattern Breakout:** The price has successfully broken above the upper trendline of the recent descending corrective structure. This is labeled as **"BREAKOUT"** on the chart and typically signals a reversal or continuation of the previous uptrend.
* **Strong Support:** The preceding move found robust buying interest at the **STRONG SUPPORT** zone (approximately **0.64100 to 0.64400**). This double-bottom formation (indicated by the blue 'W' shape) reinforces the strength of the reversal.
* **Current Price Action:** The pair is now trading above the broken trendline, confirming the breakout. It is currently consolidating around **0.65456**.
## 🎯 Projected Bullish Scenario
The primary target is the major overhead resistance.
### 1. Initial Target: The Resistance Zone
The immediate objective for the buyers is the **RESISTANCE** zone (approximately **0.66200 to 0.66400**).
* This zone represents a significant area of previous selling and consolidation, and it will be a key battleground.
### 2. Continuation and Possible Breakout
* **Trigger:** If the price successfully breaks above the **RESISTANCE** zone (the area marked **"POSSIBLE BREAKOUT"**), it would confirm a powerful continuation of the bullish momentum.
* **Target (TBD):** A successful breakout above **0.66400** would open the path for a move towards the next significant resistance, potentially around **0.66800** or higher, as shown by the upward projection arrow.
## 📉 Risk/Invalidation
The bullish bias remains valid as long as the price stays above the broken trendline and, more importantly, the low of the recent swing.
* **Invalidation Point:** A move that breaks back **below the broken trendline** and challenges the support around the **0.64800 - 0.65000** area would signal a failed breakout and a possible return to the channel structure.
* **Major Support:** The **STRONG SUPPORT** zone at **0.64100 - 0.64400** is the ultimate line in the sand; a clear break below this would heavily favor the bears.
Would you like me to set a price alert for the **RESISTANCE** level near **0.66300**?

AUD/USD: Strong Support Fuels Bullish MomentumCurrently, AUD/USD is testing the strong support at 0.6465, with the price sitting at 0.64990. After touching this support level, the market could rebound strongly due to the solid consolidation trend and support from lower levels.
Technical Analysis:
The chart shows that AUD/USD is in a consolidation pattern, with strong support at 0.6465. If the price maintains above this support, AUD/USD could continue its bullish momentum, aiming for the next resistance level at 0.6540.
News Factor:
The weaker-than-expected CPI (Consumer Price Index) data in the U.S. has increased the likelihood that the Federal Reserve (Fed) will cut interest rates in December. This provides favorable conditions for risk assets like AUD/USD. The Australian Dollar benefits from the weakening USD as investors expect the Fed to reduce rates, boosting demand for the Australian Dollar.
Next Scenario:
If AUD/USD stays above the 0.6490 support level and does not drop below 0.6465, there is a high probability of breaking the 0.6540 resistance level and continuing upward.

AUDUSD FRGNT Daily Forecast - Q4 | W49| D3| Y25 |📅 Q4 | W49| D3| Y25 |
📊 AUDUSD FRGNT Daily Forecast
🔍 Analysis Approach:
I’m applying Smart Money Concepts, focusing on:
Identifying Points of Interest on the Higher Time Frames (HTFs) 🕰️
Using those POIs to define a clear trading range 📐
Refining those zones on Lower Time Frames (LTFs) 🔎
Waiting for a Break of Structure (BoS) for confirmation ✅
This method allows me to stay precise, disciplined, and aligned with the market narrative, rather than chasing price.
💡 My Motto:
"Capital management, discipline, and consistency in your trading edge."
A positive risk-to-reward ratio, paired with a high win rate, is the backbone of any solid trading plan 📈🔐
⚠️ Losses?
They’re part of the mathematical game of trading 🎲
They don’t define you — they’re necessary, they happen, and we move forward 📊➡️
🙏 I appreciate you taking the time to review my Daily Forecast.
Stay sharp, stay consistent, and protect your capital
— FRNGT 🚀
FX:AUDUSD

AUDUSDThe next potential sell scenario of the pair. The sell side was taken. We need the buy side. Our target is the previous monthly hight.
Good luck.

Selling AUD USD after measured move up. RR 2.5 Measured move in lovely swing leg moves in the AUD USD Currency pair. Selling short here with a RR of rouchly 2,5 with a conservative target and a stop above round number and old high. The trading range action around the entry here suggests that a reversal could be likely.

AUDUSD TRADE SETUPWait for retest the entry level and bullish momentum then take a trade for Buy otherwise skip this setup

Bullish momentum to extend?AUD/USD has bounced off the support level, which is a pullback support, and could rise from this level to our target profit.
Entry: 0.6538
Why we like it:
There is a pullback support level.
Stop loss: 0.6502
Why we like it:
There is a pullback support level.
Take profit: 0.6612
Why we like it:
There is a swing high resistance level.
Enjoying your TradingView experience? Review us!
Please be advised that the information presented on TradingView is provided to Vantage (‘Vantage Global Limited’, ‘we’) by a third-party provider (‘Everest Fortune Group’). Please be reminded that you are solely responsible for the trading decisions on your account. There is a very high degree of risk involved in trading. Any information and/or content is intended entirely for research, educational and informational purposes only and does not constitute investment or consultation advice or investment strategy. The information is not tailored to the investment needs of any specific person and therefore does not involve a consideration of any of the investment objectives, financial situation or needs of any viewer that may receive it. Kindly also note that past performance is not a reliable indicator of future results. Actual results may differ materially from those anticipated in forward-looking or past performance statements. We assume no liability as to the accuracy or completeness of any of the information and/or content provided herein and the Company cannot be held responsible for any omission, mistake nor for any loss or damage including without limitation to any loss of profit which may arise from reliance on any information supplied by Everest Fortune Group.

Falling towards 38.2% Fibonacci support?Aussie (AUD/USD) is falling towards the pivot, which acts as a pullback support and could bounce to the 1st resistance.
Pivot: 0.6492
1st Support: 0.6432
1st Resistance: 0.6611
Disclaimer:
The opinions given above constitute general market commentary and do not constitute the opinion or advice of IC Markets or any form of personal or investment advice.
Any opinions, news, research, analyses, prices, other information, or links to third-party sites contained on this website are provided on an "as-is" basis, are intended to be informative only, and are not advice, a recommendation, research, a record of our trading prices, an offer of, or solicitation for, a transaction in any financial instrument and thus should not be treated as such. The information provided does not involve any specific investment objectives, financial situation, or needs of any specific person who may receive it. Please be aware that past performance is not a reliable indicator of future performance and/or results. Past performance or forward-looking scenarios based upon the reasonable beliefs of the third-party provider are not a guarantee of future performance. Actual results may differ materially from those anticipated in forward-looking or past performance statements. IC Markets makes no representation or warranty and assumes no liability as to the accuracy or completeness of the information provided, nor any loss arising from any investment based on a recommendation, forecast, or any information supplied by any third party.
AUDUSD trend change supported at 0.6535The AUDUSD remains in a bullish trend, with recent price action showing signs of a breakout within the broader uptrend.
Support Zone: 0.6535 – a key level from previous consolidation. Price is currently testing or approaching this level.
A bullish rebound from 0.6535 would confirm ongoing upside momentum, with potential targets at:
0.6595 – initial resistance
0.6650 – psychological and structural level
0.6640 – extended resistance on the longer-term chart
Bearish Scenario:
A confirmed break and daily close below 0.6535 would weaken the bullish outlook and suggest deeper downside risk toward:
0.6515 – minor support
0.6490 – stronger support and potential demand zone
Outlook:
Bullish bias remains intact while the AUDUSD holds above 0.6535 A sustained break below this level could shift momentum to the downside in the short term.
This communication is for informational purposes only and should not be viewed as any form of recommendation as to a particular course of action or as investment advice. It is not intended as an offer or solicitation for the purchase or sale of any financial instrument or as an official confirmation of any transaction. Opinions, estimates and assumptions expressed herein are made as of the date of this communication and are subject to change without notice. This communication has been prepared based upon information, including market prices, data and other information, believed to be reliable; however, Trade Nation does not warrant its completeness or accuracy. All market prices and market data contained in or attached to this communication are indicative and subject to change without notice.

AUDUSD - great buy trade opportunity AUDUSD was in a recent downtrend for the last few weeks and struggled to stay bullish, but recently it has just broken a strong resistance trend line which it tested several times and failed to break through. AUDUSD is very likely to hit the next major resistance zone which is market as the "TAKE PROFIT" LEVEL. There are many clear signs of new bullish movements. BUY AUDUSD now

Is the Aussie Awakening a Mirage?The Australian Dollar is staging a formidable recovery, driven by a stark divergence in central bank leadership and shifting geopolitical tides. As the pair approaches the critical 0.6600 resistance, we analyze the multi-domain factors fueling this ascent.
Geopolitics & Geostrategy: The Stability Premium
Global capital is currently re-evaluating the "safety" premium. The US grapples with political gridlock and government shutdown threats. Meanwhile, Australia presents a geostrategic anchor in the Asia-Pacific. The AUD is benefiting from a "stability premium" as investors rotate out of the uncertainty plaguing the US Dollar. Furthermore, renewed hopes for European peace deals have buoyed global risk sentiment. This shift disproportionately benefits high-beta currencies like the AUD over the safe-haven USD.
Management & Leadership: Bullock vs. Powell
The divergence in governance between the Reserve Bank of Australia (RBA) and the Federal Reserve drives this trend. RBA Governor Michele Bullock displays assertive leadership, maintaining a hawkish stance to combat sticky inflation. In contrast, the Federal Reserve appears reactive, with markets pricing in a high chance of a December rate cut. This leadership contrast—steadfastness versus capitulation is steering capital flows toward the AUD.
Industry Trends & Innovation: The Infrastructure Boom
A hidden driver of the AUD’s resilience is a surge in high-tech infrastructure. Q3 GDP data revealed that while household consumption slowed, private investment surged 2.9%. This growth relies heavily on machinery, equipment, and renewable energy projects. This is not just a mining story anymore; it is an infrastructure evolution. Tangible capital expenditure in technology sectors provides a structural floor for the currency that speculative flows cannot match.
Macroeconomics: The Two-Speed Economy
Australia currently exhibits a classic "two-speed" economy. The consumer sector softens under the weight of cost-of-living pressures, yet the business sector aggressively expands capacity. The 0.4% GDP growth missed forecasts, yet the currency rallied. The reason is simple: sticky inflation forces the RBA to keep rates higher for longer. In a world where the US cuts rates, Australia’s high-yield status acts as a powerful magnet.
Business Models: Intellectual Property of Policy
Metaphorically, the RBA holds the "patent" on credible inflation targeting in 2025. Other central banks pivot prematurely, but the RBA’s refusal to cut rates preserves the integrity of their monetary policy. This adherence to mandate over market pressure creates a predictable business environment for foreign investors. It distinguishes the AUD as a currency of yield and integrity in a volatile G10 landscape.
Technical Analysis: The Battle Lines
The AUD/USD has executed a V-shaped recovery, bouncing from key support. The pair is now confronting the 2022 trendline at 0.6592/98.
* Bullish Case: A weekly close above 0.6598 invalidates the bearish trend. This opens the door to 0.6651 * and 0.6723 .
* Bearish Case: Failure here triggers a potential "Head and Shoulders" pattern. This targets a retest of 0.6453 .
* Algorithmic Insight: High-frequency traders likely target this specific trendline collision. Expect volatility as human conviction battles automated resistance.
Final Verdict: The fundamental backdrop favors the bulls due to the RBA/Fed policy divergence. However, the technical barrier at 0.6600 is formidable. Traders must watch for a confirmed breakout before chasing this rally further.
