Potential bullish bounce?The Aussie (AUD/USD) has bounced off the pivot which acts as a pullback support that is slightly above the 50% Fibonacci retracement and could bounce to the 1st resistance which is a pullback resistance that lines up with the 50% Fibonacci retracement.
Pivot: 0.6569
1st Support: 0.6509
1st Resistance: 0.6639
Disclaimer:
The above opinions given constitute general market commentary, and do not constitute the opinion or advice of IC Markets or any form of personal or investment advice.
Any opinions, news, research, analyses, prices, other information, or links to third-party sites contained on this website are provided on an "as-is" basis, are intended only to be informative, is not an advice nor a recommendation, nor research, or a record of our trading prices, or an offer of, or solicitation for a transaction in any financial instrument and thus should not be treated as such. The information provided does not involve any specific investment objectives, financial situation and needs of any specific person who may receive it. Please be aware, that past performance is not a reliable indicator of future performance and/or results. Past Performance or Forward-looking scenarios based upon the reasonable beliefs of the third-party provider are not a guarantee of future performance. Actual results may differ materially from those anticipated in forward-looking or past performance statements. IC Markets makes no representation or warranty and assumes no liability as to the accuracy or completeness of the information provided, nor any loss arising from any investment based on a recommendation, forecast or any information supplied by any third-party.
Trade ideas

AUDUSD | Supply to Demand Flip ExplainedIn this video, I break down the Supply-to-Demand Flip concept using AUDUSD as a live example. 🚀
You’ll learn how institutions shift control from sellers to buyers, and how to spot these flips to align your trading with smart money.
🔑 What you’ll learn:
How supply zones turn into demand zones (and vice versa)
Why liquidity grabs are key to confirming flips
How to use the flip for high-probability trade entries
Live AUDUSD breakdown with chart examples
🌍 Fundamentals in play:
AUD remains sensitive to global risk sentiment and commodity prices, while USD strength is tied to Federal Reserve policy expectations. These fundamentals often accelerate supply-to-demand flips.
👉 Whether you’re new to Smart Money Concepts or refining your edge, this video gives you actionable insights you can apply to your charts immediately.
✅ Don’t forget to Boost, and Follow for more breakdowns on S&D,SMC, trade setups, and forex education.

AUDUSD BUY LIMIT FULL BREAKDOWN -Q3 | W39 | D22 | Y25|
Q3 | W39 | D22 | Y25|
📊 AUDUSD BUY LIMIT FULL BREAKDOWN
🔍 Analysis Approach:
I’m applying Smart Money Concepts, focusing on:
Identifying Points of Interest on the Higher Time Frames (HTFs) 🕰️
Using those POIs to define a clear trading range 📐
Refining those zones on Lower Time Frames (LTFs) 🔎
Waiting for a Break of Structure (BoS) for confirmation ✅
This method allows me to stay precise, disciplined, and aligned with the market narrative, rather than chasing price.
💡 My Motto:
"Capital management, discipline, and consistency in your trading edge."
A positive risk-to-reward ratio, paired with a high win rate, is the backbone of any solid trading plan 📈🔐
⚠️ Losses?
They’re part of the mathematical game of trading 🎲
They don’t define you — they’re necessary, they happen, and we move forward 📊➡️
🙏 I appreciate you taking the time to review my Daily Forecast.
Stay sharp, stay consistent, and protect your capital
— FRNGT 🚀
FX:AUDUSD

AUDUSD Daily Forecast UPDATE BUY LIMIT -Q3 | W39 | D22 | Y25|Q3 | W39 | D22 | Y25|
📊 AUDUSD Daily Forecast
🔍 Analysis Approach:
I’m applying Smart Money Concepts, focusing on:
Identifying Points of Interest on the Higher Time Frames (HTFs) 🕰️
Using those POIs to define a clear trading range 📐
Refining those zones on Lower Time Frames (LTFs) 🔎
Waiting for a Break of Structure (BoS) for confirmation ✅
This method allows me to stay precise, disciplined, and aligned with the market narrative, rather than chasing price.
💡 My Motto:
"Capital management, discipline, and consistency in your trading edge."
A positive risk-to-reward ratio, paired with a high win rate, is the backbone of any solid trading plan 📈🔐
⚠️ Losses?
They’re part of the mathematical game of trading 🎲
They don’t define you — they’re necessary, they happen, and we move forward 📊➡️
🙏 I appreciate you taking the time to review my Daily Forecast.
Stay sharp, stay consistent, and protect your capital
— FRNGT 🚀
FX:AUDUSD

AUD USD long idea: USD starting to looseit'se post FOMC momentumAs previously mentioned, it's been widely suggested it would only be a matter of time before the USD started to weaken again. And the USD strength has stalled on most charts at 4hr support.
I've chosen the AUD to long but there is a case to say any of the 'risk on' currencies are viable.
The risk to the trade is a re-emergence of US 'higher for longer' narrative'.

AUD_USD LONG FROM SUPPORT|
✅AUD_USD is going down now
But a strong support level is ahead at 0.6560
Thus I am expecting a rebound
And a move up towards the target of 0.6600
LONG🚀
✅Like and subscribe to never miss a new idea!✅

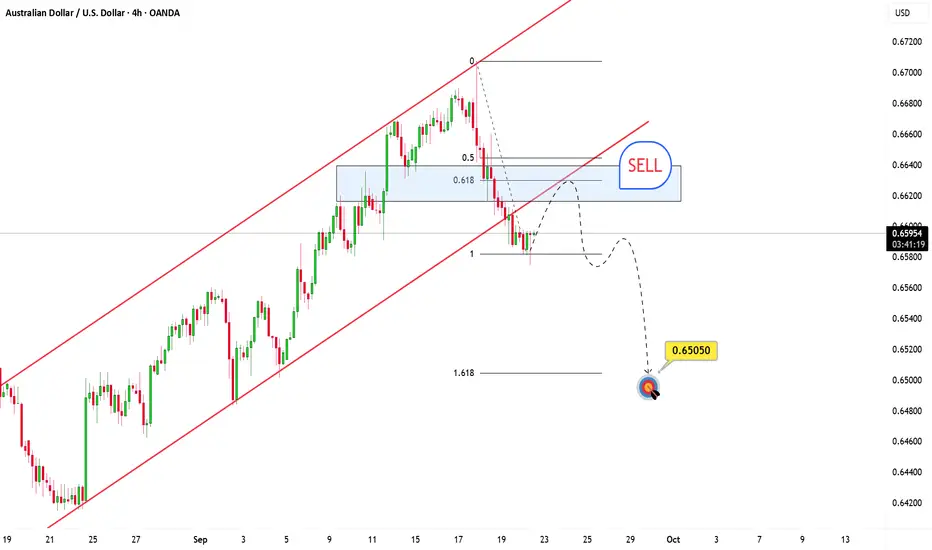
AUDUSD keeps showing weakness after that latest dropHey everyone, Ken here!
Right now, AUDUSD is shaping up into a textbook bearish setup. Price has broken through a key support level and is already showing early signs of selling pressure taking control. Following the breakdown, the market is pulling back to retest that broken zone, a classic move that often confirms continuation to the downside.
Given this technical backdrop, I don’t expect price to reclaim that old support, which now acts as resistance. A clean rejection from this area could trigger the next leg lower, with a projected target around 0.65050, perfectly aligned with the 1.618 Fibonacci extension.
What’s your take on this setup?
AUDUSD Uptrend support retest at 0.6570The AUDUSD remains in a bullish trend, with recent price action showing signs of a breakout within the broader uptrend.
Support Zone: 0.6570 – a key level from previous consolidation. Price is currently testing or approaching this level.
A bullish rebound from 0.65710 would confirm ongoing upside momentum, with potential targets at:
0.6670 – initial resistance
0.6690 – psychological and structural level
0.6707 – extended resistance on the longer-term chart
Bearish Scenario:
A confirmed break and daily close below 0.6570 would weaken the bullish outlook and suggest deeper downside risk toward:
0.6550 – minor support
0.6530 – stronger support and potential demand zone
Outlook:
Bullish bias remains intact while the AUDUSD holds above 0.6570. A sustained break below this level could shift momentum to the downside in the short term.
This communication is for informational purposes only and should not be viewed as any form of recommendation as to a particular course of action or as investment advice. It is not intended as an offer or solicitation for the purchase or sale of any financial instrument or as an official confirmation of any transaction. Opinions, estimates and assumptions expressed herein are made as of the date of this communication and are subject to change without notice. This communication has been prepared based upon information, including market prices, data and other information, believed to be reliable; however, Trade Nation does not warrant its completeness or accuracy. All market prices and market data contained in or attached to this communication are indicative and subject to change without notice.

AUDUSD: Bulls Will Push Higher
It is essential that we apply multitimeframe technical analysis and there is no better example of why that is the case than the current AUDUSD chart which, if analyzed properly, clearly points in the upward direction.
Disclosure: I am part of Trade Nation's Influencer program and receive a monthly fee for using their TradingView charts in my analysis.
❤️ Please, support our work with like & comment! ❤️

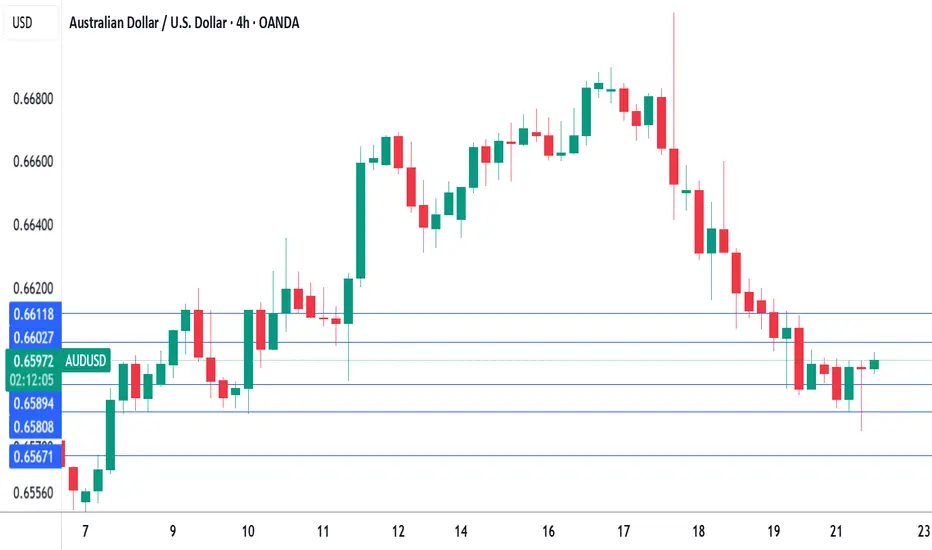
RBA's Bullock says inflation under control, Aussie steadyRBA Governor Bullock testified before a parliamentary committee on Monday. Bullock said that inflation was in a "very good position" as higher interest rates had curbed demand. Still, she warned that there inflation risks remained on "both sides".
Bullock was less positive about the geopolitical environment, warning that the significant change in the global trading system which had created massive uncertainty. The Reserve Bank was particularly concerned about the impact of US tariffs on China, Australia's largest trading partner.
Bullock warned that the financial markets had not priced in the risks of the tariffs, which could affect financial stability if the the domstic economy was significantly affected by the tariffs.
The RBA is expected to hold the cash rate at 3.6% at next week's meeting, after lowering rates by a quarter-point in August. The markets have priced in a 10% likelihood of a rate cut at the upcoming meeting, with an 86% likelihood of a cut in November.
There are no US economic releases today but investors will be keeping a close eye on Fedspeak, with five FOMC members scheduled to deliver public remarks. New Fed Governor Miran, who voted for a 50-bp cut at the September 17 meeting, is expected to give a detailed explanation of his view in today's speech.
At last week's meeting, the Fed signaled that more rate cuts were coming and the markets have priced in an October cut at 90%, according to CME's FedWatch. The Fed appears to have shifted to a more dovish stance after maintaining rates since December 2024 until lowering rates last week.
AUDUSD tested support at 0.6589 and 0.6580 earlier. Next, there is support at 0.6567
There is resistance at 0.6602 and 0.6611
AUD/USD Trims Gains, Will Bears Take Full Control?Market Analysis: AUD/USD Trims Gains, Will Bears Take Full Control?
AUD/USD failed to stay in a positive zone and declined below 0.6650.
Important Takeaways for AUD/USD Analysis Today
- The Aussie Dollar started a fresh decline from well above 0.6680 against the US Dollar.
- There is a connecting bearish trend line forming with resistance at 0.6610 on the hourly chart of AUD/USD.
AUD/USD Technical Analysis
On the hourly chart of AUD/USD, the pair struggled to clear 0.6700. The Aussie Dollar started a fresh decline below 0.6650 against the US Dollar.
The pair even settled below 0.6620 and the 50-hour simple moving average. There was a clear move below 0.6600. A low was formed at 0.6581 and the pair is now consolidating losses below the 23.6% Fib retracement level of the downward move from the 0.6706 swing high to the 0.6581 low.
On the upside, immediate resistance is near a connecting bearish trend line at 0.6610 and the 50-hour simple moving average. The next major hurdle for the bulls could be near 0.6645 and the 50% Fib retracement.
The main selling point could be 0.6660, above which the price could rise toward 0.6690. Any more gains might send the pair toward 0.6700. A close above 0.6700 could start another steady increase in the near term. In the stated case, the next key resistance on the AUD/USD chart could be 0.6750.
On the downside, initial support is near 0.6580. The next area of interest might be 0.6550. If there is a downside break below 0.6550, the pair could extend its decline. The next target for the bears might be 0.6500. Any more losses might send the pair toward 0.6420.
This article represents the opinion of the Companies operating under the FXOpen brand only. It is not to be construed as an offer, solicitation, or recommendation with respect to products and services provided by the Companies operating under the FXOpen brand, nor is it to be considered financial advice.

AUDUSD H4 | Bullish reversalThe Aussie (AUD/USD) is falling towards the buy entry, which is a pullback support that aligns with the 61.8% and the 50% Fibonacci retracement and could bounce from this level to the upside.
Buy entry is at 0.6567, which is a pullback support that aligns with the 61.8% and the 50% Fibonacci retracement.
Stop loss is at 0.6511, which is a pullback support that is slightly below the 61.8% Fibonacci retracement.
Take profit is at 0.6636, which is a pullback resistance.
High Risk Investment Warning
Trading Forex/CFDs on margin carries a high level of risk and may not be suitable for all investors. Leverage can work against you.
Stratos Markets Limited (tradu.com ):
CFDs are complex instruments and come with a high risk of losing money rapidly due to leverage. 65% of retail investor accounts lose money when trading CFDs with this provider. You should consider whether you understand how CFDs work and whether you can afford to take the high risk of losing your money.
Stratos Europe Ltd (tradu.com ):
CFDs are complex instruments and come with a high risk of losing money rapidly due to leverage. 66% of retail investor accounts lose money when trading CFDs with this provider. You should consider whether you understand how CFDs work and whether you can afford to take the high risk of losing your money.
Stratos Global LLC (tradu.com ):
Losses can exceed deposits.
Please be advised that the information presented on TradingView is provided to Tradu (‘Company’, ‘we’) by a third-party provider (‘TFA Global Pte Ltd’). Please be reminded that you are solely responsible for the trading decisions on your account. There is a very high degree of risk involved in trading. Any information and/or content is intended entirely for research, educational and informational purposes only and does not constitute investment or consultation advice or investment strategy. The information is not tailored to the investment needs of any specific person and therefore does not involve a consideration of any of the investment objectives, financial situation or needs of any viewer that may receive it. Kindly also note that past performance is not a reliable indicator of future results. Actual results may differ materially from those anticipated in forward-looking or past performance statements. We assume no liability as to the accuracy or completeness of any of the information and/or content provided herein and the Company cannot be held responsible for any omission, mistake nor for any loss or damage including without limitation to any loss of profit which may arise from reliance on any information supplied by TFA Global Pte Ltd.
The speaker(s) is neither an employee, agent nor representative of Tradu and is therefore acting independently. The opinions given are their own, constitute general market commentary, and do not constitute the opinion or advice of Tradu or any form of personal or investment advice. Tradu neither endorses nor guarantees offerings of third-party speakers, nor is Tradu responsible for the content, veracity or opinions of third-party speakers, presenters or participants.

Q3 | W39 | D22 | Y25| - AUDUSD Daily Forecast📅 Q3 | W39 | D22 | Y25|
📊 AUDUSD Daily Forecast
🔍 Analysis Approach:
I’m applying Smart Money Concepts, focusing on:
Identifying Points of Interest on the Higher Time Frames (HTFs) 🕰️
Using those POIs to define a clear trading range 📐
Refining those zones on Lower Time Frames (LTFs) 🔎
Waiting for a Break of Structure (BoS) for confirmation ✅
This method allows me to stay precise, disciplined, and aligned with the market narrative, rather than chasing price.
💡 My Motto:
"Capital management, discipline, and consistency in your trading edge."
A positive risk-to-reward ratio, paired with a high win rate, is the backbone of any solid trading plan 📈🔐
⚠️ Losses?
They’re part of the mathematical game of trading 🎲
They don’t define you — they’re necessary, they happen, and we move forward 📊➡️
🙏 I appreciate you taking the time to review my Daily Forecast.
Stay sharp, stay consistent, and protect your capital
— FRNGT 🚀
FX:AUDUSD

Bullish bounce off pullback support?The Aussie (AUD/USD) is falling towards the pivot, which acts as a pullback support and could bounce to the 1st resistance.
Pivot: 0.6544
1st Support: 0.6399
1st Resistance: 0.6794
Disclaimer:
The above opinions given constitute general market commentary, and do not constitute the opinion or advice of IC Markets or any form of personal or investment advice.
Any opinions, news, research, analyses, prices, other information, or links to third-party sites contained on this website are provided on an "as-is" basis, are intended only to be informative, is not an advice nor a recommendation, nor research, or a record of our trading prices, or an offer of, or solicitation for a transaction in any financial instrument and thus should not be treated as such. The information provided does not involve any specific investment objectives, financial situation and needs of any specific person who may receive it. Please be aware, that past performance is not a reliable indicator of future performance and/or results. Past Performance or Forward-looking scenarios based upon the reasonable beliefs of the third-party provider are not a guarantee of future performance. Actual results may differ materially from those anticipated in forward-looking or past performance statements. IC Markets makes no representation or warranty and assumes no liability as to the accuracy or completeness of the information provided, nor any loss arising from any investment based on a recommendation, forecast or any information supplied by any third-party.

possibility of correction It is expected that the current support area will change and we will see the start of an upward trend. Otherwise, a continuation of the downtrend is possible until the next support levels.

AUDUSD | Bearish Rejection from Order Block – Targeting Sell-SidHello Billionaires!!
In EURUSD D1 Projection we know the Price swept the Buy-Side Liquidity (BSL) and tapped into the Fair Value Gap (FVG) and Order Block (OB), showing signs of rejection. This aligns with Smart Money Concepts (SMC) for a potential bearish move.
🔹 Key Points:
Liquidity grab above recent highs (BSL).
FVG + OB acting as a rejection zone.
Price expected to target the Sell-Side Liquidity (SSL).
Balanced Price Range (BPR) around 0.6450 serves as a strong downside target.
Bearish bias remains valid as long as price stays below the OB/FVG zone.

AUDUSD Technical & Order Flow AnalysisOur analysis is based on a multi-timeframe top-down approach and fundamental analysis.
Based on our assessment, the price is expected to return to the monthly level.
DISCLAIMER: This analysis may change at any time without notice and is solely intended to assist traders in making independent investment decisions. Please note that this is a prediction, and I have no obligation to act on it, nor should you.
Please support our analysis with a boost or comment!

AUDUSD - Weekly OutlookPair: AUDUSD
Bias: Bullish
HTF Overview (4H):
Bullish structure is intact, with momentum visually clear and intent showing strong upside direction.
MTF (2H/1H/30M):
Price has been mapped and refined to precision. The OB zone has already been mitigated, so now we wait for confirmation of continuation.
LTF (30M/5M):
Looking for a CHoCH confirmation with a breach of the LH. Once that occurs, we’ll attend the bullish leg for long setups.
Targets:
• TP1: 5M highs
• TP2: 30M highs (depending on delivery)
Mindset Note:
AU rewards patience — let the CHoCH print before entering. A confirmed breach of structure keeps you aligned with the higher-timeframe bullish momentum.

AUD/USD - Forecast (To fall further)🇦🇺🇺🇸 AUD/USD – 8H Breakdown
AUD/USD just wrapped up that juicy Wave 3 run and topped near 0.6780. Now we’re cooling off with a corrective pullback — perfect spot to hunt buys 👀
🎯 Buy Zones
Buy Zone 1: 0.6520 – 0.6530 → first bounce area ⚡
Buy Zone 2 (Preferred): 0.6460 – 0.6480 → 71% retrace + wedge support 🏹
📈 Playbook
Let price dip into demand (ideally Buy Zone 2).
Load up → ride it back toward 0.6700.
If bulls flex, we sweep those 0.6780 highs for liquidity. 🚀
🔍 Outlook
Short-term: Expect deeper retrace into demand.
Mid-term: Bulls looking for another leg higher.
Bias : Pullback → Buy continuation 🔥

AUDUSD Is Very Bullish! Long!
Take a look at our analysis for AUDUSD.
Time Frame: 6h
Current Trend: Bullish
Sentiment: Oversold (based on 7-period RSI)
Forecast: Bullish
The price is testing a key support 0.659.
Current market trend & oversold RSI makes me think that buyers will push the price. I will anticipate a bullish movement at least to 0.666 level.
P.S
We determine oversold/overbought condition with RSI indicator.
When it drops below 30 - the market is considered to be oversold.
When it bounces above 70 - the market is considered to be overbought.
Like and subscribe and comment my ideas if you enjoy them!

AUDUSD--SHORT--Bearish bias
--for big picture see the daily chart I just published. (I also added below)
--tp and entry levels are as shown on chart

AUDUSD--SHORT--Bearish bias
--time to move down to the lower side of the long lasting bullish channel
--tp and entry levels are as shown on chart

AUD-USD Support Below! Buy!
Hello,Traders!
AUD-USD is falling down
In a local downtrend but
The pair will soon hit
A horizontal support level
Of 0.6558 from where
A local bullish rebound
Is to be expected
Buy!
Comment and subscribe to help us grow!
Check out other forecasts below too!
Disclosure: I am part of Trade Nation's Influencer program and receive a monthly fee for using their TradingView charts in my analysis.
