BRL struggling right now. Next weeks are critical.All necessary information is on the chart.
Following last years elections results BRL recovered against the US dollar, but despite a series of positive indicators, reports and overall better economical mood BRL failed to follow towards the target of the previous head and shoulders pattern, instead, encouraged by yet another corruption scandal, the price has been hiking strong, and has the potential to trigger a massive cup and handle pattern. Such a massive loss of value is not unheard of in South America, and has as a matter o fact befallen a neighboring country - Argentina - a few years ago.
Trade ideas

Shark or Bat... Its all about risk and tolerance!If you search about the news on Latin America, you will find turbulence...
Where do you want to make your leverage?
Risk and tolerance is moderate.

USD/BRL: almost too obvious...No comments needed, I suppose.... Almost too symmetrical and too good...
All USD-shorts supported by other main USD crossed so go for it!

Brazilian Real predictionsI think our Brazilian Real will be more strong in the next year.
Probably more Brazilians go to Disney in 2020.
hehe


#BRICS currencies movement for the Week - 22Feb19Fairly stable week for most BRICS #currencies, thanks to some USD weakness. #SouthAfrica recovering some of last weeks losses. #BRICS currency/USD movements for this week:
Brazil -1.3%
Russia +1.4%
India +0.4%
China +0.9%
South Africa +0.5%
Euro/USD +0.4%
I must admit that the one currency that is looking mighty interesting technically this week, is the Brazilian Real. At 0.2664/USD it is not only finding itself close to the 50-day moving average at 0.2652/USD, but also at a nice little trend resistance line. A bounce off these levels could see us test the short-term highs made in both January this year and October 2018 – target 0.2744/USD . Should the current resistance break, traders should watch the 200-day moving average at 0.2608/USD as first target/stop.

USDBRL - Downtrend line resistanceIn the graph we can see the primary line (yellow 55 days) and secondary line (green 21 days) are still point down. The downs and ups of peaks and troughs are getting lower peaks and lower troughs. We can draw a downtrend line connecting the peaks, is a resistance line.
For tomorrow we can expect the downtrend line act as a resistance around 3.73 and if the price goes down we can see the next support 3.68, 3.64, 3.60.

More USD Dollar for your money!Time to take profit. If the pattern H&S works, targets are in the chart.
Avoid if cross $4.00 with strong bulls.

Queda no Preço do USD ao BRLO preço do Dolar Americano no câmbio USD BRL continuará a cair amanhã conforme minha previsão, baseada em análises técnica e fundamentalista. Vista, aquela, no gráfico de 15 minutos.
E deve continiar a cair no mês de fevereiro de 2019, até a faixa entre os preços de R$3,3480 e R$3,1149, mas pode descer até R$3,0415, conforme o gráfico semanal.

Great Opportunity - ShortUSD / BRL is testing important support and can break down with an H & S. If the break down is confirmed, it will search for the following targets. The first target is easy, very likely. The latter is a difficult target, indicating the maximum range of H & S.


USDBRL shorter term targets Small bull div could take us to 3.7-3.8 but my targets of 3.58 and 3.43 stand. Februrary-April.

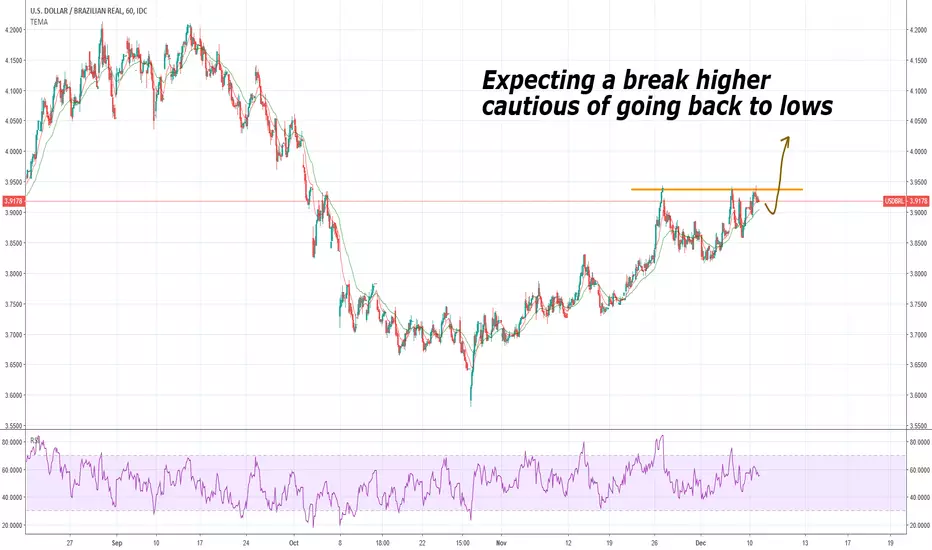
Let's get that 0.4 lost level shall weBullish divergence on weekly and monthly. Lost 0.4 level wasnt retested. What's more to say?

Será que vem queda por ai ?Grafico semanal do Dólar, bateu no topo anterior e está configurando um OCO perfeito, abaixando da neckline tem alvos na faixa de 3,30

A drop is coming!The risk reward is far too for me not to post it! The bottom is near. Interesting how this correlates with my DXY long-term view!


BRLUSD Inverse H&SThis relates to the recent market crash being seen in the S&P 500 Index.
Long order should only be triggered at the breakout of the neckline.

Brasil In Trouble In My View... This chart is so bullish. Cup and handle..
In two years this can crash..


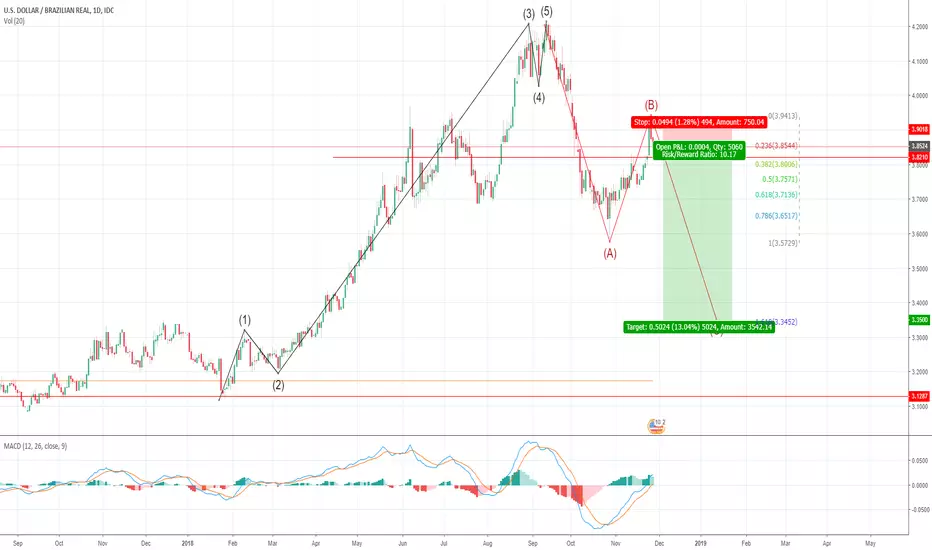
Dollar is losing strength!With that bounce, i must assume that we've officially have put our "b" (these b waves can be tricky to catch them), and now we're going for deep correction. If we do make a new high from here, this count will be completely invalidated.

Dollar is losing strength! With that bounce, i must assume that we've officially have put our "b" (these b waves can be tricky to catch them), and now we're going for deep correction. If we do make a new high from here, this count will be completely invalidated.