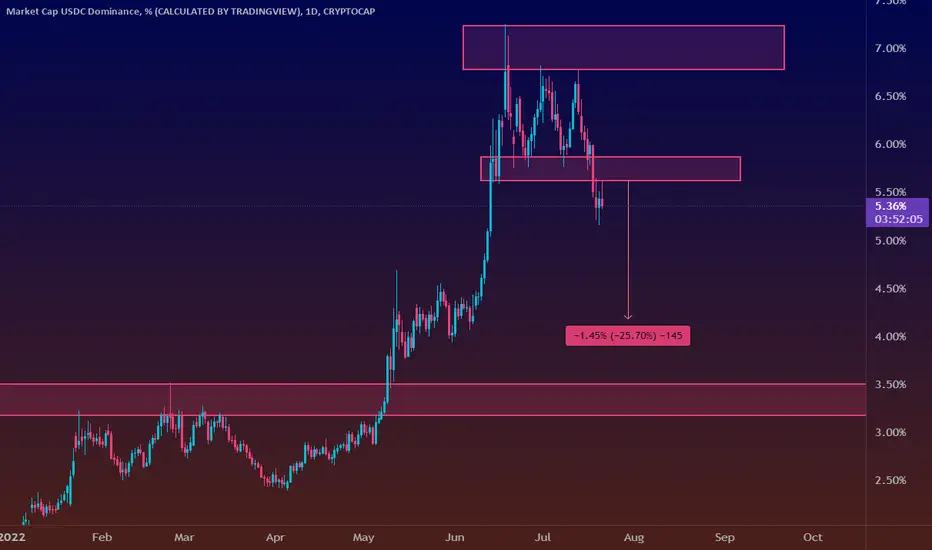
#Stable Dominance , Dump will Continue, Here's Why!Once this pennant breaks below BTC is likely to hit $22.5k+.
Is it likely? I think Yes.
Lower support is around 4.14%
Once this level hits expect some correction in the market.
The charts show the possibility of the continuation of this uptrend.
Invalidation:- Break and close above 4.85%
Let me know what. you think.
Please hit the like button if you like it and share your views in the comment section.
Stay safe
#PEACE
Market Cap USDC Dominance, %
No trades
Trade ideas

USDC - A strange gap that feels aloneIt is worth keeping an eye on this gap on USDC.D because it could be used as a potential flashpoint and space to create an earthquake in the crypto market.
The vast majority of intestors and traders are watching USDT.D which is a mistake looking at the fact that USDC is also a very important player in the market

🎯 Stablecoins dominance - the DXY of Cryptoverse🎯 Today we'll have a look at the cumulated dominance of Tether USD, Circle USD and DAI in comparison with Bitcoin's price.
Since 2019 Stables dominance has been ranging inside this channel on the logarithmic chart.
The channel is moving upwards as more funds enter and remain in the cryptoverse.
As such, the dominance of Stables is highly dependent on interest in these assets, so I expect this channel to break at one point (at minimum due to saturation of the market). So far this channel has held.
Touches of the upper band marked bottoms for BTC, while touches of the lower band marked tops.
Thus, I'm looking at their dominance as inversely correlated with Bitcoin's price, similar to how DXY is inversely correlated with the stock market.
We are currently in an up move that's been trending the blue line since the 69k$ top.
Considering the channel holds, we can expect one of the two scenarios to develop and mark a reversal in the market.
This doesn't mean that it is the only way we are ending the bear market. However, I am watching this closely. 🎯
💎 Looking forward for your questions below. If this post provided you value, follow for more.

USDC.DI am waiting for a breakout and confirmation to continue down to 5%. But its trend line is still valid.

Analysis of USDC.D in 1 hour time frameAs you can see in the above image, Dominance has formed a diamond tetrahedron, which is a sign that Dominance is rising to the desired point. It can also be seen in RSI that the risk of a downward trend has been broken. As a result, if this scenario is true, BTC will decline, so it is better. Open sell trades in BTC in 1 hour time frame.
I am waiting for your warm comments
Thanks

USDC dominance. Where do we go next?To be honest, I do not really believe we will fall much more lower, as you can see we are currently in oversold area per RSI, hence we will might see upcoming correction on ALTs and BTC
As for me, PATIENCE is the virtue, so I would rather stay out of any position, except shorts and await for more transparent market conditions

USDC.DDISCLAIMER:
This is not financial advice! This is an opinion-based show. I am not a financial adviser. Please only invest what you can afford to lose, and we encourage you to do your own research before investing.
everyone should buy and sell according to their own strategy.
Everything you need to know is outlined in the chart and keep in mind that we are moving forward with probabilities and the analysis may be wrong so take capital management seriously.
Maybe the bottom isn’t in yet!With usdc and usdt dominance on triple and double bottom, which means a reversal on the upside is actually threatening! Even with that, the RSI been on oversold the entire time is something we’ve not seen even in a bear market!
I was wondering, if the dominance of stable coins keep moving up thats a downturn on crypto assets!
If the charts are correct, i think the bottom might not be in yet!

USDC.D needs to close below support zone for crypto rally#USDC.D
#CRYPTOCAP
Market Cap USDC Dominance is below lower line of triangle and retesting the broken line.
breaks down the support zone will trigger a bullish rally across the crypto market.

#USDC Dominance looks weak, Bullish rally ahead?USDC Dominance:- The index is showing signs of weakness.
This might be considered a hint that a rally is coming across the market.
Rejection from the upper resistance as well as from the red resistance area has already been retested.
Breakout of this pattern is likely in the next few days.
IMO, It's safe to position into BTC and Alts unless it breaks and closes above 6.88%.
Hit the like button and share your views in the comment section.
Thank you
#PEACE

#USDC.DOMINANCE 2HR CHART UPDATE !!Hello, community members welcome to another USDC DOMINANCE chart update.
If you find this update helpful, shoot the like button follow and share your views in the comment section.
As we can see from the above-mentioned chart that USDC DOMINANCE is currently on a path to print a HEAD & SHOULDER pattern.
A break below the neckline will be great for BTC and ALT coins, break below will be the trigger point for the whole market to rally upside.
Let’s see how USDC reacts at the neckline level.
Bounce from that level will form red candles in ALTS.
NOTE: This is not financial advice. This is for education purposes only. I am not responsible for the profits or losses you generate from your investments.
DO YOUR RESEARCH BEFORE MAKING ANY TRADES.
Thank you.

BTC & Stablecoins - New ATH for Stablecoin DominanceAs the title says - Bitcoin continues to lose it's position in the market, giving up ground to stablecoins. In theory this dry powder is waiting for entries back to Bitcoin, but we'll need to dig a little deeper to see how Ethereum and alts are performing, and see which recovers faster in time.

#USDC.DOMINANCE PRINTING BEARISH DIVERGENCE IN DAILY CHART !!Hello, community members welcome to another BTC/USDT chart update.
If you find this update helpful, shoot the like button follow and share your views in the comment section.
As we can see from the above-mentioned chart that USDC DOMINANCE is currently printing a bearish divergence and it can move down from here.
The candle close above will be harsh for bull traders in USDT pair coins.
Let’s hope for the best and see how the market performs in the upcoming hours.
NOTE: This is not financial advice. This is for education purposes only. I am not responsible for the profits or losses you generate from your investments.
DO YOUR RESEARCH BEFORE MAKING ANY TRADES.
Thank you.

Usdt.D higher highs!!Usdt.D broke the box which was there for weeks and now is ready to go to the moon!!
Already published my ideas on stable coin charts and still they are the ones which seem more likely to go the moon than any other crypto project out there :)
Keep your capital safe.

The Crypto Market Dynamics and BreakdownA brief overview of BTC , TOTAL, TOTAL2 , USDT dominance, USDC dominance and DXY (dollar strength index).
So guys, i thought id post an update on the most recent crypto market developments, i plan to push out a video alongside this too to break it down in depth but heres what im seeing developing so far.
Ive correlated 6 charts that i think are worth looking at on a whole to get an idea of market wide developments. BTC , the driver of the market direction. Stablecoin dominance pairs, showing the relationship of money flow in and out of stablecoins back into the market (highly correlated with reversals), TOTAL and TOTAL2 , the total crypto market caps for ALTS and for BTC and ALTS to see overall bullish / bearish intensions, and the DXY (dollar strength index) which has been known to work inversely with BTC market reversals. E.g, when DXY is pumping, crypto is correcting and vice versa.
I think at present theres more downside risk than upside potential having cleared the charts and looking at the in a new perspective. I am still longer term bullish until we break and close below 28K which would confirm a new LL, breaking the range we've been in for the last year and invalidating any bullish momentum. However at current we have put in a new HH on TOTAL and TOTAL 2 and respecting the swing low so things remain to be bullish based on HTF structure for both marketcap pairs. That being said it seems as though we have been generating liquidity on both the buy and sell side on BTC , where due to having an inefficiency to fill to the left, price has nothing to liquidate as there is no structure to target to run stop losses. Therefore, what we have been developing is this upwards bearish flag formation after coming into HTF weekly demand. Buyers have shown presence with higher volume coming in at the lows and respecting an uptrend, but with the intension to mitigate the HTF supply above taking out the sell side liquidity and now targeting the buy side liquidity, sweeping the first low we have put in within the weekly demand range to target the extreme demand range on the weekly and daily timeframes. This would have induced both buyers and sellers into the market to liquidate them all enabling a capitulation event to take place to fuel the move higher. This same scenario looks likely to occur on both the TOTAL and TOTAL2 pairs too.
Stablecoin pairs did start to show some bearish signs with bearish divergence on the RSI and putting in new lower lows on the daily TF and weekly TF with bearish momentum coming in as shown by the engulfing candles and also respecting HTF supply. However, we have continued to the upside with less momentum and approaching key supply zones now. If price manages to push through these then it would be a continuation to the upside for stablecoins and bearish for the rest of the market. Right now its just a case of being patient and watching for signs of bearish structure change on the daily TF as we come into the zones. I think theres a possibility for them to push higher and fake out the highs, creating that capitulation event before reversing and becoming bearish with the market becoming bullish after such an event.
DXY is bullish on the weekly, but remains bearish on the monthly timeframe , coming into HTF supply range on the monthly TF in the premium of the leg. Im expecting the DXY to take out the highs, liquidating the highs, come into that HTF supply and reverse before starting to take out the lows. It looks oversold on the RSI on weekly and monthly and usually results in a reversal at these points. It works inversely to BTC so if the DXY becomes bearish it would be a good sign for the crypto market.
The dynamics are correlating to show short term bearish momentum for a possible long term bullish outlook. The on chain analysis also supports this with supply still getting taken and large volumes on outflow activity occurring. That being said, the economy on a whole look bleak right now, stocks look terrible and BTC has held up pretty well so far in comparison. Talks of one of the biggest recessions is also looming with a macro economic POV that looks pretty trash right now so its all a little uncertain at present, not just for crypto but with the larger economic outlook.

Mini Altseason incoming! Pay attention to usdt dominance!The stablecoin dominance will crash down meaning a pump is incoming! I have a feeling alts will gain the most in percentage terms.
Bullish on altcoins!

Full market reversal incoming USDC.D bearishIve published my analysis on stable coins over the last month now as I think its one of the most import charts to analyse for market reversals watching the money flow between stable coins and crypto assets such as alts and BTC.
The previous highs and lows have coincided exactly with the start of new uptrends and corrections in the market since the charts inception.
USDC.D has been becoming increasingly bearish over the last month showing a lot of bearish divergence on RSI with a bearish shooting star candle on the weekly. Price action has changed bearish on daily chart putting in a new lower low and as a result the market has started to see pumps in altcoins and BTC.
The weekly MACD looks bearish with MAs converging showing weakening trend on HTF with engulfing bearish weekly candle close on the week prior showing sell side pressure.
I think a market wide reversal is on the horizon and this is just the start of a new uptrend forming


The last time USDC.D broke below 50ema.The last time USDC.D broke below 50ema(white line)
The chart speaks for itself..

USDC.D hidden bearish divergence USDC dominance is showing a hidden bearish divergence on the weekly. Macro good time to deploy USDC and not hold stables. Bearish USDC dominance trend reversal = bullish crypto market trend reversal.

USDCD looking bearish USDC.D
1W/2D Charts
USDC dominance continuing to look bearish here as I mentioned back in early Feb.
Rejecting from the previous high and failed to put in a HH and close above it. Weekly close looks daily bearish with a bearish shooting star reversal candle.
Market structure has changed failing to put in a HH with price struggling to maintain the uptrend. Bearish momentum starting with bigger sell candles printing.
RSI is bearish having lost the MA on 2D chart which on the last 3 occasions has started the downtrend in USDC.D and uptrends within the market for BTC and altcoins as shown by the black arrows and callouts. Also showing bearish divergence on the RSi and weekly MACD starting to converge.
Looking good here for USDC.D as well showing the dynamics shifting and money flow exiting stables and into the market.
Id still be cautious given the macro economic POV but the TA looks great here. As I’ve been saying, coins have been in weekly lows and demand zones and good for DCA buys which I’ve been doing on some coins.

USDC.D Becoming bearish?1W/1D Charts
USDC dominance starting to decrease now forming a reversal candlestick pattern on the weekly and a nice engulfing candle with the MACD showing signs of weakness with the MAs starting to converge.
Id like to see price fail to retest the previous high and come back into the range for the market to remain bullish and with stable coin flow coming into the markets

Double Top on USDC marketcap dominance - Bullish for BITCOIN!Hopefully we get a reversal soon and confirm the double top on USDC dominance.
This could be MEGA FREAKING BULLISH for crypto.
Going from 2.2% back to 1% would be incredibly bullish!
