(USDCAD, 1-hour timeframe).(USDCAD, 1-hour timeframe), I see that you have drawn a bullish setup with:
Price breaking above a resistance zone (yellow box around 1.3860 – 1.3870).
An ascending trendline supporting the move.
Ichimoku cloud showing bullish momentum.
My chart already marks a "Target Point" around 1.3940.
📍
About U.S. Dollar / Canadian Dollar
The US Dollar vs. the Canadian Dollar is a very popular currency pair due to the extremely large amount of cross border trading that occurs between the U.S. and Canada. The CAD is considered to be a commodity currency because of the large amount of natural resources, especially oil, that are mined and exported to southern neighbors. The USDCAD is one of the most traded currency pairs in the world.
Related currencies

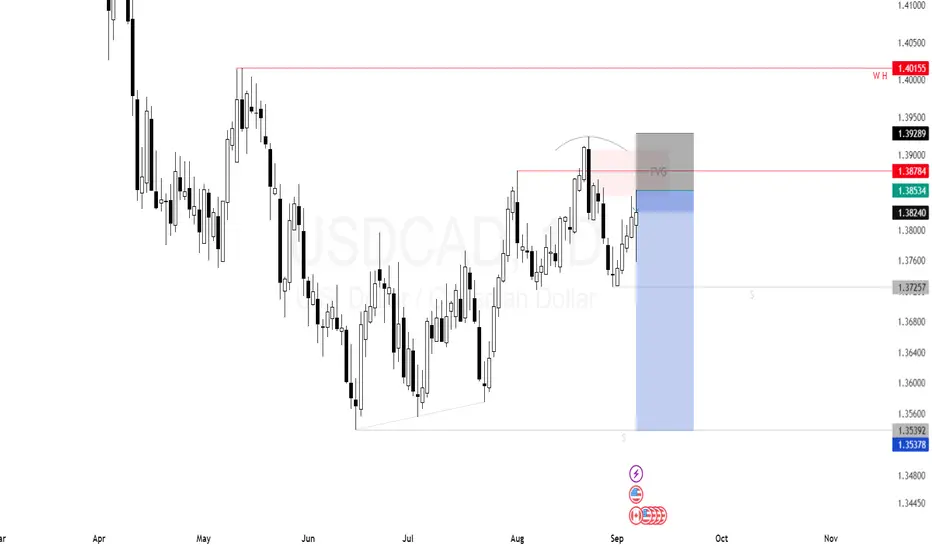
USD/CAD – Wave Analysis Outlook The current structure on USD/CAD shows price unfolding within a developing corrective sequence. The market has been progressing in overlapping swings, hinting at a temporary continuation higher before a potential reversal.
Based on wave analysis, price appears to be completing a smaller-degree upwa

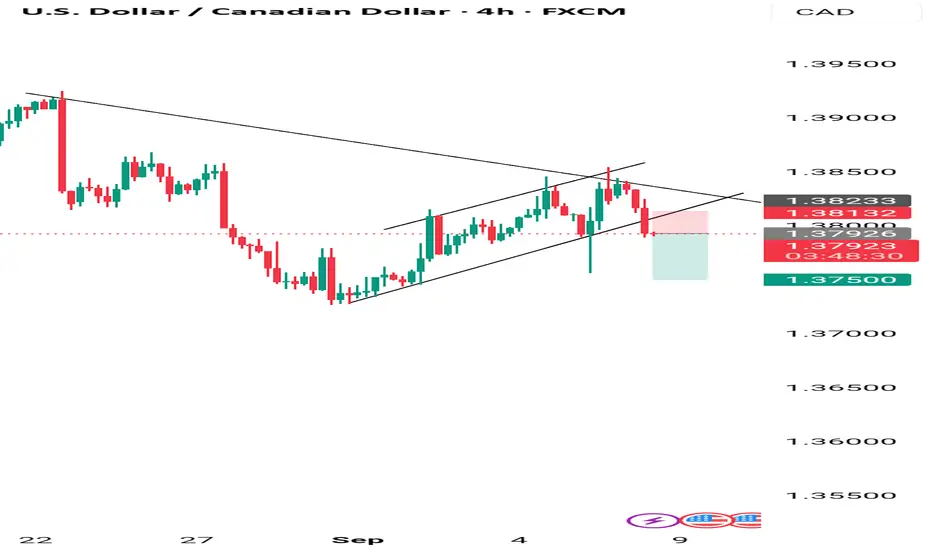
USDCAD Double Top Signals a Potential BreakdownUSDCAD pair is testing a critical resistance area near 1.3830 after a strong rebound. But the price structure is beginning to flash signs of exhaustion. With repeated rejections and a clear double-top pattern forming, the setup favors a bearish move. If momentum turns, we could see a meaningful corr

Possible SHORT on USDCADSo, there's kind of a Bearish Flag pattern break and it has broken out so I'm expecting a minor Sell. 🤞🏾
USDCAD BUY!!Sold off aggressively targeting the previous days high , expecting price to continue on an upward trend


USD/CAD - Bullish Pennant (04.09.2025)The USD/CAD pair on the M30 timeframe presents a Potential Buying Opportunity due to a recent Formation of a Bullish Pennant Breakout Pattern. This suggests a shift in momentum towards the upside and a higher likelihood of further advances in the coming hours.
Possible Long Trade:
Entry: Conside

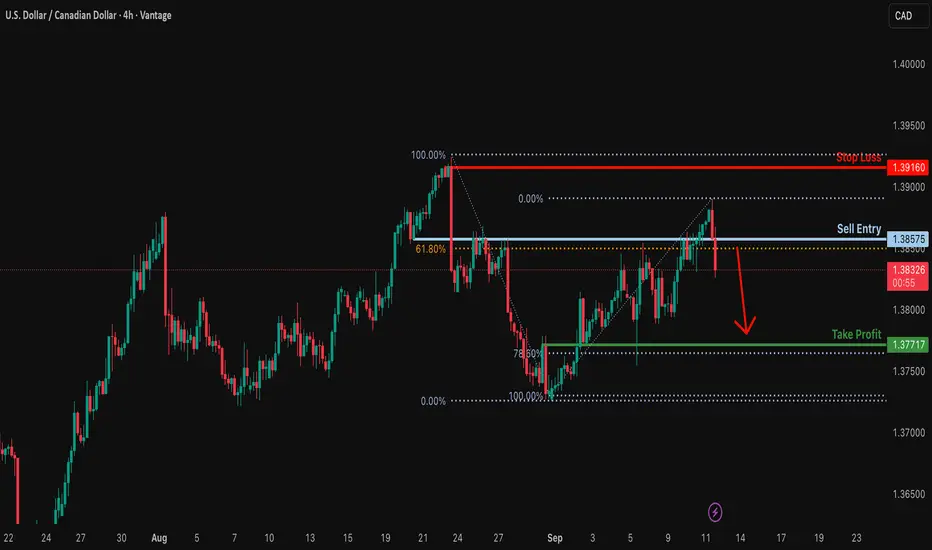
USDCAD (Daily) – Swing Short Setup📉 USDCAD (Daily) – Swing Short Setup
USDCAD has tapped into a Fair Value Gap (FVG) while simultaneously sweeping liquidity above recent highs (~1.3929). This classic combination of a liquidity grab + imbalance fill points toward bearish continuation.
🔑 Why bearish?
• Liquidity above 1.3929 has be
Potential bearish drop?USD/CAD is reacting off the resistance level which is a pullback resistance that aligns with the 61.8% Fibonacci retracement and could drop from this level to our take profit.
Entry: 1.3857
Why we like it:
There is a pullback resistance level that lines up with the 61.8% Fibonacci retracement.
Sto
Bullish rise?The Loonie (USD/CAD) could fall to the pivot and bounce to the 1st resistance, which acts as a swing high resistance.
Pivot: 1.3828
1st Support: 1.3791
1st Resistance: 1.3918
Disclaimer:
The above opinions given constitute general market commentary, and do not constitute the opinion or advice of

See all ideas
Displays a symbol's price movements over previous years to identify recurring trends.
Frequently Asked Questions
The value of the USDCAD pair is quoted as 1 USD per x CAD. For example, if the pair is trading at 1.50, it means it takes 1.5 CAD to buy 1 USD.
USDCAD is a major currency pair, i.e. a popular currency paired with USD.
Currencies are usually traded through forex brokers — choose the one that suits your needs and go ahead. You can trade USDCAD right from TradingView charts — just log in to you broker account. Check out the list of our integrated brokers and find the best one for your needs and strategy.