(USDCAD, 1-hour timeframe).(USDCAD, 1-hour timeframe), I see that you have drawn a bullish setup with:
Price breaking above a resistance zone (yellow box around 1.3860 – 1.3870).
An ascending trendline supporting the move.
Ichimoku cloud showing bullish momentum.
My chart already marks a "Target Point" around 1.3940.
📍 Target: Based on my analysis, the next resistance level is around 1.3940 – 1.3950.
That’s my immediate upside target if the breakout holds.
⚠ Watch for retests of 1.3860 support (former resistance) before continuation.
USDCAD trade ideas

USD/CAD – Wave Analysis Outlook The current structure on USD/CAD shows price unfolding within a developing corrective sequence. The market has been progressing in overlapping swings, hinting at a temporary continuation higher before a potential reversal.
Based on wave analysis, price appears to be completing a smaller-degree upward leg that could stretch toward the 1.39 – 1.40 zone.
Once that phase matures, the larger context suggests the market may transition into the next downward leg, aligning with the broader corrective cycle.
A failure to sustain above the 1.40 handle would strengthen the bearish case, opening the path toward deeper downside projections.
This perspective highlights how wave formations often build in layers—smaller moves feeding into larger corrective patterns. The key is to observe whether the market respects the unfolding sequence or extends beyond it, which will reveal the true wave count in play.
⚠️ Disclaimer: This post reflects my personal wave analysis for educational purposes only. It is not financial advice. Trading carries risk, and you should always do your own research before making decisions.

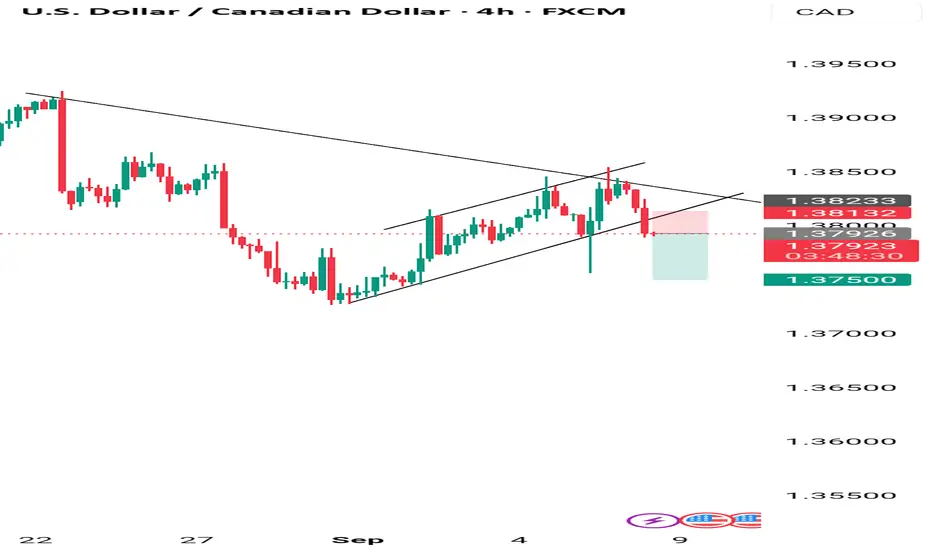
USDCAD Double Top Signals a Potential BreakdownUSDCAD pair is testing a critical resistance area near 1.3830 after a strong rebound. But the price structure is beginning to flash signs of exhaustion. With repeated rejections and a clear double-top pattern forming, the setup favors a bearish move. If momentum turns, we could see a meaningful correction toward the 1.3730 support zone, with deeper downside risk into mid-September.
Current Bias
Bearish rejection at resistance, structure favors downside continuation.
Key Fundamental Drivers
Canada: Weak August jobs report (unemployment 7.1%, wages cooling) raised BoC cut expectations, pressuring CAD. But oil prices (Brent ~$65) limit the downside risk, giving CAD some commodity support.
U.S.: Weaker jobs (+142k NFP, unemployment 4.3%) keeps Fed cuts on the table, capping USD upside. Core PCE sticky at 2.9%, but inflation trend is moderating.
Macro Context
Interest Rates: Fed expected to cut in coming months; BoC markets price ~90% chance of a September cut.
Economic Growth: U.S. slowing but still resilient, Canada contracting (Q2 GDP −0.4% q/q).
Commodities: Oil’s soft rebound provides CAD with some stability.
Geopolitics: Trade tensions (U.S. tariffs, China-Russia bond coordination) keep USD supported as a defensive hedge.
Primary Risk to the Trend
A sharp oil sell-off would weaken CAD and trigger USD/CAD upside.
U.S. CPI surprise to the upside could reprice Fed expectations, boosting USD.
Most Critical Upcoming News/Event
U.S. CPI (this week): Will decide Fed cut timing.
BoC September rate decision: High probability of a cut, market focus on forward guidance.
Leader/Lagger Dynamics
USD/CAD is typically a lagger — following USD direction (via Fed expectations) and CAD flows (via oil). It often mirrors oil price action and diverges from USD/JPY, reflecting risk sentiment shifts.
Key Levels
Support Levels: 1.3732, 1.3585
Resistance Levels: 1.3830, 1.3875
Stop Loss (SL): 1.3875
Take Profit (TP): 1.3732 (first), 1.3585 (extended)
Summary: Bias and Watchpoints
USD/CAD is leaning bearish after failing to break cleanly above 1.3830. Fundamentals point to a tug-of-war between dovish BoC expectations and weaker U.S. data, but the chart structure favors downside into 1.3732 and potentially 1.3585. My stop loss sits above 1.3875 to protect against a breakout. Watch U.S. CPI as the key driver: a hotter print could revive USD strength, while a softer read could accelerate CAD gains. Oil’s stability remains a secondary but important factor for CAD resilience.

Possible SHORT on USDCADSo, there's kind of a Bearish Flag pattern break and it has broken out so I'm expecting a minor Sell. 🤞🏾
USDCAD BUY!!Sold off aggressively targeting the previous days high , expecting price to continue on an upward trend


USD/CAD - Bullish Pennant (04.09.2025)The USD/CAD pair on the M30 timeframe presents a Potential Buying Opportunity due to a recent Formation of a Bullish Pennant Breakout Pattern. This suggests a shift in momentum towards the upside and a higher likelihood of further advances in the coming hours.
Possible Long Trade:
Entry: Consider Entering A Long Position around Trendline Of The Pattern.
Target Levels:
1st Resistance – 1.3835
2nd Resistance – 1.3853
🎁 Please hit the like button and
🎁 Leave a comment to support for My Post !
Your likes and comments are incredibly motivating and will encourage me to share more analysis with you.
Best Regards, KABHI_TA_TRADING
Thank you.
Disclosure: I am part of Trade Nation's Influencer program and receive a monthly fee for using their TradingView charts in my analysis.

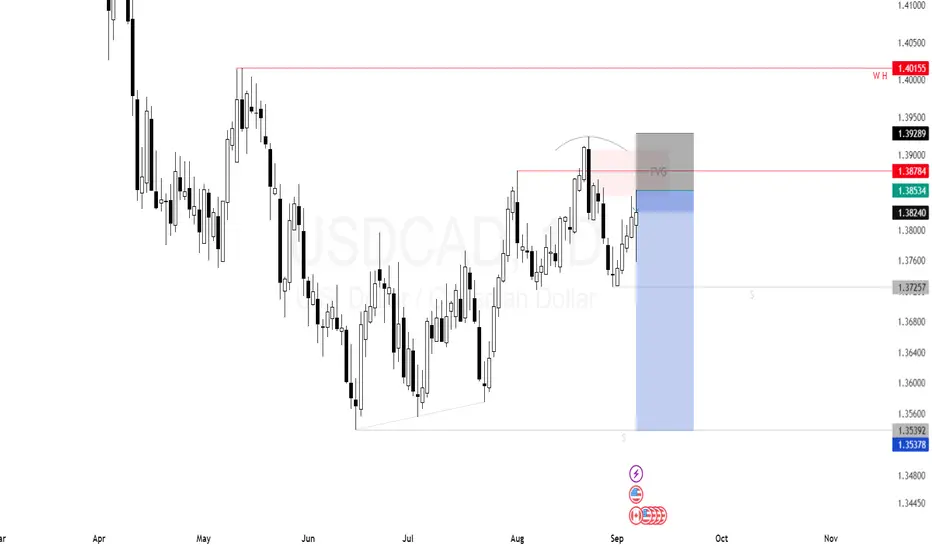
USDCAD (Daily) – Swing Short Setup📉 USDCAD (Daily) – Swing Short Setup
USDCAD has tapped into a Fair Value Gap (FVG) while simultaneously sweeping liquidity above recent highs (~1.3929). This classic combination of a liquidity grab + imbalance fill points toward bearish continuation.
🔑 Why bearish?
• Liquidity above 1.3929 has been swept, leaving a liquidity trap behind.
• Price reacted inside the FVG, a common reversal zone after a sweep.
• Bearish order flow suggests price is likely to target liquidity pools below ~1.3538.
📌 Trade Plan:
• Entry: ~1.3853 (short)
• Stop: Above 1.3929
• Target: 1.3538 (next liquidity pool)
• R:R: ~1:4 (risking ~75 pips to capture ~315 pips)
Again, this is a swing setup on the daily timeframe – patience is required, but the structure supports downside expansion.
⚠️ Risk management is the key.
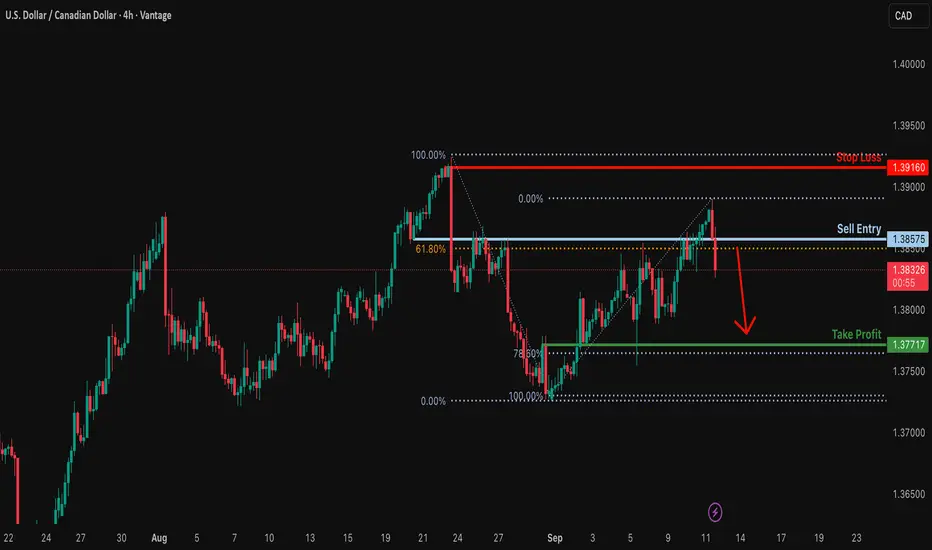
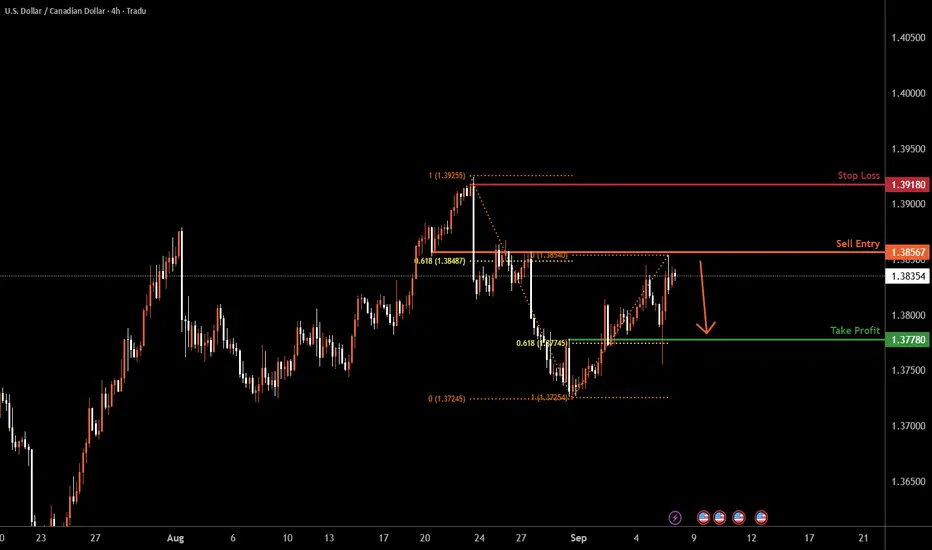
Potential bearish drop?USD/CAD is reacting off the resistance level which is a pullback resistance that aligns with the 61.8% Fibonacci retracement and could drop from this level to our take profit.
Entry: 1.3857
Why we like it:
There is a pullback resistance level that lines up with the 61.8% Fibonacci retracement.
Stop loss: 1.3916
Why we like it:
There is a swing high resistance level.
Take profit: 1.3771
Why we like it:
There is a pullback support that aligns with the 78.6% Fibonacci retracement.
Enjoying your TradingView experience? Review us!
Please be advised that the information presented on TradingView is provided to Vantage (‘Vantage Global Limited’, ‘we’) by a third-party provider (‘Everest Fortune Group’). Please be reminded that you are solely responsible for the trading decisions on your account. There is a very high degree of risk involved in trading. Any information and/or content is intended entirely for research, educational and informational purposes only and does not constitute investment or consultation advice or investment strategy. The information is not tailored to the investment needs of any specific person and therefore does not involve a consideration of any of the investment objectives, financial situation or needs of any viewer that may receive it. Kindly also note that past performance is not a reliable indicator of future results. Actual results may differ materially from those anticipated in forward-looking or past performance statements. We assume no liability as to the accuracy or completeness of any of the information and/or content provided herein and the Company cannot be held responsible for any omission, mistake nor for any loss or damage including without limitation to any loss of profit which may arise from reliance on any information supplied by Everest Fortune Group.
Bullish rise?The Loonie (USD/CAD) could fall to the pivot and bounce to the 1st resistance, which acts as a swing high resistance.
Pivot: 1.3828
1st Support: 1.3791
1st Resistance: 1.3918
Disclaimer:
The above opinions given constitute general market commentary, and do not constitute the opinion or advice of IC Markets or any form of personal or investment advice.
Any opinions, news, research, analyses, prices, other information, or links to third-party sites contained on this website are provided on an "as-is" basis, are intended only to be informative, is not an advice nor a recommendation, nor research, or a record of our trading prices, or an offer of, or solicitation for a transaction in any financial instrument and thus should not be treated as such. The information provided does not involve any specific investment objectives, financial situation and needs of any specific person who may receive it. Please be aware, that past performance is not a reliable indicator of future performance and/or results. Past Performance or Forward-looking scenarios based upon the reasonable beliefs of the third-party provider are not a guarantee of future performance. Actual results may differ materially from those anticipated in forward-looking or past performance statements. IC Markets makes no representation or warranty and assumes no liability as to the accuracy or completeness of the information provided, nor any loss arising from any investment based on a recommendation, forecast or any information supplied by any third-party.

Bearish setup in play?The Loonie (USD/CAD) has rejected off the pivot and could drop to the 1st support, which acts as a multi-swing low support.
Pivot: 1.3828
1st Support: 1.3729
1st Resistance: 1.3920
Disclaimer:
The above opinions given constitute general market commentary, and do not constitute the opinion or advice of IC Markets or any form of personal or investment advice.
Any opinions, news, research, analyses, prices, other information, or links to third-party sites contained on this website are provided on an "as-is" basis, are intended only to be informative, is not an advice nor a recommendation, nor research, or a record of our trading prices, or an offer of, or solicitation for a transaction in any financial instrument and thus should not be treated as such. The information provided does not involve any specific investment objectives, financial situation and needs of any specific person who may receive it. Please be aware, that past performance is not a reliable indicator of future performance and/or results. Past Performance or Forward-looking scenarios based upon the reasonable beliefs of the third-party provider are not a guarantee of future performance. Actual results may differ materially from those anticipated in forward-looking or past performance statements. IC Markets makes no representation or warranty and assumes no liability as to the accuracy or completeness of the information provided, nor any loss arising from any investment based on a recommendation, forecast or any information supplied by any third-party.


USDCAD SELL OPPORTUNITYHello traders, volatility slowly coming back and we already are benefiting from interesting trade opportunities. New week means new opportunities Here's my point of view about CMCMARKETS:USDCAD
TECHNICALLY:
AS explained before the red area around 1.38500 was a make or break area. I was looking to see some action around that H4-DAILY KEY LEVEL SELL ZONE. Last week price totally rejected the zone and this week we are clearly seeing rejections.
As long as we stay BELOW 1.38500 we can consider to look for SELL entries at pullback but only if fundamentals, confluences & confirmations align. This setup requires for US DOLLAR / DXY
DXY TO BE WEAK. or CAD strong (which can be the case due to fundamentals). Otherwise, the area will be completely invalidated and we will have a deeper pullback/ retracement.
You may find more details in the chart!
Thank you and Good Luck! MAKE SURE TO STAY STRICT WITH YOUR RISK MANAGEMENT!
PS: Please support with a like or comment if you find this analysis useful for your trading day.

USDCAD: Pullback Trade From Support 🇺🇸🇨🇦
USDCAD is going to bounce from a strong intraday horizontal support.
My confirmation signal is a formation of a double bottom pattern
on that and a breakout of its horizontal neckline.
I expect move up to 1.3855
❤️Please, support my work with like, thank you!❤️
I am part of Trade Nation's Influencer program and receive a monthly fee for using their TradingView charts in my analysis.


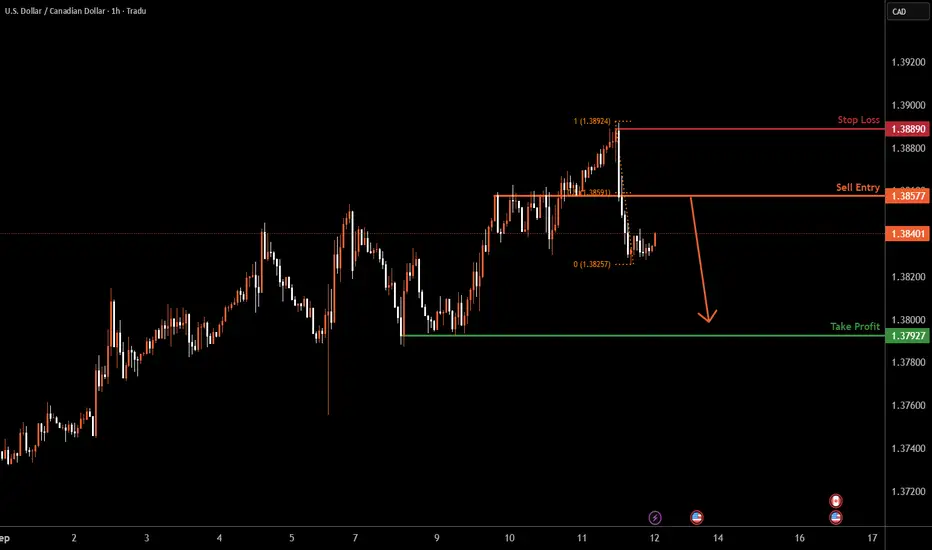
USDCAD H1 | 50% Fibonacci resistance signals bearish reversalLoonie (USD/CAD) is rising towards the sell entry, which is a pullback resistance that aligns with the 50% Fibonacci retracement and could reverse from this level to the downside.
Sell entry is at 1.3857, which is a pullback resistance that aligns with the 50% retracement.
Stop loss is at 1.3792, which is a swing high resistance.
Take profit is at 1.3792, which is a pullback support.
High Risk Investment Warning
Trading Forex/CFDs on margin carries a high level of risk and may not be suitable for all investors. Leverage can work against you.
Stratos Markets Limited (tradu.com ):
CFDs are complex instruments and come with a high risk of losing money rapidly due to leverage. 65% of retail investor accounts lose money when trading CFDs with this provider. You should consider whether you understand how CFDs work and whether you can afford to take the high risk of losing your money.
Stratos Europe Ltd (tradu.com ):
CFDs are complex instruments and come with a high risk of losing money rapidly due to leverage. 66% of retail investor accounts lose money when trading CFDs with this provider. You should consider whether you understand how CFDs work and whether you can afford to take the high risk of losing your money.
Stratos Global LLC (tradu.com ):
Losses can exceed deposits.
Please be advised that the information presented on TradingView is provided to Tradu (‘Company’, ‘we’) by a third-party provider (‘TFA Global Pte Ltd’). Please be reminded that you are solely responsible for the trading decisions on your account. There is a very high degree of risk involved in trading. Any information and/or content is intended entirely for research, educational and informational purposes only and does not constitute investment or consultation advice or investment strategy. The information is not tailored to the investment needs of any specific person and therefore does not involve a consideration of any of the investment objectives, financial situation or needs of any viewer that may receive it. Kindly also note that past performance is not a reliable indicator of future results. Actual results may differ materially from those anticipated in forward-looking or past performance statements. We assume no liability as to the accuracy or completeness of any of the information and/or content provided herein and the Company cannot be held responsible for any omission, mistake nor for any loss or damage including without limitation to any loss of profit which may arise from reliance on any information supplied by TFA Global Pte Ltd.
The speaker(s) is neither an employee, agent nor representative of Tradu and is therefore acting independently. The opinions given are their own, constitute general market commentary, and do not constitute the opinion or advice of Tradu or any form of personal or investment advice. Tradu neither endorses nor guarantees offerings of third-party speakers, nor is Tradu responsible for the content, veracity or opinions of third-party speakers, presenters or participants.
USDCAD: Bullish Move From Demand Zone?! 🇺🇸🇨🇦
There is a high chance that USDCAD will respect
the underlined demand zone and go up from that.
As a confirmation, I spotted an ascending triangle pattern on a 4H
time frame and a formation of a bullish imbalance candle.
Goal - 1.377
❤️Please, support my work with like, thank you!❤️
I am part of Trade Nation's Influencer program and receive a monthly fee for using their TradingView charts in my analysis.

USDCADUSD/CAD is losing momentum at resistance, suggesting sellers may drive the pair lower
#fxutrading
#usdcad
#dxy

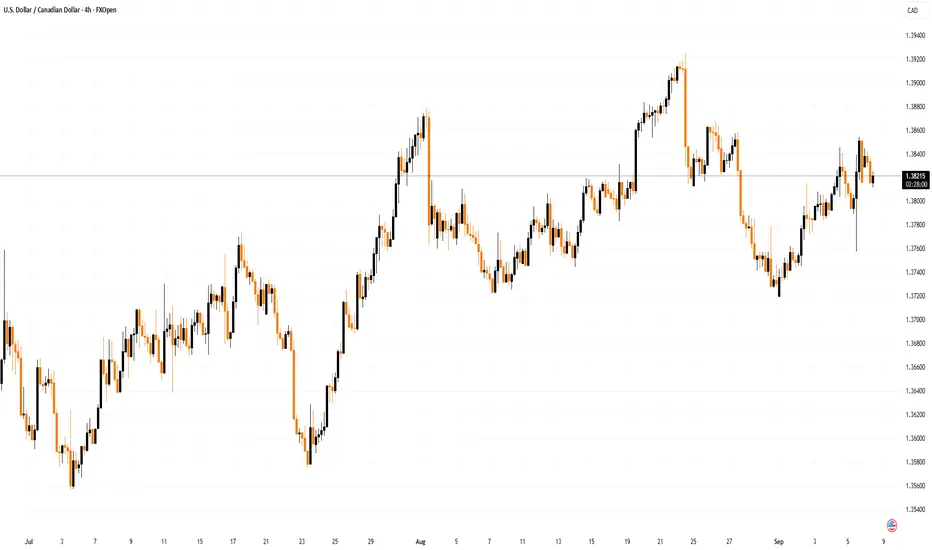
Canadian Dollar Falls After Labour Market Data ReleaseCanadian Dollar Falls After Labour Market Data Release
On Friday, disappointing figures showed that in August the Canadian economy lost 65,500 jobs (the forecast had been for an increase of 10,000), while the unemployment rate rose to 7.1%. This is the highest level of unemployment since May 2016, excluding the pandemic period.
It is believed that:
→ the deterioration in the labour market (primarily in manufacturing) is a consequence of the trade war with the United States;
→ the fall in employment in Canada has increased the likelihood that the Bank of Canada will resume its monetary easing campaign.
As a result, the CAD weakened sharply against other currencies. However, the depreciation against the US dollar was less pronounced, as the USD itself is under pressure from various factors.
Technical Analysis of USD/CAD
From a long-term perspective, the USD/CAD pair remains within a downward trend, highlighted by a red descending channel.
From a medium-term perspective, since July the rate has risen from the 1.3550–1.3600 support zone, forming an ascending channel (shown in blue).
Price action (indicated by arrows) shows that:
→ sellers are aggressive, pushing the price down from the upper boundary of the red channel;
→ buyers are aggressive, driving the price up from the lower boundary of the blue channel. Its median line acts as resistance.
This is compressing USD/CAD fluctuations into a pattern resembling a symmetrical narrowing triangle (shown in black), with recent overbought (1) and oversold (2) conditions on the RSI marking price reversals back into the triangle from its boundaries.
Thus, we could assume that supply and demand forces will keep USD/CAD in a state of temporary balance while awaiting key news next week:
→ 16 September – Canada CPI report;
→ 17 September – interest rate decisions from both the Bank of Canada and the Federal Reserve.
This article represents the opinion of the Companies operating under the FXOpen brand only. It is not to be construed as an offer, solicitation, or recommendation with respect to products and services provided by the Companies operating under the FXOpen brand, nor is it to be considered financial advice.
USDCAD H4 | Bearish reversal at key resistanceLoonie (USD/CAD is reacting off the sell entry, which is an overlap resistance that lines up with the 61.8% Fibonacci retracement and could reverse from this level to the downside.
Sell entry is at 1.3828, which is an overlap resistance that aligns with the 61.8% Fibonacci retracement.
Stop loss is at 1.3918, a swing high resistance.
Take profit is at 1.3778, which is an overlap support that aligns with the 61.8% Fibonacci retracement.
High Risk Investment Warning
Trading Forex/CFDs on margin carries a high level of risk and may not be suitable for all investors. Leverage can work against you.
Stratos Markets Limited (tradu.com ):
CFDs are complex instruments and come with a high risk of losing money rapidly due to leverage. 65% of retail investor accounts lose money when trading CFDs with this provider. You should consider whether you understand how CFDs work and whether you can afford to take the high risk of losing your money.
Stratos Europe Ltd (tradu.com ):
CFDs are complex instruments and come with a high risk of losing money rapidly due to leverage. 66% of retail investor accounts lose money when trading CFDs with this provider. You should consider whether you understand how CFDs work and whether you can afford to take the high risk of losing your money.
Stratos Global LLC (tradu.com ):
Losses can exceed deposits.
Please be advised that the information presented on TradingView is provided to Tradu (‘Company’, ‘we’) by a third-party provider (‘TFA Global Pte Ltd’). Please be reminded that you are solely responsible for the trading decisions on your account. There is a very high degree of risk involved in trading. Any information and/or content is intended entirely for research, educational and informational purposes only and does not constitute investment or consultation advice or investment strategy. The information is not tailored to the investment needs of any specific person and therefore does not involve a consideration of any of the investment objectives, financial situation or needs of any viewer that may receive it. Kindly also note that past performance is not a reliable indicator of future results. Actual results may differ materially from those anticipated in forward-looking or past performance statements. We assume no liability as to the accuracy or completeness of any of the information and/or content provided herein and the Company cannot be held responsible for any omission, mistake nor for any loss or damage including without limitation to any loss of profit which may arise from reliance on any information supplied by TFA Global Pte Ltd.
The speaker(s) is neither an employee, agent nor representative of Tradu and is therefore acting independently. The opinions given are their own, constitute general market commentary, and do not constitute the opinion or advice of Tradu or any form of personal or investment advice. Tradu neither endorses nor guarantees offerings of third-party speakers, nor is Tradu responsible for the content, veracity or opinions of third-party speakers, presenters or participants.
09-09-2025 USDCADAs shown in the figure: 15M Bearish Cypher
The market is not always chaotic and disorderly, and there is a precise geometric beauty hidden in price fluctuations. The harmonic form long strategy is a powerful tool for accurately identifying potential market reversal points based on the Fibonacci ratio. When the form forms perfectly at the key support level, it often indicates the depletion of bearish momentum and the initiation of bullish trends.

USDCAD Technical & Order Flow AnalysisOur analysis is based on a multi-timeframe top-down approach and fundamental analysis.
Based on our assessment, the price is expected to return to the monthly level.
DISCLAIMER: This analysis may change at any time without notice and is solely intended to assist traders in making independent investment decisions. Please note that this is a prediction, and I have no obligation to act on it, nor should you.
Please support our analysis with a boost or comment!

USDCAD📈 USDCAD – Buy Setup (4H TF) Based on CWT
The Alligator indicator (Jaw, Teeth, and Lips) is showing alignment in bullish direction:
