USDCAD US. Dollar / Canadian DollarIt is expected that this currency pair will start to fall after a little growth until it reaches the set limits
USDCAD trade ideas

USDCAD ANALYSISUSDCAD
This instrument has been in a downtrend for the last 8 days, only 2 days has seen bulls trying to turn the trend but failed to do so.
Last week from 22/04/2024 - 26/04/2024 we had a bearish close on the weekly candle.
The chart below outline where our point of interest is, stay patience and wait for the levels to be reached and it should give direction on this pair.
Trend is your friend for any possible trades executions.

Forex Weekly Planning Session 28 Apr, 2024Plan your trades and trade your plan. The weekly planning session is one of the most important things you can do as a trader.
In this session, I analysed the Currency Index basket of the USD, EUR, GBP, CAD, CHF, AUD, NZD, and JPY.
The strength lies with the USD, the rest are still in a confirmed downtrend.

SELL USDCAD 💲💀💲 №310FX:USDCAD
Trading Forex and other financial products with leverage is highly risky and can result in substantial losses. Trading in the market may not be suitable for everyone. You need to be aware of all the risks and seek the help of independent financial advisors if you have any questions or doubt


USD/CAD LongPrice is coming down to a key area I expect a re test at that area and for price to go up

USDCAD Potential DownHello guys, as you can see in the Timeframe Weekly, the USDCAD now in range sideways
Price Movement Up to 1.38 and Down to 1.32 Since October 2022.
1.38 is the strong Resistant and 1.32 is the Strong Support
And now you can see the Price make reverse in 1.38 with bearish candle, potential target is Down until demand area 1.32
The prices will be Up Tren If it goes breakout the 1.38

USDCAD chart pattern breakout A possible breakout of a continuation flag in the 4hr timeline. If breakout occurs then price will move upwards to previous highest high, an area of interest/take profit.

USDCAD OUTLOOK Outlook 1:
Expecting price falls to the 0.6 fib level around the psychological level of 1.36000. We can also see that that this area has been heavily tested this year. That being said, Lower timeframe confirmation will be necessary as price could easily continue bearishly.
Outlook 2:
For price to challenge the 0.7 fib level around the psychological level of 1.35600. We can also see a 4hr bearish candle before the bullish impulsive move, therefore an order block would be adequate.

USDCAD in the first half of 2024A glimpse of the USDCAD in the first half of 2024
Stay with me to get more analysis after following me by sharing with friends and leaving a comment.
According to my risk and capital management system, the risk of each trade is one percent per position.
What do you think about this analysis and other analyses?
What symbol would you like me to analyze for you?

USDCAD SetupThis is my Setup to go Short on Usdcad. Look for the LTF confirmation before taking any kind of entry.

USDCAD +90 Pips Congratulations All the price is standing at a strong area of resistance since Oct 2022 this area pushes the price each time very strongly. the second entry reason is that the price created this reversal head and shoulders pattern so we can enter a sell trade directly around the neckline

USDCAD LONGThis is just simple trading idea draw into chart using labels and lines. Please use it as educational purpose and you are free to modify any

UC trend shifting to the downside.
The USD/CAD pair is currently encountering resistance at a key liquidity pool, and our algorithms are signaling a potential shift towards a downward trend.

USD/CAD SELLERS WILL DOMINATE THE MARKET|SHORT
Hello,Friends!
USD/CAD pair is in the uptrend because previous week’s candle is green, while the price is evidently rising on the 2H timeframe. And after the retest of the resistance line above I believe we will see a move down towards the target below at 1.364 because the pair overbought due to its proximity to the upper BB band and a bearish correction is likely.
✅LIKE AND COMMENT MY IDEAS✅

USDCAD: Bullish Confirmation?! 🇺🇸🇨🇦
USDCAD leaves multiple bullish clues after a test of a key daily support.
One of those is a bullish breakout of a resistance line of a falling parallel
channel on an hourly time frame.
The pair may bounce today.
Goal - 1.3685
❤️Please, support my work with like, thank you!❤️

USDCAD Bullish EntryThe market is showing a Strong Bullish Trend and Coming for a Pullback to Fib 0.50 level will be a strong level for a buying opportunity looking for a buy with a 1:1 risk to reward entry on 1H

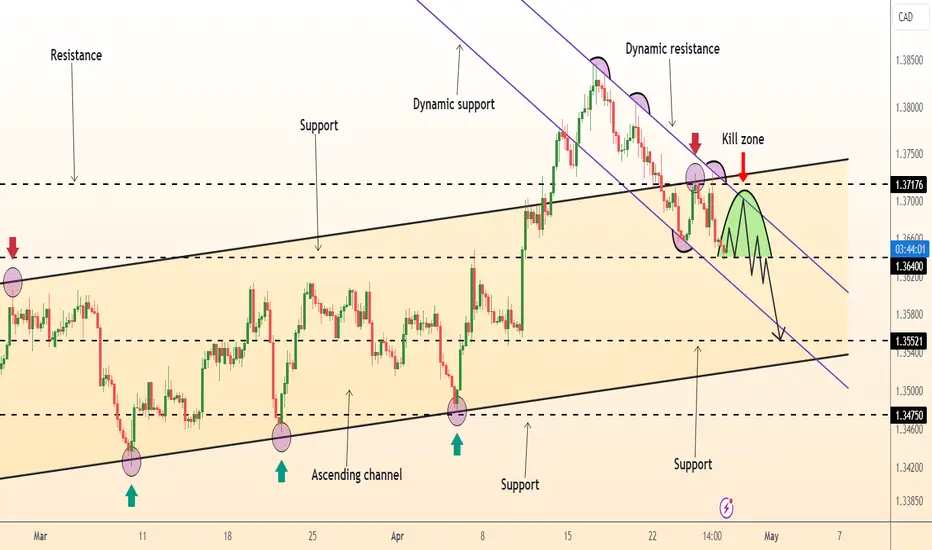
DeGRAM | USDCAD channel pullbackUSDCAD is back within the channel.
The price chart retested the channel boundaries and dynamic resistance.
We expect a decline within the channel after overcoming the current level.
-------------------
Share your opinion in the comments and support the idea with like. Thanks for your support!
USD CAD WILL RISEif usd cad manage to break that counter trendline i will be buy. considering the bullish structure of usd

Why I Think USDCAD Will Sell This Week...Technical Analysis Hey Rich Friends,
Happy Tuesday! Here is my technical analysis for USDCAD. Always check the news and cross-reference the indicators on your chart before entering any trades. I think that there are opportunities to sell and here is what I am looking at:
- The market has already rejected a previous supply zone on the weekly time frame
- There is an evening star pattern that has formed, which is a bearish reversal confirmation
- The fast line (blue) of the STOCH has crossed below the 80 line, and is facing down and the slow line (orange) is above the fast line (blue), which confirms the bearish trend for me
Signals to wait for before entering at market execution:
- Wait for the slow line (orange) on the STOCH to also cross below the 80 line
- Wait for the 3 EMA (blue) to cross above the 10 EMA (purple)
I have entered this trade at market execution but I also have pending sell limit orders for this trade. My SL will be above a previous high and my TPs will target previous lows.
Great luck if you get into this trade and happy trading!
Peace and Profits,
Cha

USD/CAD Daily Chart OutlookUSD/CAD Daily Chart Outlook
USD/CAD is consolidating and might aim for a move above the 1.3760 resistance zone.
Important Takeaways for USD/CAD Analysis Today
USD/CAD is showing positive signs above the 1.3660 support zone.
There is a major bullish trend line forming with support at 1.3620 on the daily chart at FXOpen.
USD/CAD Technical Analysis
On the daily chart of USD/CAD at FXOpen, the pair formed a strong support base above the 1.3180 level. The US Dollar started a fresh increase above the 1.3370 resistance against the Canadian Dollar.
The pair cleared the 50-day simple moving average and climbed above 1.3600. Finally, it tested the 1.3850 zone before there was a downside correction. The pair traded below the 1.3760 support zone. The pair dipped below the 23.6% Fib retracement level of the upward move from the 1.3477 swing low to the 1.3845 high.
However, the pair is now stable above 1.3660, and the 50% Fib retracement level of the upward move from the 1.3477 swing low to the 1.3845 high.
There is also a major bullish trend line forming with support at 1.3620. Initial resistance sits near the 1.3760 level. A clear upside break above 1.3760 could start another steady increase. The next major resistance is the 1.3845 level.
A close above the 1.3845 level might send the pair toward the 1.3950 level. Any more gains could open the doors for a test of the 1.4000 region.
Conversely, the pair could start another decline. Initial support is near the 1.3660 level on the same USD/CAD chart. The next major support is near 1.3620. A downside break below the 1.3620 level could push the pair further lower. The next major support is near the 50-day simple moving average, below which the pair might visit 1.3370.
This article represents the opinion of the Companies operating under the FXOpen brand only. It is not to be construed as an offer, solicitation, or recommendation with respect to products and services provided by the Companies operating under the FXOpen brand, nor is it to be considered financial advice.

The USDCAD is moving in a Downward trend.Currently, the USDCAD is in a downtrend and exhibiting a double-top pattern, suggesting a continuation of the downward trend. Given this scenario, we can seize the opportunity to capitalize on the trend by initiating a short position at the market price.

Friday will be bullish Watch for CHOCH on 15m TF enter and ride the bullish train to the Poi for Friday
