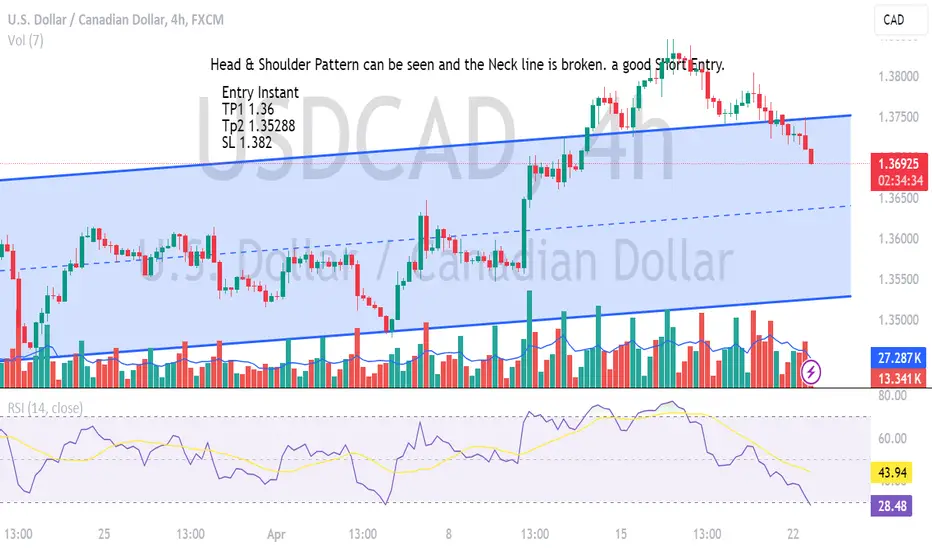
USDCAD Head & Shoulder Pattern with Neckline BrokenA Head & Shoulder Pattern at 4h TF of USDCAD. A good Short Entry. This is not a financial advice Please DYOR
USDCAD trade ideas
usdcad chartUSD/CAD is the forex ticker that represents the US Dollar-Canadian Dollar currency pair. The USD/CAD rate, as indicated on the live chart, shows traders how many Canadian Dollars are required to buy one US Dollar. Follow the USD/CAD chart for live prices and stay up to date with the latest USD/CAD news, forecasts and analysis. Our expert industry insights will give you the edge to conduct thorough fundamental and technical analysis to trade this popular currency pair. usdcad confirm signal

USD/CAD bull or bearUSD/CAD has a low rsi right now and we seen some rejection off support I believe this will make a bullish play but what do you guys think?

USDCAD - Trend Reversal - Forecasting Price 1.36080USDCAD - Trend Reversal - Forecasting Price 1.36080.
Indication of trend reversal and start of bearish trend forming Head and Shoulder pattern with bearish divergence.

USDCADOn the #USDCAD currency pair, it is expected that the price trend will be bearish in the short term, depending on the technical outlook of the market.

USDCAD shortd1: into strong supply zone, then it made a bearish engulfing
h1: it's retest the ob d1 and ob h1
then 1-2-3 down wave is created with 2 high volume bearish engulfing.
Because it's a short and i have buy limit gu then i open a short usdcad by market price

usdcad short i don't talk more about big picture because this is addition position
add more position because h1 create 1 pinbar and one bearish engulfing after retest h1 key level
it also touch opening price then fall down. so all more short position


USD/CAD Will Drop Down Soon With This Reversal Patternthe price is standing at a strong area of resistance since Oct 2022 this area pushes the price each time very strongly. the second entry reason is that the price created this reversal head and shoulders pattern so we can enter a sell trade directly around the neckline

usdcad up trendIt seems that the symbole is going to change the movement of the trend and it goes up

usdcad keep selling and buy the imblance The current USD/CAD exchange rate has entered a selling zone This suggests a favorable opportunity to sell the USD against the CAD. Traders may consider setting their take profit levels at imblance, indicating the points at which they aim to exit the trade with profits. Additionally, This strategy aims to capitalize on anticipated downward movements in the USD/CAD pair, offering a structured approach to managing risk and maximizing returns in the foreign exchange market. By strategically setting take profit and stop loss levels, traders can execute their trades with confidence and discipline .

USDCAD OUTLOOKThere are a couple of reasons why i think this is possible.
1. Price is expensive
2. Price is moving in a channel, and is currently at key level. (WTF)
3. Buy Side Liquidity has been taken
4. 4hr TF chart pattern suggests price could be dropping soon.
What do you think?
Follow if you find value here.

USDCAD April 22, 2024: Waiting to Break To 52-Week HighOn April 22, 2024, OANDA:USDCAD is trading near the 6-month high (the white line) and the 52-week high (the yellow line)
A break above the yellow resistance would trigger a buy signal with a target price at the red line shown on the chart, which has the same distance to the yellow resistance as from the July bottom of 2023.

UsdCad 4HFX:USDCAD it looks like it will retest the last resistance on the 4h chart and will it be the new support...let's wait for it to reach the marked area to go long... keep an eye on this pair
www.instagram.com

USDCAD: Potential Bearish ShiftOn an hourly timeframe, USDCAD printed Head and Shoulders pattern with RSI indicating a Bearish Divergence. The pair broke the neck line and is expected to have a bearish shift.
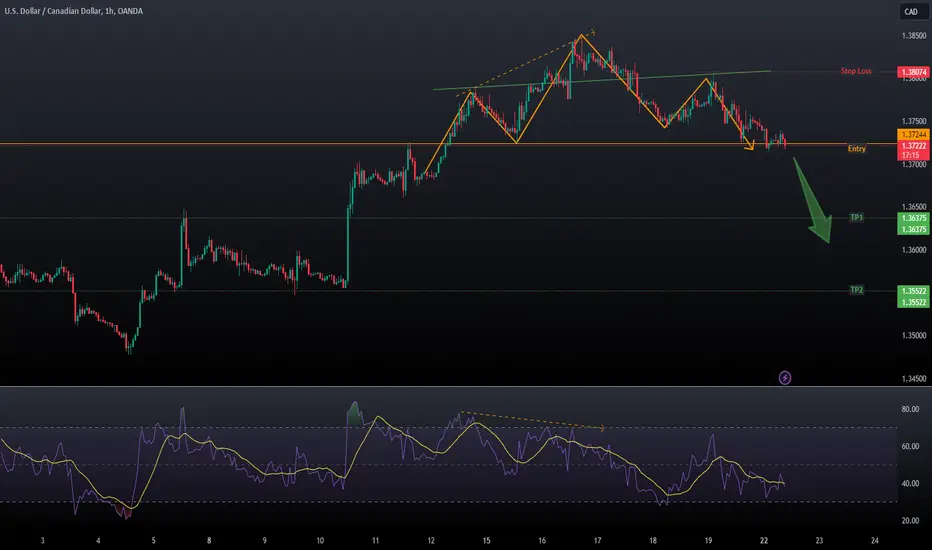
USDCAD - Head & Shoulders Pattern - 22/04/2024USDCAD has seen a strong Bullish trend. However, a clear Head & Shoulders Pattern has been observed on the 1 hour time frame, confirming reversal of trend to Bearish.
Trade Call: Short
Entry: 1.37211
SL: 1.38064
TP1: 1.36359
TP2: 1.35500


USDCADOn the monthly and weekly charts, we have bearish price action.. After a strong bearish run in 2021, the price sought to correct previous imbalance that is about to come to an end. Presently (22.04.2024), we expect price to make one final push higher, thereafter we will be looking for reversal signs.

USDCAD is Ready to Go Up(➡️RR=2.48)🏃♂️ USDCAD is moving in a Descending Channel and is currently near the Uptrend line and🟢 Support zone(1.3704 CAD_1.3618 CAD) 🟢.
💡Also, we can see Regular Divergence(RD+) between two Consecutive Valleys .
🔔I expect USDCAD to rise to at least 1.384 CAD after breaking the upper line of the descending channel.
--------------------------------------------------------------------------
USDCAD
🟢Position: Long
✅Entry Point: 1.37163 CAD (Limit Order)
⛔️Stop Loss: 1.36660 CAD
💰Take Profit:
🎯1.38047 CAD👉Risk-To-Reward: 1.76
🎯1.38411 CAD👉Risk-To-Reward: 2.48
⚠️Please don't forget to follow capital management.
⚠️Please pay attention to the style of opening the position.
--------------------------------------------------------------------------
U.S.Dollar/Canadian Dollar (USDCAD), 1-hour time frame ⏰.
Do not forget to put Stop loss for your positions (For every position you want to open).
Please follow your strategy; this is just my idea, and I will gladly see your ideas in this post.
Please do not forget the ✅' like '✅ button 🙏😊 & Share it with your friends; thanks, and Trade safe

USDCAD : Bearish Reversal Coming?!A significant head and shoulders pattern has emerged on the intraday chart of USDDCAD.
The pattern's neckline was breached during the Asian session, with a candle closing below it.
I anticipate a downward trend from here on, with the next support level likely at 1.3670.

USD/CAD 1HR // 22 April 2024 AnalysisUSD/CAD has a decent uptrend on the 1HR timeframe with 2 good touches.
We can wait to see what the price does when it reached the trendline and see if it respects the area of support/resistance marked around the 1.37000 area.
If it does respect the trendline and bounces off, we can look into potential buys. Potential target could be previous high around 1.38321.

continue to uptrend Considering that the time of the recent upward wave is short, it is expected that the correction will be formed up to the specified support levels and then the continuation of the upward trend will be likely

USD/CADThe current USD/CAD exchange rate has entered a selling zone at 1.37304. This suggests a favorable opportunity to sell the USD against the CAD. Traders may consider setting their take profit levels at 1.37041, 1.36738, and 1.36509, indicating the points at which they aim to exit the trade with profits. Additionally, it's prudent to establish a stop loss at 1.37730 to mitigate potential losses in case the market moves against the trade. This strategy aims to capitalize on anticipated downward movements in the USD/CAD pair, offering a structured approach to managing risk and maximizing returns in the foreign exchange market. By strategically setting take profit and stop loss levels, traders can execute their trades with confidence and discipline, aligning with their overall trading objectives and risk tolerance.
